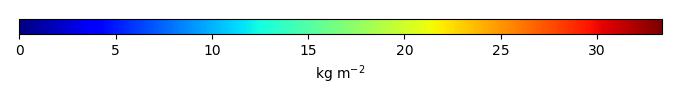
Mean State
Download Data |
Period Mean (original grids) [Pg] |
Model Period Mean (intersection) [Pg] |
Model Period Mean (complement) [Pg] |
Benchmark Period Mean (intersection) [Pg] |
Benchmark Period Mean (complement) [Pg] |
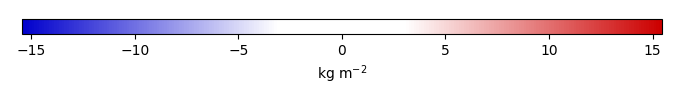
Bias [kg m-2] |
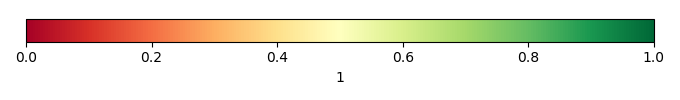
Bias Score [1] |
Spatial Distribution Score [1] |
Overall Score [1] |
|||
|---|---|---|---|---|---|---|---|---|---|---|---|---|
| Benchmark | [-] | 26.2 | ||||||||||
| CESM2_1_001 | [-] | 487. | 11.3 | 475. | 26.1 | 0.0878 | -1.58 | 0.548 | 0.705 | 0.626 | ||
| CESM2_1_002 | [-] | 487. | 11.3 | 476. | 26.1 | 0.0878 | -1.58 | 0.549 | 0.709 | 0.629 | ||
| CESM2_1_003 | [-] | 487. | 11.3 | 475. | 26.1 | 0.0878 | -1.58 | 0.548 | 0.704 | 0.626 | ||
| CRUJRA | [-] | 626. | 21.9 | 604. | 26.1 | 0.0878 | -0.225 | 0.626 | 0.879 | 0.753 | ||
| GSWP3 | [-] | 491. | 15.4 | 475. | 26.1 | 0.0878 | -1.07 | 0.598 | 0.789 | 0.694 | ||
| LENS1 | [-] | 552. | 22.8 | 529. | 26.1 | 0.0878 | -0.168 | 0.658 | 0.832 | 0.745 | ||
| LENS10 | [-] | 552. | 22.5 | 529. | 26.1 | 0.0878 | -0.200 | 0.655 | 0.833 | 0.744 | ||
| LENS5 | [-] | 554. | 22.5 | 532. | 26.1 | 0.0878 | -0.197 | 0.657 | 0.834 | 0.745 | ||
| PRINCETON | [-] | 714. | 26.6 | 688. | 26.1 | 0.0878 | 0.352 | 0.649 | 0.895 | 0.772 |
Download Data |
Period Mean (original grids) [Pg] |
Model Period Mean (intersection) [Pg] |
Model Period Mean (complement) [Pg] |
Benchmark Period Mean (intersection) [Pg] |
Benchmark Period Mean (complement) [Pg] |
Bias [kg m-2] |
Bias Score [1] |
Spatial Distribution Score [1] |
Overall Score [1] |
|||
|---|---|---|---|---|---|---|---|---|---|---|---|---|
| Benchmark | [-] | 0.00338 | ||||||||||
| CESM2_1_001 | [-] | 9.84 | 0.0225 | 9.59 | 0.00338 | 0.281 | 0.268 | 0.379 | 0.324 | |||
| CESM2_1_002 | [-] | 9.95 | 0.0205 | 9.70 | 0.00338 | 0.260 | 0.273 | 0.400 | 0.336 | |||
| CESM2_1_003 | [-] | 10.0 | 0.0214 | 9.76 | 0.00338 | 0.272 | 0.271 | 0.378 | 0.324 | |||
| CRUJRA | [-] | 12.4 | 0.0328 | 12.1 | 0.00338 | 0.460 | 0.213 | 0.231 | 0.222 | |||
| GSWP3 | [-] | 10.2 | 0.0258 | 9.96 | 0.00338 | 0.332 | 0.264 | 0.355 | 0.309 | |||
| LENS1 | [-] | 13.9 | 0.0288 | 13.7 | 0.00338 | 0.329 | 0.612 | 0.527 | 0.569 | |||
| LENS10 | [-] | 13.7 | 0.0267 | 13.4 | 0.00338 | 0.294 | 0.540 | 0.519 | 0.530 | |||
| LENS5 | [-] | 13.7 | 0.0250 | 13.4 | 0.00338 | 0.276 | 0.583 | 0.559 | 0.571 | |||
| PRINCETON | [-] | 13.7 | 0.0283 | 13.4 | 0.00338 | 0.377 | 0.257 | 0.286 | 0.271 |
Download Data |
Period Mean (original grids) [Pg] |
Model Period Mean (intersection) [Pg] |
Model Period Mean (complement) [Pg] |
Benchmark Period Mean (intersection) [Pg] |
Benchmark Period Mean (complement) [Pg] |
Bias [kg m-2] |
Bias Score [1] |
Spatial Distribution Score [1] |
Overall Score [1] |
|||
|---|---|---|---|---|---|---|---|---|---|---|---|---|
| Benchmark | [-] | 17.5 | ||||||||||
| CESM2_1_001 | [-] | 9.53 | 9.26 | 0.194 | 17.4 | 0.0333 | -1.69 | 0.599 | 0.870 | 0.735 | ||
| CESM2_1_002 | [-] | 9.58 | 9.30 | 0.195 | 17.4 | 0.0333 | -1.68 | 0.600 | 0.874 | 0.737 | ||
| CESM2_1_003 | [-] | 9.50 | 9.22 | 0.193 | 17.4 | 0.0333 | -1.70 | 0.598 | 0.871 | 0.735 | ||
| CRUJRA | [-] | 18.0 | 17.6 | 0.288 | 17.4 | 0.0333 | 0.438 | 0.688 | 0.928 | 0.808 | ||
| GSWP3 | [-] | 11.9 | 11.6 | 0.234 | 17.4 | 0.0333 | -1.09 | 0.647 | 0.882 | 0.764 | ||
| LENS1 | [-] | 18.8 | 18.3 | 0.327 | 17.4 | 0.0333 | 0.592 | 0.735 | 0.939 | 0.837 | ||
| LENS10 | [-] | 18.6 | 18.1 | 0.323 | 17.4 | 0.0333 | 0.550 | 0.732 | 0.938 | 0.835 | ||
| LENS5 | [-] | 18.6 | 18.1 | 0.327 | 17.4 | 0.0333 | 0.556 | 0.734 | 0.939 | 0.836 | ||
| PRINCETON | [-] | 19.2 | 18.8 | 0.305 | 17.4 | 0.0333 | 0.728 | 0.684 | 0.914 | 0.799 |
Download Data |
Period Mean (original grids) [Pg] |
Model Period Mean (intersection) [Pg] |
Model Period Mean (complement) [Pg] |
Benchmark Period Mean (intersection) [Pg] |
Benchmark Period Mean (complement) [Pg] |
Bias [kg m-2] |
Bias Score [1] |
Spatial Distribution Score [1] |
Overall Score [1] |
|||
|---|---|---|---|---|---|---|---|---|---|---|---|---|
| Benchmark | [-] | 0.222 | ||||||||||
| CESM2_1_001 | [-] | 35.2 | 0.369 | 34.6 | 0.222 | 2.19 | 0.483 | 0.642 | 0.563 | |||
| CESM2_1_002 | [-] | 35.5 | 0.373 | 34.9 | 0.222 | 2.24 | 0.480 | 0.638 | 0.559 | |||
| CESM2_1_003 | [-] | 35.3 | 0.370 | 34.8 | 0.222 | 2.19 | 0.484 | 0.644 | 0.564 | |||
| CRUJRA | [-] | 53.4 | 0.823 | 52.6 | 0.222 | 7.05 | 0.301 | 0.461 | 0.381 | |||
| GSWP3 | [-] | 44.5 | 0.608 | 44.1 | 0.222 | 4.70 | 0.409 | 0.634 | 0.521 | |||
| LENS1 | [-] | 13.4 | 0.454 | 13.1 | 0.222 | 2.66 | 0.472 | 0.653 | 0.563 | |||
| LENS10 | [-] | 13.4 | 0.448 | 13.1 | 0.222 | 2.60 | 0.473 | 0.657 | 0.565 | |||
| LENS5 | [-] | 13.5 | 0.460 | 13.2 | 0.222 | 2.72 | 0.469 | 0.643 | 0.556 | |||
| PRINCETON | [-] | 67.0 | 0.926 | 66.1 | 0.222 | 8.24 | 0.263 | 0.379 | 0.321 |
Download Data |
Period Mean (original grids) [Pg] |
Model Period Mean (intersection) [Pg] |
Model Period Mean (complement) [Pg] |
Benchmark Period Mean (intersection) [Pg] |
Benchmark Period Mean (complement) [Pg] |
Bias [kg m-2] |
Bias Score [1] |
Spatial Distribution Score [1] |
Overall Score [1] |
|||
|---|---|---|---|---|---|---|---|---|---|---|---|---|
| Benchmark | [-] | 8.47 | ||||||||||
| CESM2_1_001 | [-] | 1.65 | 1.64 | 0.0355 | 8.42 | 0.0520 | -1.60 | 0.441 | 0.294 | 0.368 | ||
| CESM2_1_002 | [-] | 1.66 | 1.64 | 0.0353 | 8.42 | 0.0520 | -1.60 | 0.442 | 0.293 | 0.367 | ||
| CESM2_1_003 | [-] | 1.68 | 1.67 | 0.0351 | 8.42 | 0.0520 | -1.59 | 0.443 | 0.293 | 0.368 | ||
| CRUJRA | [-] | 3.44 | 3.42 | 0.0606 | 8.42 | 0.0520 | -1.12 | 0.505 | 0.667 | 0.586 | ||
| GSWP3 | [-] | 3.12 | 3.12 | 0.0350 | 8.42 | 0.0520 | -1.21 | 0.502 | 0.547 | 0.525 | ||
| LENS1 | [-] | 4.01 | 4.03 | 0.0544 | 8.42 | 0.0520 | -1.05 | 0.502 | 0.180 | 0.341 | ||
| LENS10 | [-] | 3.93 | 3.95 | 0.0497 | 8.42 | 0.0520 | -1.07 | 0.500 | 0.183 | 0.342 | ||
| LENS5 | [-] | 3.93 | 3.94 | 0.0506 | 8.42 | 0.0520 | -1.07 | 0.499 | 0.175 | 0.337 | ||
| PRINCETON | [-] | 6.93 | 6.90 | 0.0567 | 8.42 | 0.0520 | -0.244 | 0.588 | 0.865 | 0.727 |
Temporally integrated period mean