Mean State
Download Data |
Period Mean (original grids) [Pg] |
Model Period Mean (intersection) [Pg] |
Model Period Mean (complement) [Pg] |
Benchmark Period Mean (intersection) [Pg] |
Benchmark Period Mean (complement) [Pg] |
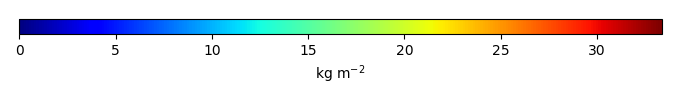
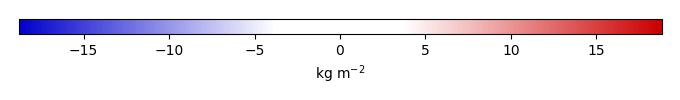
Bias [kg m-2] |
Bias Score [1] |
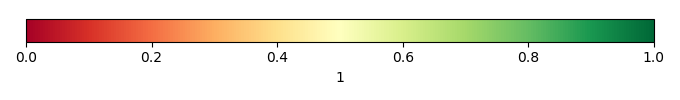
Spatial Distribution Score [1] |
Overall Score [1] |
|||
|---|---|---|---|---|---|---|---|---|---|---|---|---|
| Benchmark | [-] | 30.1 | ||||||||||
| CESM2_1_001 | [-] | 487. | 16.4 | 470. | 29.9 | 0.195 | -1.17 | 0.538 | 0.679 | 0.609 | ||
| CESM2_1_002 | [-] | 487. | 16.5 | 471. | 29.9 | 0.195 | -1.16 | 0.538 | 0.683 | 0.610 | ||
| CESM2_1_003 | [-] | 487. | 16.5 | 470. | 29.9 | 0.195 | -1.16 | 0.537 | 0.680 | 0.608 | ||
| CRUJRA | [-] | 626. | 29.3 | 597. | 29.9 | 0.195 | 0.327 | 0.605 | 0.837 | 0.721 | ||
| GSWP3 | [-] | 491. | 22.4 | 468. | 29.9 | 0.195 | -0.472 | 0.574 | 0.772 | 0.673 | ||
| LENS1 | [-] | 552. | 23.1 | 529. | 29.9 | 0.195 | -0.503 | 0.617 | 0.732 | 0.675 | ||
| LENS10 | [-] | 552. | 22.9 | 529. | 29.9 | 0.195 | -0.532 | 0.616 | 0.733 | 0.674 | ||
| LENS5 | [-] | 554. | 22.9 | 531. | 29.9 | 0.195 | -0.528 | 0.616 | 0.734 | 0.675 | ||
| PRINCETON | [-] | 714. | 35.9 | 678. | 29.9 | 0.195 | 1.05 | 0.624 | 0.845 | 0.735 |
Download Data |
Period Mean (original grids) [Pg] |
Model Period Mean (intersection) [Pg] |
Model Period Mean (complement) [Pg] |
Benchmark Period Mean (intersection) [Pg] |
Benchmark Period Mean (complement) [Pg] |
Bias [kg m-2] |
Bias Score [1] |
Spatial Distribution Score [1] |
Overall Score [1] |
|||
|---|---|---|---|---|---|---|---|---|---|---|---|---|
| Benchmark | [-] | 1.44 | ||||||||||
| CESM2_1_001 | [-] | 10.0 | 4.41 | 5.87 | 1.41 | 0.0279 | 2.74 | 0.350 | 0.574 | 0.462 | ||
| CESM2_1_002 | [-] | 10.3 | 4.51 | 6.01 | 1.41 | 0.0279 | 2.82 | 0.339 | 0.566 | 0.453 | ||
| CESM2_1_003 | [-] | 10.2 | 4.52 | 5.90 | 1.41 | 0.0279 | 2.83 | 0.339 | 0.572 | 0.456 | ||
| CRUJRA | [-] | 16.4 | 6.21 | 10.1 | 1.41 | 0.0279 | 4.48 | 0.202 | 0.428 | 0.315 | ||
| GSWP3 | [-] | 14.9 | 6.04 | 8.72 | 1.41 | 0.0279 | 4.24 | 0.200 | 0.465 | 0.333 | ||
| LENS1 | [-] | 3.40 | 0.533 | 2.80 | 1.41 | 0.0279 | -0.632 | 0.463 | 0.405 | 0.434 | ||
| LENS10 | [-] | 3.37 | 0.527 | 2.78 | 1.41 | 0.0279 | -0.638 | 0.462 | 0.398 | 0.430 | ||
| LENS5 | [-] | 3.38 | 0.534 | 2.78 | 1.41 | 0.0279 | -0.631 | 0.463 | 0.407 | 0.435 | ||
| PRINCETON | [-] | 22.3 | 7.89 | 14.4 | 1.41 | 0.0279 | 5.90 | 0.131 | 0.239 | 0.185 |
Download Data |
Period Mean (original grids) [Pg] |
Model Period Mean (intersection) [Pg] |
Model Period Mean (complement) [Pg] |
Benchmark Period Mean (intersection) [Pg] |
Benchmark Period Mean (complement) [Pg] |
Bias [kg m-2] |
Bias Score [1] |
Spatial Distribution Score [1] |
Overall Score [1] |
|||
|---|---|---|---|---|---|---|---|---|---|---|---|---|
| Benchmark | [-] | 0.00649 | ||||||||||
| CESM2_1_001 | [-] | 9.84 | 0.0204 | 9.59 | 0.00649 | 0.164 | 0.488 | 0.577 | 0.532 | |||
| CESM2_1_002 | [-] | 9.95 | 0.0185 | 9.70 | 0.00649 | 0.146 | 0.482 | 0.562 | 0.522 | |||
| CESM2_1_003 | [-] | 10.0 | 0.0192 | 9.76 | 0.00649 | 0.155 | 0.487 | 0.576 | 0.531 | |||
| CRUJRA | [-] | 12.4 | 0.0314 | 12.1 | 0.00649 | 0.346 | 0.598 | 0.779 | 0.688 | |||
| GSWP3 | [-] | 10.2 | 0.0247 | 9.96 | 0.00649 | 0.231 | 0.589 | 0.761 | 0.675 | |||
| LENS1 | [-] | 13.9 | 0.0271 | 13.7 | 0.00649 | 0.218 | 0.416 | 0.273 | 0.344 | |||
| LENS10 | [-] | 13.7 | 0.0247 | 13.4 | 0.00649 | 0.183 | 0.401 | 0.236 | 0.318 | |||
| LENS5 | [-] | 13.7 | 0.0237 | 13.4 | 0.00649 | 0.174 | 0.402 | 0.216 | 0.309 | |||
| PRINCETON | [-] | 13.7 | 0.0259 | 13.4 | 0.00649 | 0.253 | 0.586 | 0.761 | 0.673 |
Download Data |
Period Mean (original grids) [Pg] |
Model Period Mean (intersection) [Pg] |
Model Period Mean (complement) [Pg] |
Benchmark Period Mean (intersection) [Pg] |
Benchmark Period Mean (complement) [Pg] |
Bias [kg m-2] |
Bias Score [1] |
Spatial Distribution Score [1] |
Overall Score [1] |
|||
|---|---|---|---|---|---|---|---|---|---|---|---|---|
| Benchmark | [-] | 17.4 | ||||||||||
| CESM2_1_001 | [-] | 9.53 | 9.25 | 0.198 | 17.3 | 0.0180 | -1.66 | 0.605 | 0.845 | 0.725 | ||
| CESM2_1_002 | [-] | 9.58 | 9.29 | 0.199 | 17.3 | 0.0180 | -1.65 | 0.606 | 0.849 | 0.728 | ||
| CESM2_1_003 | [-] | 9.50 | 9.22 | 0.197 | 17.3 | 0.0180 | -1.67 | 0.604 | 0.845 | 0.725 | ||
| CRUJRA | [-] | 18.0 | 17.6 | 0.300 | 17.3 | 0.0180 | 0.471 | 0.703 | 0.930 | 0.816 | ||
| GSWP3 | [-] | 11.9 | 11.6 | 0.244 | 17.3 | 0.0180 | -1.07 | 0.648 | 0.854 | 0.751 | ||
| LENS1 | [-] | 18.8 | 18.2 | 0.339 | 17.3 | 0.0180 | 0.627 | 0.726 | 0.931 | 0.828 | ||
| LENS10 | [-] | 18.6 | 18.0 | 0.335 | 17.3 | 0.0180 | 0.585 | 0.723 | 0.932 | 0.827 | ||
| LENS5 | [-] | 18.6 | 18.1 | 0.340 | 17.3 | 0.0180 | 0.591 | 0.724 | 0.933 | 0.829 | ||
| PRINCETON | [-] | 19.2 | 18.7 | 0.319 | 17.3 | 0.0180 | 0.762 | 0.695 | 0.925 | 0.810 |
Download Data |
Period Mean (original grids) [Pg] |
Model Period Mean (intersection) [Pg] |
Model Period Mean (complement) [Pg] |
Benchmark Period Mean (intersection) [Pg] |
Benchmark Period Mean (complement) [Pg] |
Bias [kg m-2] |
Bias Score [1] |
Spatial Distribution Score [1] |
Overall Score [1] |
|||
|---|---|---|---|---|---|---|---|---|---|---|---|---|
| Benchmark | [-] | 1.52 | ||||||||||
| CESM2_1_001 | [-] | 35.2 | 1.15 | 33.8 | 1.46 | 0.0621 | 0.725 | 0.636 | 0.826 | 0.731 | ||
| CESM2_1_002 | [-] | 35.5 | 1.15 | 34.1 | 1.46 | 0.0621 | 0.700 | 0.633 | 0.823 | 0.728 | ||
| CESM2_1_003 | [-] | 35.3 | 1.15 | 34.0 | 1.46 | 0.0621 | 0.696 | 0.636 | 0.825 | 0.730 | ||
| CRUJRA | [-] | 53.4 | 2.12 | 51.3 | 1.46 | 0.0621 | 5.19 | 0.612 | 0.905 | 0.759 | ||
| GSWP3 | [-] | 44.5 | 1.76 | 42.9 | 1.46 | 0.0621 | 3.57 | 0.645 | 0.899 | 0.772 | ||
| LENS1 | [-] | 13.4 | 0.499 | 13.1 | 1.46 | 0.0621 | -3.65 | 0.394 | 0.377 | 0.386 | ||
| LENS10 | [-] | 13.4 | 0.493 | 13.1 | 1.46 | 0.0621 | -3.67 | 0.394 | 0.373 | 0.384 | ||
| LENS5 | [-] | 13.5 | 0.505 | 13.2 | 1.46 | 0.0621 | -3.62 | 0.394 | 0.383 | 0.388 | ||
| PRINCETON | [-] | 67.0 | 2.48 | 64.6 | 1.46 | 0.0621 | 6.90 | 0.586 | 0.902 | 0.744 |
Download Data |
Period Mean (original grids) [Pg] |
Model Period Mean (intersection) [Pg] |
Model Period Mean (complement) [Pg] |
Benchmark Period Mean (intersection) [Pg] |
Benchmark Period Mean (complement) [Pg] |
Bias [kg m-2] |
Bias Score [1] |
Spatial Distribution Score [1] |
Overall Score [1] |
|||
|---|---|---|---|---|---|---|---|---|---|---|---|---|
| Benchmark | [-] | 9.78 | ||||||||||
| CESM2_1_001 | [-] | 1.65 | 1.56 | 0.118 | 9.71 | 0.0683 | -2.12 | 0.429 | 0.208 | 0.318 | ||
| CESM2_1_002 | [-] | 1.66 | 1.56 | 0.114 | 9.71 | 0.0683 | -2.12 | 0.430 | 0.207 | 0.318 | ||
| CESM2_1_003 | [-] | 1.68 | 1.59 | 0.118 | 9.71 | 0.0683 | -2.11 | 0.430 | 0.207 | 0.318 | ||
| CRUJRA | [-] | 3.44 | 3.31 | 0.178 | 9.71 | 0.0683 | -1.61 | 0.488 | 0.532 | 0.510 | ||
| GSWP3 | [-] | 3.12 | 3.01 | 0.149 | 9.71 | 0.0683 | -1.71 | 0.483 | 0.415 | 0.449 | ||
| LENS1 | [-] | 4.01 | 3.83 | 0.248 | 9.71 | 0.0683 | -1.55 | 0.478 | 0.117 | 0.297 | ||
| LENS10 | [-] | 3.93 | 3.76 | 0.238 | 9.71 | 0.0683 | -1.57 | 0.477 | 0.119 | 0.298 | ||
| LENS5 | [-] | 3.93 | 3.76 | 0.235 | 9.71 | 0.0683 | -1.57 | 0.476 | 0.113 | 0.295 | ||
| PRINCETON | [-] | 6.93 | 6.74 | 0.219 | 9.71 | 0.0683 | -0.669 | 0.574 | 0.785 | 0.679 |
Temporally integrated period mean