Mean State
Download Data |
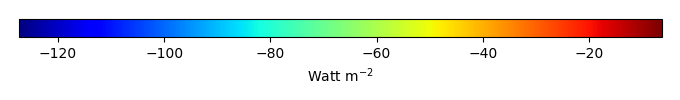
Period Mean (original grids) [Watt m-2] |
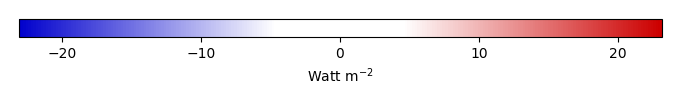
Bias [Watt m-2] |
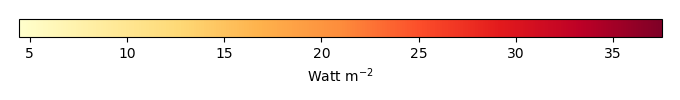
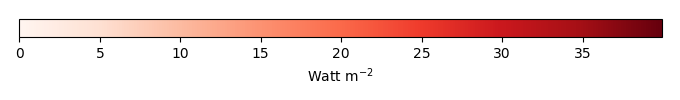
RMSE [Watt m-2] |
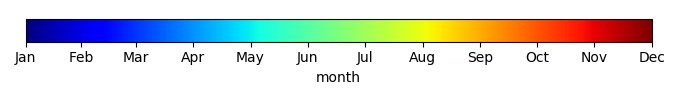
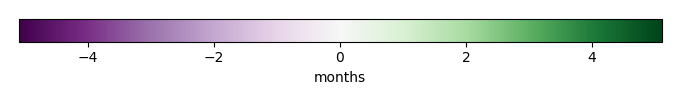
Phase Shift [months] |
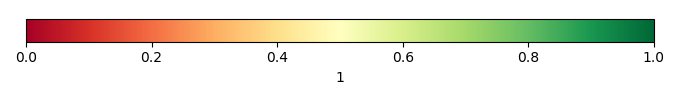
Bias Score [1] |
RMSE Score [1] |
Seasonal Cycle Score [1] |
Interannual Variability Score [1] |
Overall Score [1] |
|||
|---|---|---|---|---|---|---|---|---|---|---|---|---|
| Benchmark | [-] | -49.2 | ||||||||||
| CESM2_1_001 | [-] | -56.1 | 0.978 | 22.1 | 0.517 | 0.160 | 0.456 | 0.965 | 0.799 | 0.567 | ||
| CESM2_1_002 | [-] | -56.2 | 0.719 | 21.9 | 0.517 | 0.162 | 0.444 | 0.965 | 0.775 | 0.558 | ||
| CESM2_1_003 | [-] | -56.2 | 0.979 | 21.5 | 0.517 | 0.160 | 0.473 | 0.965 | 0.776 | 0.569 | ||
| CRUJRA | [-] | -62.1 | -5.02 | 18.7 | 1.03 | 0.169 | 0.549 | 0.930 | 0.735 | 0.586 | ||
| GSWP3 | [-] | -57.8 | -4.05 | 23.4 | 0.00 | 0.152 | 0.428 | 1.00 | 0.578 | 0.517 | ||
| LENS1 | [-] | -49.9 | 22.7 | 37.0 | 0.00 | 0.0552 | 0.349 | 1.00 | 0.609 | 0.472 | ||
| LENS10 | [-] | -49.4 | 23.1 | 37.1 | 1.03 | 0.0546 | 0.355 | 0.930 | 0.609 | 0.461 | ||
| LENS5 | [-] | -49.8 | 23.4 | 37.7 | 0.00 | 0.0539 | 0.345 | 1.00 | 0.606 | 0.470 | ||
| PRINCETON | [-] | -59.8 | -4.66 | 19.8 | 0.517 | 0.165 | 0.489 | 0.965 | 0.605 | 0.543 |
Download Data |
Period Mean (original grids) [Watt m-2] |
Bias [Watt m-2] |
RMSE [Watt m-2] |
Phase Shift [months] |
Bias Score [1] |
RMSE Score [1] |
Seasonal Cycle Score [1] |
Interannual Variability Score [1] |
Overall Score [1] |
|||
|---|---|---|---|---|---|---|---|---|---|---|---|---|
| Benchmark | [-] | -64.6 | ||||||||||
| CESM2_1_001 | [-] | -65.8 | -6.41 | 21.5 | 1.28 | 0.148 | 0.373 | 0.784 | 0.853 | 0.506 | ||
| CESM2_1_002 | [-] | -65.7 | -6.05 | 19.7 | 1.41 | 0.152 | 0.369 | 0.776 | 0.831 | 0.499 | ||
| CESM2_1_003 | [-] | -66.1 | -6.41 | 19.8 | 1.48 | 0.148 | 0.380 | 0.770 | 0.841 | 0.504 | ||
| CRUJRA | [-] | -67.8 | -9.24 | 14.4 | 0.748 | 0.156 | 0.552 | 0.910 | 0.848 | 0.604 | ||
| GSWP3 | [-] | -67.2 | -5.01 | 13.7 | 0.948 | 0.193 | 0.476 | 0.866 | 0.796 | 0.561 | ||
| LENS1 | [-] | -58.1 | 3.59 | 18.1 | 2.80 | 0.210 | 0.322 | 0.538 | 0.817 | 0.442 | ||
| LENS10 | [-] | -58.2 | 3.49 | 18.1 | 2.74 | 0.202 | 0.321 | 0.533 | 0.812 | 0.438 | ||
| LENS5 | [-] | -58.1 | 2.90 | 17.3 | 2.67 | 0.204 | 0.325 | 0.551 | 0.837 | 0.448 | ||
| PRINCETON | [-] | -66.3 | -4.51 | 12.9 | 1.15 | 0.200 | 0.516 | 0.812 | 0.733 | 0.555 |
Download Data |
Period Mean (original grids) [Watt m-2] |
Bias [Watt m-2] |
RMSE [Watt m-2] |
Phase Shift [months] |
Bias Score [1] |
RMSE Score [1] |
Seasonal Cycle Score [1] |
Interannual Variability Score [1] |
Overall Score [1] |
|||
|---|---|---|---|---|---|---|---|---|---|---|---|---|
| Benchmark | [-] | -109. | ||||||||||
| CESM2_1_001 | [-] | -119. | -9.46 | 15.8 | 0.00 | 0.207 | 0.523 | 1.00 | 0.959 | 0.642 | ||
| CESM2_1_002 | [-] | -118. | -9.08 | 16.1 | 0.00 | 0.211 | 0.495 | 1.00 | 0.969 | 0.634 | ||
| CESM2_1_003 | [-] | -120. | -10.7 | 18.6 | 0.00 | 0.195 | 0.503 | 1.00 | 0.959 | 0.632 | ||
| CRUJRA | [-] | -115. | -7.81 | 12.0 | 0.00 | 0.225 | 0.661 | 1.00 | 0.897 | 0.689 | ||
| GSWP3 | [-] | -112. | -4.76 | 12.8 | 1.03 | 0.262 | 0.587 | 0.930 | 0.784 | 0.630 | ||
| LENS1 | [-] | -110. | 3.03 | 20.9 | 0.00 | 0.286 | 0.359 | 1.00 | 0.688 | 0.538 | ||
| LENS10 | [-] | -111. | 3.85 | 19.6 | 4.02 | 0.275 | 0.377 | 0.259 | 0.664 | 0.390 | ||
| LENS5 | [-] | -110. | 2.37 | 20.9 | 1.02 | 0.296 | 0.347 | 0.933 | 0.680 | 0.520 | ||
| PRINCETON | [-] | -119. | -12.0 | 17.1 | 0.00 | 0.182 | 0.651 | 1.00 | 0.845 | 0.666 |
Download Data |
Period Mean (original grids) [Watt m-2] |
Bias [Watt m-2] |
RMSE [Watt m-2] |
Phase Shift [months] |
Bias Score [1] |
RMSE Score [1] |
Seasonal Cycle Score [1] |
Interannual Variability Score [1] |
Overall Score [1] |
|||
|---|---|---|---|---|---|---|---|---|---|---|---|---|
| Benchmark | [-] | -31.3 | ||||||||||
| CESM2_1_001 | [-] | -25.2 | 6.90 | 15.0 | 4.08 | 0.505 | 0.266 | 0.244 | 0.748 | 0.406 | ||
| CESM2_1_002 | [-] | -24.8 | 7.43 | 14.9 | 4.08 | 0.479 | 0.279 | 0.244 | 0.720 | 0.400 | ||
| CESM2_1_003 | [-] | -25.2 | 6.86 | 14.7 | 4.08 | 0.507 | 0.276 | 0.244 | 0.745 | 0.410 | ||
| CRUJRA | [-] | -48.5 | -16.8 | 19.1 | 0.00 | 0.0949 | 0.417 | 1.00 | 0.848 | 0.556 | ||
| GSWP3 | [-] | -37.7 | -5.26 | 19.4 | 4.05 | 0.297 | 0.156 | 0.251 | 0.440 | 0.260 | ||
| LENS1 | [-] | -33.0 | -1.03 | 11.0 | 3.07 | 0.899 | 0.324 | 0.494 | 0.911 | 0.590 | ||
| LENS10 | [-] | -33.2 | -1.23 | 10.9 | 3.07 | 0.881 | 0.330 | 0.494 | 0.874 | 0.582 | ||
| LENS5 | [-] | -33.5 | -2.41 | 11.3 | 4.05 | 0.781 | 0.324 | 0.251 | 0.913 | 0.519 | ||
| PRINCETON | [-] | -31.5 | -3.89 | 19.4 | 4.05 | 0.680 | 0.154 | 0.251 | 0.421 | 0.332 |
Download Data |
Period Mean (original grids) [Watt m-2] |
Bias [Watt m-2] |
RMSE [Watt m-2] |
Phase Shift [months] |
Bias Score [1] |
RMSE Score [1] |
Seasonal Cycle Score [1] |
Interannual Variability Score [1] |
Overall Score [1] |
|||
|---|---|---|---|---|---|---|---|---|---|---|---|---|
| Benchmark | [-] | -54.8 | ||||||||||
| CESM2_1_001 | [-] | -72.0 | -17.2 | 22.4 | 2.01 | 0.166 | 0.283 | 0.629 | 0.824 | 0.437 | ||
| CESM2_1_002 | [-] | -71.4 | -16.7 | 22.1 | 2.41 | 0.176 | 0.273 | 0.603 | 0.793 | 0.424 | ||
| CESM2_1_003 | [-] | -72.3 | -17.5 | 22.6 | 2.21 | 0.161 | 0.283 | 0.615 | 0.824 | 0.433 | ||
| CRUJRA | [-] | -67.7 | -11.5 | 14.6 | 0.413 | 0.269 | 0.481 | 0.972 | 0.874 | 0.615 | ||
| GSWP3 | [-] | -64.0 | -7.58 | 12.3 | 0.413 | 0.359 | 0.452 | 0.972 | 0.856 | 0.618 | ||
| LENS1 | [-] | -56.3 | -0.868 | 15.1 | 3.21 | 0.569 | 0.265 | 0.455 | 0.856 | 0.482 | ||
| LENS10 | [-] | -57.1 | -1.58 | 15.9 | 3.24 | 0.565 | 0.247 | 0.451 | 0.872 | 0.476 | ||
| LENS5 | [-] | -57.5 | -2.04 | 14.7 | 3.03 | 0.577 | 0.269 | 0.466 | 0.913 | 0.499 | ||
| PRINCETON | [-] | -65.2 | -8.66 | 12.3 | 0.413 | 0.337 | 0.487 | 0.972 | 0.829 | 0.623 |
Download Data |
Period Mean (original grids) [Watt m-2] |
Bias [Watt m-2] |
RMSE [Watt m-2] |
Phase Shift [months] |
Bias Score [1] |
RMSE Score [1] |
Seasonal Cycle Score [1] |
Interannual Variability Score [1] |
Overall Score [1] |
|||
|---|---|---|---|---|---|---|---|---|---|---|---|---|
| Benchmark | [-] | -88.8 | ||||||||||
| CESM2_1_001 | [-] | -95.6 | -6.79 | 16.2 | 0.258 | 0.664 | 0.435 | 0.983 | 0.917 | 0.687 | ||
| CESM2_1_002 | [-] | -95.0 | -6.20 | 15.9 | 0.258 | 0.689 | 0.441 | 0.983 | 0.899 | 0.691 | ||
| CESM2_1_003 | [-] | -95.1 | -6.32 | 15.4 | 0.775 | 0.684 | 0.450 | 0.948 | 0.889 | 0.684 | ||
| CRUJRA | [-] | -96.6 | -7.78 | 12.6 | 0.258 | 0.574 | 0.649 | 0.983 | 0.859 | 0.743 | ||
| GSWP3 | [-] | -88.9 | -0.0862 | 9.75 | 0.258 | 0.801 | 0.581 | 0.983 | 0.921 | 0.774 | ||
| LENS1 | [-] | -80.6 | 7.67 | 18.4 | 3.26 | 0.608 | 0.377 | 0.459 | 0.831 | 0.530 | ||
| LENS10 | [-] | -80.3 | 7.95 | 18.1 | 2.00 | 0.600 | 0.390 | 0.631 | 0.810 | 0.564 | ||
| LENS5 | [-] | -80.9 | 7.32 | 17.9 | 3.02 | 0.604 | 0.385 | 0.500 | 0.822 | 0.539 | ||
| PRINCETON | [-] | -92.7 | -3.93 | 9.54 | 0.00 | 0.721 | 0.622 | 1.00 | 0.910 | 0.775 |
Temporally integrated period mean