
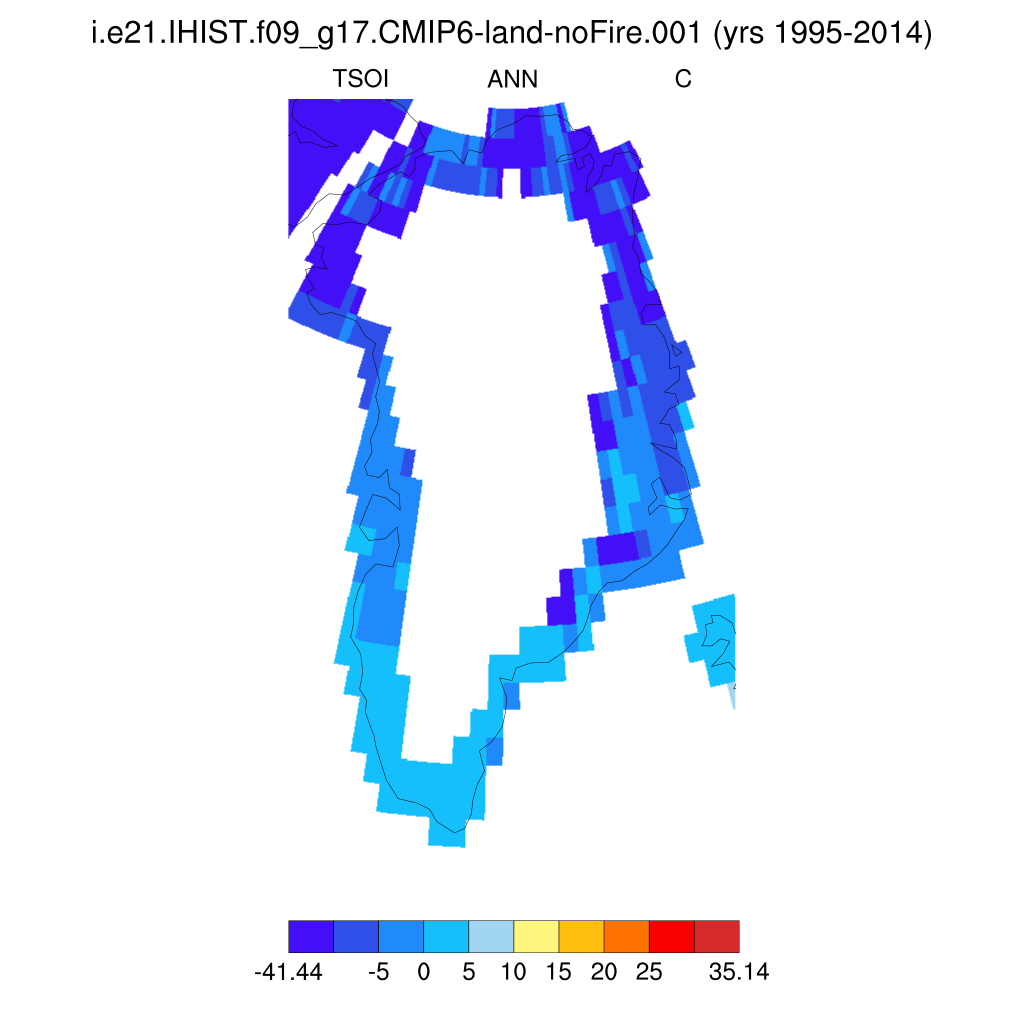
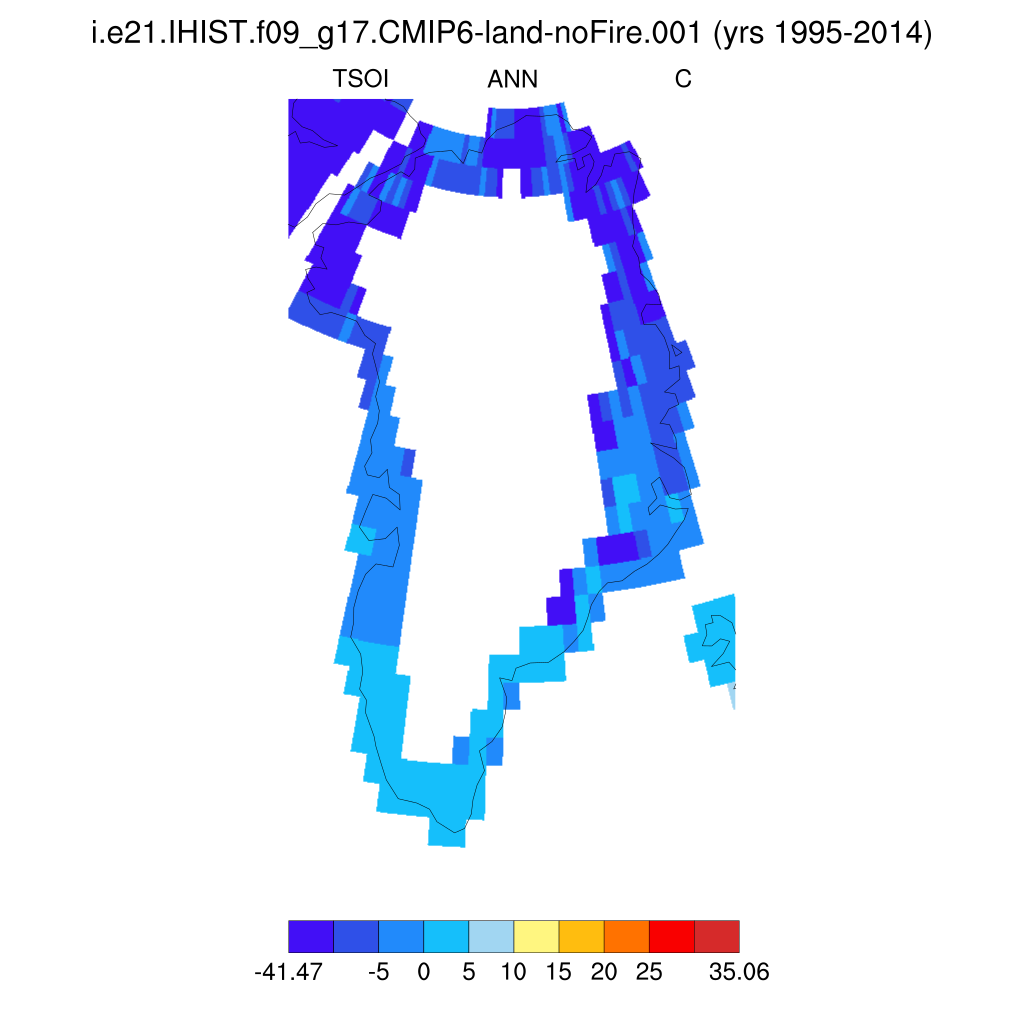
i.e21.IHIST.f09_g17.CMIP6-land-noFire.001
and
Obs
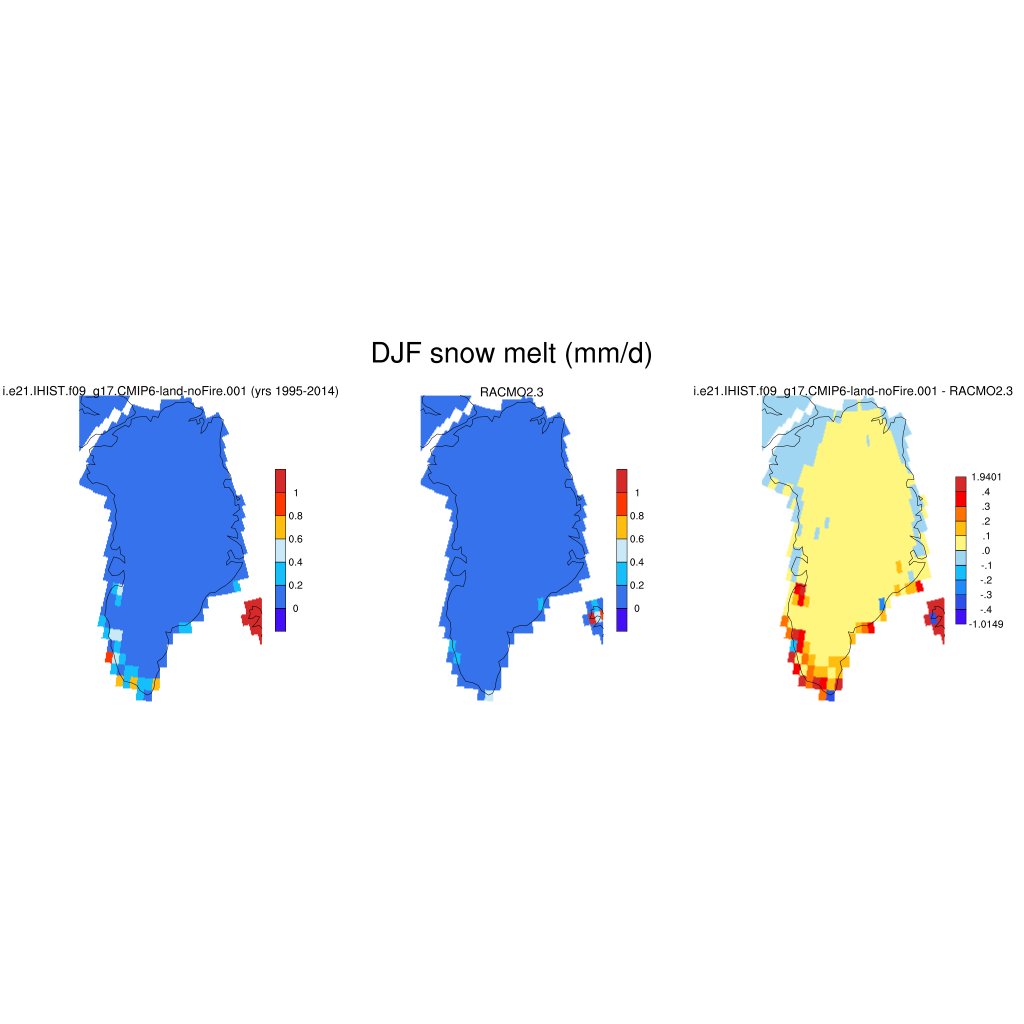
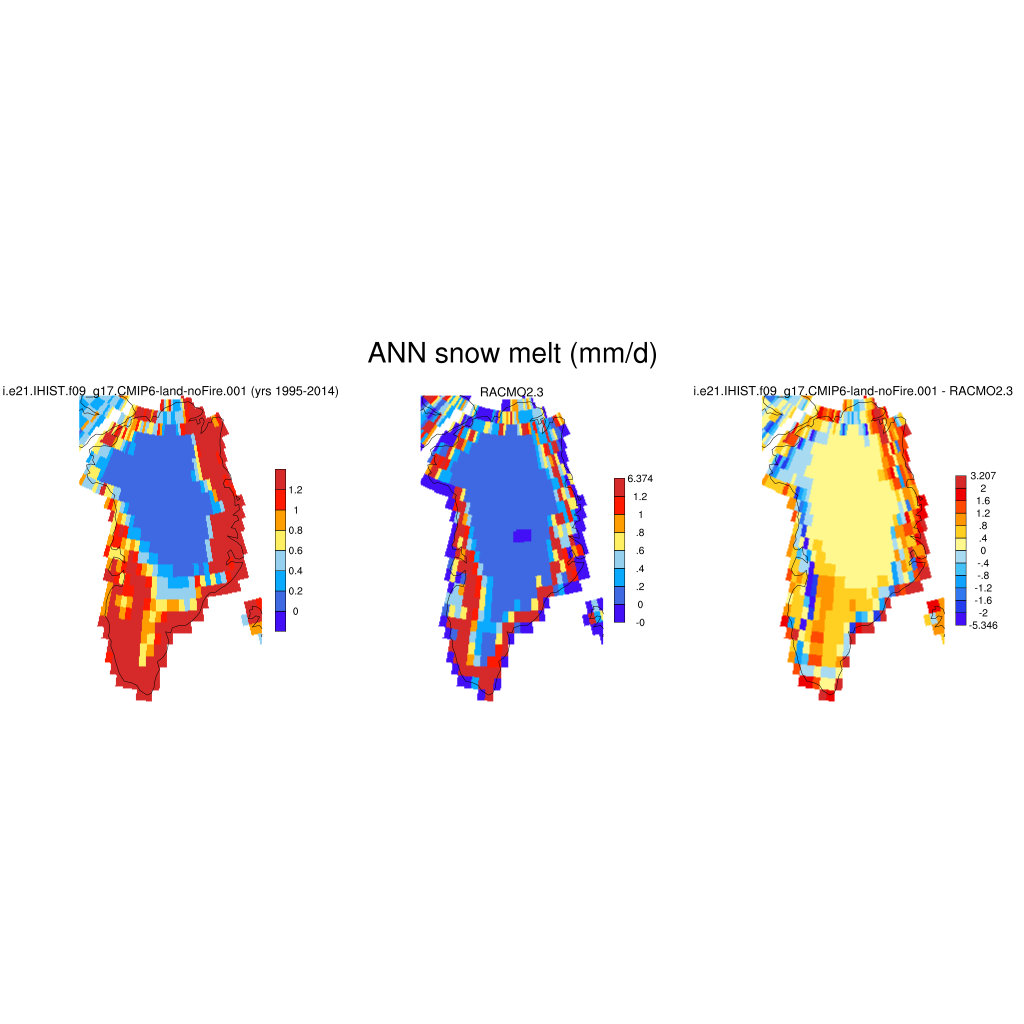
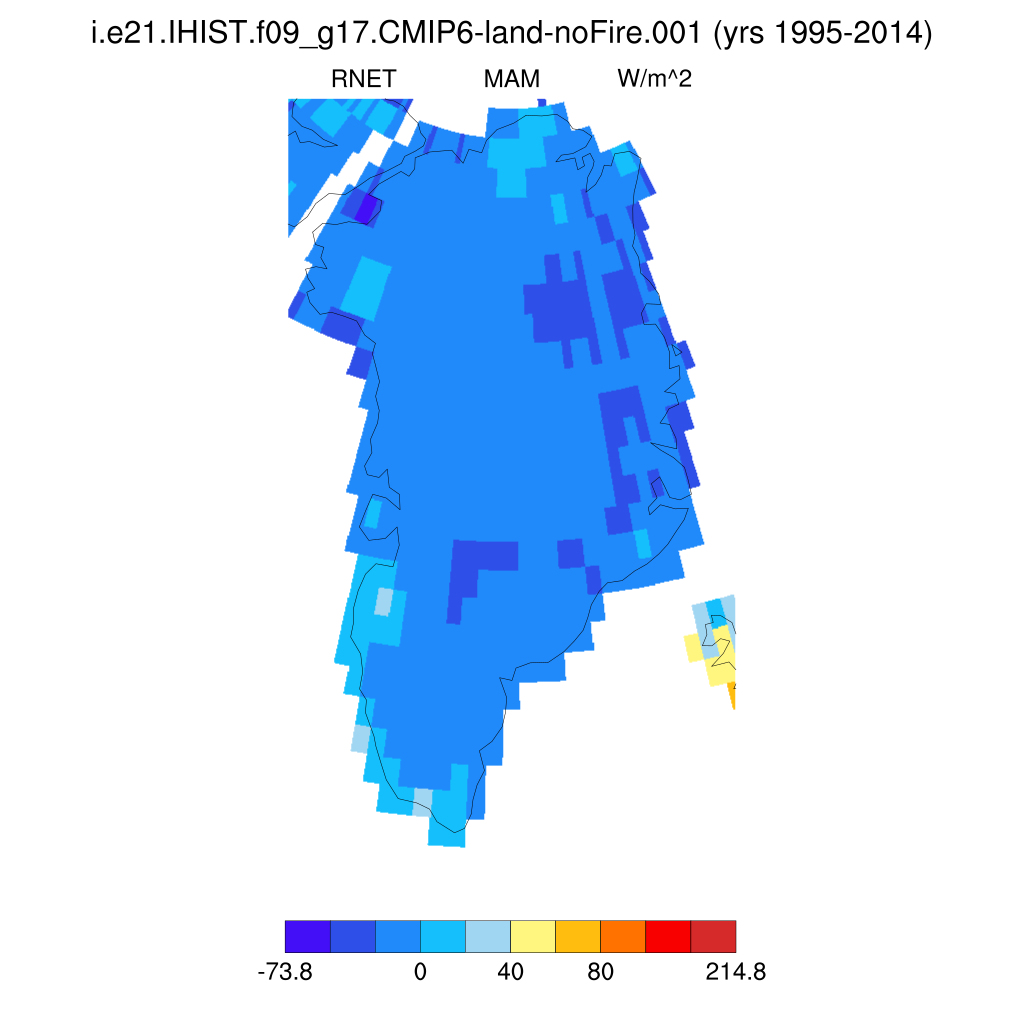
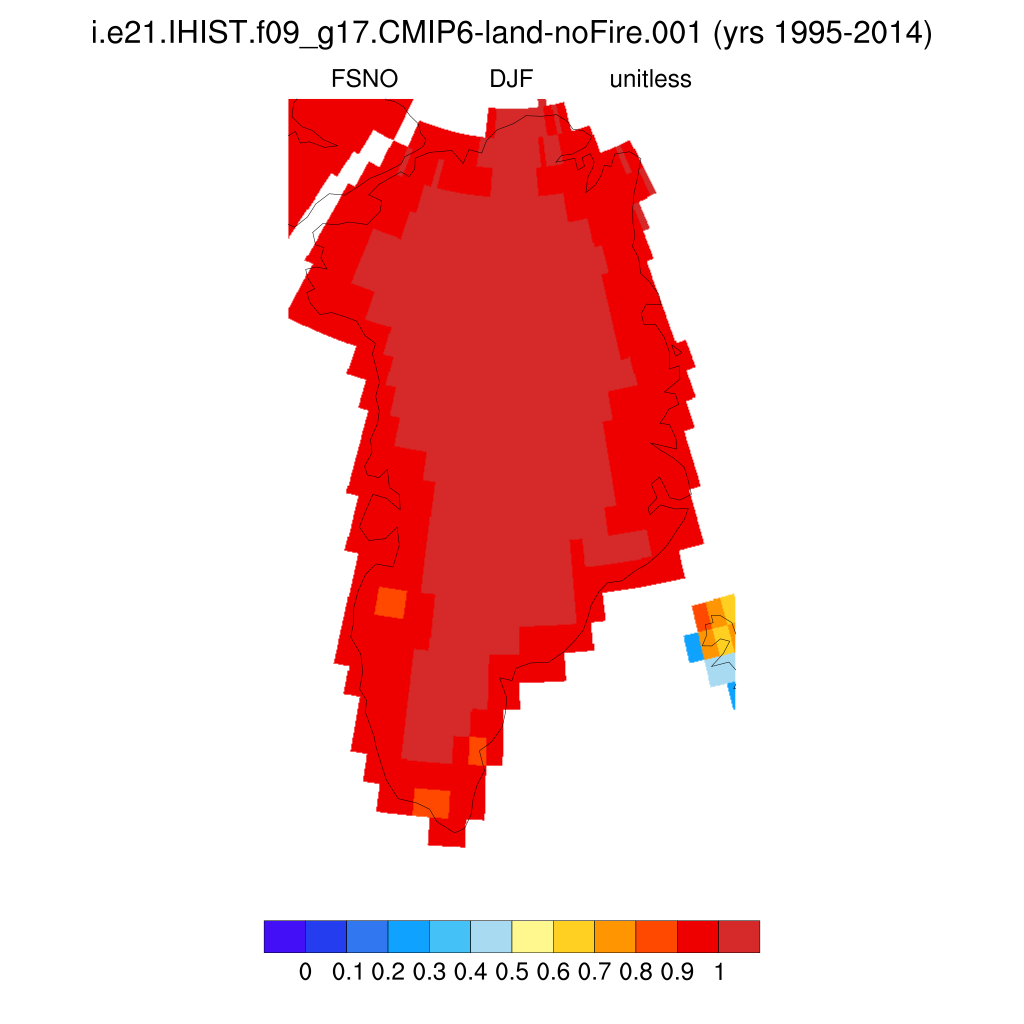
Set 10 Description: Horizontal contour plots of DJF, MAM, JJA, SON, and ANN means, zoomed in on the Greenland ice sheet
Lookup Table: Set 10 Variable Definition
| RACMO2.3: near-sfc atm & precip | DJF | MAM | JJA | SON | ANN | |
|---|---|---|---|---|---|---|
| TSA | 2m air temperature | plot | plot | plot | plot | plot |
| Q2M | 2m specific humidity | plot | plot | plot | plot | plot |
| RH2M | 2m relative humidity | plot | plot | plot | plot | plot |
| U10 | 10-m wind | plot | plot | plot | plot | plot |
| SNOW | atmospheric snow | plot | plot | plot | plot | plot |
| RAIN | atmospheric rain | plot | plot | plot | plot | plot |
| PBOT | atm pressure of bottom layer | plot | plot | plot | plot | plot |
| RACMO2.3: Fluxes | ||||||
| FSH | sensible heat | plot | plot | plot | plot | plot |
| QSOIL | ground evaporation | plot | plot | plot | plot | plot |
| FGR | heat flux into snow/soil (includes snow melt) | plot | plot | plot | plot | plot |
| FLDS | atmospheric longwave radiation | plot | plot | plot | plot | plot |
| FIRE | emitted infrared (longwave) radiation | plot | plot | plot | plot | plot |
| FSDS | atmospheric incident solar radiation | plot | plot | plot | plot | plot |
| FSR | reflected solar radiation | plot | plot | plot | plot | plot |
| ASA | all-sky albedo:FSR/FSDS | plot | plot | plot | plot | plot |
| RACMO2.3: SMB and components | ||||||
| QICE_FRZ | 0 | --- | --- | --- | --- | --- |
| QICE_MELT | 0 | --- | --- | --- | --- | --- |
| QSNOMELT | snow melt | plot | plot | plot | plot | plot |
| QICE | 0 | --- | --- | --- | --- | --- |
| Model Only | DJF | MAM | JJA | SON | ANN | |
| TSA | 2m air temperature | plot | plot | plot | plot | plot |
| PREC | ppt: rain+snow | plot | plot | plot | plot | plot |
| ASA | all-sky albedo:FSR/FSDS | plot | plot | plot | plot | plot |
| RNET | net radiation:fsa-fira | plot | plot | plot | plot | plot |
| LHEAT | latent heat:FCTR+FCEV+FGEV | plot | plot | plot | plot | plot |
| SNOWDP | snow height | --- | --- | --- | --- | --- |
| FSH | sensible heat | plot | plot | plot | plot | plot |
| TV | vegetation temperature | plot | plot | plot | plot | plot |
| TG | ground temperature | plot | plot | plot | plot | plot |
| FSA | absorbed solar radiation | plot | plot | plot | plot | plot |
| FSR | reflected solar radiation | plot | plot | plot | plot | plot |
| FIRA | net infrared (longwave) radiation | plot | plot | plot | plot | plot |
| FIRE | emitted infrared (longwave) radiation | plot | plot | plot | plot | plot |
| FGR | heat flux into snow/soil (includes snow melt) | plot | plot | plot | plot | plot |
| FSM | snow melt heat flux | plot | plot | plot | plot | plot |
| H2OSNO_ICE | total snow water equiv (SNOWICE + SNOWLIQ) over glacier units | --- | --- | --- | --- | --- |
| QSNOMELT_ICE | snow melt over glacier units | plot | plot | plot | plot | plot |
| QSNOMELT | snow melt | plot | plot | plot | plot | plot |
| QSOIL | ground evaporation | plot | plot | plot | plot | plot |
| QSOIL_ICE | ground evaporation over glacier units | plot | plot | plot | plot | plot |
| FSNO | fraction of ground covered by snow | plot | plot | plot | plot | plot |
| RAIN | atmospheric rain | plot | plot | plot | plot | plot |
| SNOW | atmospheric snow | plot | plot | plot | plot | plot |
| RAIN_REPARTITIONED | atmospheric rain after repartitioning | --- | --- | --- | --- | --- |
| SNOW_REPARTITIONED | atmospheric snow after repartitioning | --- | --- | --- | --- | --- |
| WIND | atmospheric wind velocity magnitude | plot | plot | plot | plot | plot |
| FLDS | atmospheric longwave radiation | plot | plot | plot | plot | plot |
| FSDS | atmospheric incident solar radiation | plot | plot | plot | plot | plot |
| Q2M | 2m specific humidity | plot | plot | plot | plot | plot |
| RH2M | 2m relative humidity | plot | plot | plot | plot | plot |
| TSOI (1) | soil temperature | plot | plot | plot | plot | plot |
| TSOI (5) | soil temperature | plot | plot | plot | plot | plot |
| TSOI (10) | soil temperature | plot | plot | plot | plot | plot |
| TWS | total water storage | plot | plot | plot | plot | plot |
| U10 | 10-m wind | plot | plot | plot | plot | plot |
| PBOT | atm pressure of bottom layer | plot | plot | plot | plot | plot |