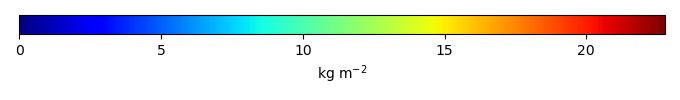
Mean State
Download Data |
Period Mean (original grids) [Pg] |
Model Period Mean (intersection) [Pg] |
Benchmark Period Mean (intersection) [Pg] |
Model Period Mean (complement) [Pg] |
Benchmark Period Mean (complement) [Pg] |
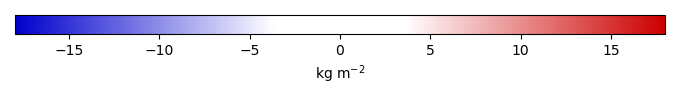
Bias [kg m-2] |
Bias Score [1] |
Spatial Distribution Score [1] |
Overall Score [1] |
|||
|---|---|---|---|---|---|---|---|---|---|---|---|---|
| Benchmark | [-] | 50.2 | ||||||||||
| I123 | [-] | 40.3 | 41.1 | 50.2 | 1.65e-05 | -1.19 | 0.650 | 0.944 | 0.797 | |||
| post5.4 | [-] | 40.1 | 40.9 | 50.2 | 1.65e-05 | -1.24 | 0.649 | 0.942 | 0.795 |
Download Data |
Period Mean (original grids) [Pg] |
Model Period Mean (intersection) [Pg] |
Benchmark Period Mean (intersection) [Pg] |
Model Period Mean (complement) [Pg] |
Benchmark Period Mean (complement) [Pg] |
Bias [kg m-2] |
Bias Score [1] |
Spatial Distribution Score [1] |
Overall Score [1] |
|||
|---|---|---|---|---|---|---|---|---|---|---|---|---|
| Benchmark | [-] | 10.5 | ||||||||||
| I123 | [-] | 4.56 | 3.98 | 10.5 | 0.00136 | -0.936 | 0.624 | 0.392 | 0.508 | |||
| post5.4 | [-] | 4.52 | 3.94 | 10.5 | 0.00136 | -0.944 | 0.620 | 0.388 | 0.504 |
Download Data |
Period Mean (original grids) [Pg] |
Model Period Mean (intersection) [Pg] |
Benchmark Period Mean (intersection) [Pg] |
Model Period Mean (complement) [Pg] |
Benchmark Period Mean (complement) [Pg] |
Bias [kg m-2] |
Bias Score [1] |
Spatial Distribution Score [1] |
Overall Score [1] |
|||
|---|---|---|---|---|---|---|---|---|---|---|---|---|
| Benchmark | [-] | 20.8 | ||||||||||
| I123 | [-] | 14.6 | 14.3 | 20.8 | 0.00143 | -0.358 | 0.538 | 0.835 | 0.686 | |||
| post5.4 | [-] | 14.5 | 14.2 | 20.8 | 0.00143 | -0.365 | 0.544 | 0.837 | 0.691 |
Download Data |
Period Mean (original grids) [Pg] |
Model Period Mean (intersection) [Pg] |
Benchmark Period Mean (intersection) [Pg] |
Model Period Mean (complement) [Pg] |
Benchmark Period Mean (complement) [Pg] |
Bias [kg m-2] |
Bias Score [1] |
Spatial Distribution Score [1] |
Overall Score [1] |
|||
|---|---|---|---|---|---|---|---|---|---|---|---|---|
| Benchmark | [-] | 3.92 | ||||||||||
| I123 | [-] | 2.46 | 2.48 | 3.97 | 0.00 | -0.224 | 0.564 | 0.713 | 0.639 | |||
| post5.4 | [-] | 3.09 | 3.12 | 3.97 | 0.00 | -0.0121 | 0.544 | 0.785 | 0.665 |
Download Data |
Period Mean (original grids) [Pg] |
Model Period Mean (intersection) [Pg] |
Benchmark Period Mean (intersection) [Pg] |
Model Period Mean (complement) [Pg] |
Benchmark Period Mean (complement) [Pg] |
Bias [kg m-2] |
Bias Score [1] |
Spatial Distribution Score [1] |
Overall Score [1] |
|||
|---|---|---|---|---|---|---|---|---|---|---|---|---|
| Benchmark | [-] | 32.7 | ||||||||||
| I123 | [-] | 44.4 | 44.4 | 32.6 | 0.0272 | 9.67 | 0.314 | 0.872 | 0.593 | |||
| post5.4 | [-] | 44.6 | 44.6 | 32.6 | 0.0272 | 9.76 | 0.314 | 0.874 | 0.594 |
Download Data |
Period Mean (original grids) [Pg] |
Model Period Mean (intersection) [Pg] |
Benchmark Period Mean (intersection) [Pg] |
Model Period Mean (complement) [Pg] |
Benchmark Period Mean (complement) [Pg] |
Bias [kg m-2] |
Bias Score [1] |
Spatial Distribution Score [1] |
Overall Score [1] |
|||
|---|---|---|---|---|---|---|---|---|---|---|---|---|
| Benchmark | [-] | 52.3 | ||||||||||
| I123 | [-] | 36.6 | 35.9 | 52.3 | 0.000181 | -1.55 | 0.625 | 0.892 | 0.759 | |||
| post5.4 | [-] | 40.5 | 39.7 | 52.3 | 0.000181 | -1.13 | 0.626 | 0.907 | 0.766 |
Download Data |
Period Mean (original grids) [Pg] |
Model Period Mean (intersection) [Pg] |
Benchmark Period Mean (intersection) [Pg] |
Model Period Mean (complement) [Pg] |
Benchmark Period Mean (complement) [Pg] |
Bias [kg m-2] |
Bias Score [1] |
Spatial Distribution Score [1] |
Overall Score [1] |
|||
|---|---|---|---|---|---|---|---|---|---|---|---|---|
| Benchmark | [-] | 17.4 | ||||||||||
| I123 | [-] | 33.2 | 33.9 | 17.2 | 0.000596 | 1.36 | 0.549 | 0.517 | 0.533 | |||
| post5.4 | [-] | 34.2 | 34.9 | 17.2 | 0.000596 | 1.43 | 0.547 | 0.502 | 0.524 |
Download Data |
Period Mean (original grids) [Pg] |
Model Period Mean (intersection) [Pg] |
Benchmark Period Mean (intersection) [Pg] |
Model Period Mean (complement) [Pg] |
Benchmark Period Mean (complement) [Pg] |
Bias [kg m-2] |
Bias Score [1] |
Spatial Distribution Score [1] |
Overall Score [1] |
|||
|---|---|---|---|---|---|---|---|---|---|---|---|---|
| Benchmark | [-] | 11.4 | ||||||||||
| I123 | [-] | 24.9 | 24.5 | 11.5 | 0.00536 | 3.01 | 0.362 | 0.515 | 0.439 | |||
| post5.4 | [-] | 25.1 | 24.7 | 11.5 | 0.00536 | 3.03 | 0.360 | 0.512 | 0.436 |
Download Data |
Period Mean (original grids) [Pg] |
Model Period Mean (intersection) [Pg] |
Benchmark Period Mean (intersection) [Pg] |
Model Period Mean (complement) [Pg] |
Benchmark Period Mean (complement) [Pg] |
Bias [kg m-2] |
Bias Score [1] |
Spatial Distribution Score [1] |
Overall Score [1] |
|||
|---|---|---|---|---|---|---|---|---|---|---|---|---|
| Benchmark | [-] | 4.25 | ||||||||||
| I123 | [-] | 3.75 | 3.85 | 4.22 | 1.23e-05 | -0.0217 | 0.554 | 0.640 | 0.597 | |||
| post5.4 | [-] | 4.47 | 4.59 | 4.22 | 1.23e-05 | 0.190 | 0.518 | 0.729 | 0.624 |
Download Data |
Period Mean (original grids) [Pg] |
Model Period Mean (intersection) [Pg] |
Benchmark Period Mean (intersection) [Pg] |
Model Period Mean (complement) [Pg] |
Benchmark Period Mean (complement) [Pg] |
Bias [kg m-2] |
Bias Score [1] |
Spatial Distribution Score [1] |
Overall Score [1] |
|||
|---|---|---|---|---|---|---|---|---|---|---|---|---|
| Benchmark | [-] | 7.97 | ||||||||||
| I123 | [-] | 6.39 | 6.38 | 7.96 | 0.0163 | 0.362 | 0.561 | 0.664 | 0.612 | |||
| post5.4 | [-] | 6.63 | 6.62 | 7.96 | 0.0163 | 0.393 | 0.549 | 0.679 | 0.614 |
Download Data |
Period Mean (original grids) [Pg] |
Model Period Mean (intersection) [Pg] |
Benchmark Period Mean (intersection) [Pg] |
Model Period Mean (complement) [Pg] |
Benchmark Period Mean (complement) [Pg] |
Bias [kg m-2] |
Bias Score [1] |
Spatial Distribution Score [1] |
Overall Score [1] |
|||
|---|---|---|---|---|---|---|---|---|---|---|---|---|
| Benchmark | [-] | 19.2 | ||||||||||
| I123 | [-] | 13.4 | 13.0 | 19.3 | 0.00448 | -0.0238 | 0.453 | 0.778 | 0.615 | |||
| post5.4 | [-] | 14.2 | 13.9 | 19.3 | 0.00448 | 0.148 | 0.453 | 0.799 | 0.626 |
Download Data |
Period Mean (original grids) [Pg] |
Model Period Mean (intersection) [Pg] |
Benchmark Period Mean (intersection) [Pg] |
Model Period Mean (complement) [Pg] |
Benchmark Period Mean (complement) [Pg] |
Bias [kg m-2] |
Bias Score [1] |
Spatial Distribution Score [1] |
Overall Score [1] |
|||
|---|---|---|---|---|---|---|---|---|---|---|---|---|
| Benchmark | [-] | 447. | ||||||||||
| I123 | [-] | 470. | 469. | 447. | 0.00265 | 0.0766 | 0.848 | 0.577 | 0.885 | 0.731 | ||
| post5.4 | [-] | 481. | 480. | 447. | 0.00264 | 0.0766 | 0.932 | 0.572 | 0.884 | 0.728 |
Download Data |
Period Mean (original grids) [Pg] |
Model Period Mean (intersection) [Pg] |
Benchmark Period Mean (intersection) [Pg] |
Model Period Mean (complement) [Pg] |
Benchmark Period Mean (complement) [Pg] |
Bias [kg m-2] |
Bias Score [1] |
Spatial Distribution Score [1] |
Overall Score [1] |
|||
|---|---|---|---|---|---|---|---|---|---|---|---|---|
| Benchmark | [-] | 1.25 | ||||||||||
| I123 | [-] | 2.71 | 2.71 | 1.25 | 0.000647 | 0.155 | 0.860 | 0.566 | 0.713 | |||
| post5.4 | [-] | 2.78 | 2.78 | 1.25 | 0.000647 | 0.161 | 0.860 | 0.541 | 0.701 |
Download Data |
Period Mean (original grids) [Pg] |
Model Period Mean (intersection) [Pg] |
Benchmark Period Mean (intersection) [Pg] |
Model Period Mean (complement) [Pg] |
Benchmark Period Mean (complement) [Pg] |
Bias [kg m-2] |
Bias Score [1] |
Spatial Distribution Score [1] |
Overall Score [1] |
|||
|---|---|---|---|---|---|---|---|---|---|---|---|---|
| Benchmark | [-] | 7.25 | ||||||||||
| I123 | [-] | 5.99 | 5.84 | 7.25 | 0.00 | 0.0631 | 0.573 | 0.773 | 0.673 | |||
| post5.4 | [-] | 6.98 | 6.80 | 7.25 | 0.00 | 0.214 | 0.551 | 0.767 | 0.659 |
Download Data |
Period Mean (original grids) [Pg] |
Model Period Mean (intersection) [Pg] |
Benchmark Period Mean (intersection) [Pg] |
Model Period Mean (complement) [Pg] |
Benchmark Period Mean (complement) [Pg] |
Bias [kg m-2] |
Bias Score [1] |
Spatial Distribution Score [1] |
Overall Score [1] |
|||
|---|---|---|---|---|---|---|---|---|---|---|---|---|
| Benchmark | [-] | 7.19 | ||||||||||
| I123 | [-] | 11.2 | 10.8 | 7.17 | 0.0177 | 3.15 | 0.343 | 0.521 | 0.432 | |||
| post5.4 | [-] | 11.4 | 11.0 | 7.17 | 0.0177 | 3.24 | 0.338 | 0.510 | 0.424 |
Download Data |
Period Mean (original grids) [Pg] |
Model Period Mean (intersection) [Pg] |
Benchmark Period Mean (intersection) [Pg] |
Model Period Mean (complement) [Pg] |
Benchmark Period Mean (complement) [Pg] |
Bias [kg m-2] |
Bias Score [1] |
Spatial Distribution Score [1] |
Overall Score [1] |
|||
|---|---|---|---|---|---|---|---|---|---|---|---|---|
| Benchmark | [-] | 16.1 | ||||||||||
| I123 | [-] | 17.3 | 17.2 | 16.1 | 2.79e-05 | 0.820 | 0.598 | 0.932 | 0.765 | |||
| post5.4 | [-] | 18.3 | 18.2 | 16.1 | 2.79e-05 | 1.07 | 0.586 | 0.930 | 0.758 |
Download Data |
Period Mean (original grids) [Pg] |
Model Period Mean (intersection) [Pg] |
Benchmark Period Mean (intersection) [Pg] |
Model Period Mean (complement) [Pg] |
Benchmark Period Mean (complement) [Pg] |
Bias [kg m-2] |
Bias Score [1] |
Spatial Distribution Score [1] |
Overall Score [1] |
|||
|---|---|---|---|---|---|---|---|---|---|---|---|---|
| Benchmark | [-] | 25.1 | ||||||||||
| I123 | [-] | 26.4 | 26.5 | 25.1 | 0.00 | 0.946 | 0.513 | 0.868 | 0.691 | |||
| post5.4 | [-] | 28.7 | 28.8 | 25.1 | 0.00 | 1.38 | 0.493 | 0.861 | 0.677 |
Download Data |
Period Mean (original grids) [Pg] |
Model Period Mean (intersection) [Pg] |
Benchmark Period Mean (intersection) [Pg] |
Model Period Mean (complement) [Pg] |
Benchmark Period Mean (complement) [Pg] |
Bias [kg m-2] |
Bias Score [1] |
Spatial Distribution Score [1] |
Overall Score [1] |
|||
|---|---|---|---|---|---|---|---|---|---|---|---|---|
| Benchmark | [-] | 7.38 | ||||||||||
| I123 | [-] | 5.98 | 6.07 | 7.36 | 0.00 | 0.0374 | 0.494 | 0.804 | 0.649 | |||
| post5.4 | [-] | 6.23 | 6.33 | 7.36 | 0.00 | 0.115 | 0.477 | 0.816 | 0.647 |
Download Data |
Period Mean (original grids) [Pg] |
Model Period Mean (intersection) [Pg] |
Benchmark Period Mean (intersection) [Pg] |
Model Period Mean (complement) [Pg] |
Benchmark Period Mean (complement) [Pg] |
Bias [kg m-2] |
Bias Score [1] |
Spatial Distribution Score [1] |
Overall Score [1] |
|||
|---|---|---|---|---|---|---|---|---|---|---|---|---|
| Benchmark | [-] | 132. | ||||||||||
| I123 | [-] | 148. | 147. | 133. | 0.000467 | 2.40 | 0.666 | 0.939 | 0.802 | |||
| post5.4 | [-] | 147. | 146. | 133. | 0.000467 | 2.25 | 0.670 | 0.936 | 0.803 |
Download Data |
Period Mean (original grids) [Pg] |
Model Period Mean (intersection) [Pg] |
Benchmark Period Mean (intersection) [Pg] |
Model Period Mean (complement) [Pg] |
Benchmark Period Mean (complement) [Pg] |
Bias [kg m-2] |
Bias Score [1] |
Spatial Distribution Score [1] |
Overall Score [1] |
|||
|---|---|---|---|---|---|---|---|---|---|---|---|---|
| Benchmark | [-] | 15.4 | ||||||||||
| I123 | [-] | 21.8 | 22.4 | 15.3 | 0.00265 | 0.000561 | 1.26 | 0.457 | 0.836 | 0.647 | ||
| post5.4 | [-] | 21.6 | 22.2 | 15.3 | 0.00264 | 0.000561 | 1.22 | 0.452 | 0.828 | 0.640 |
Download Data |
Period Mean (original grids) [Pg] |
Model Period Mean (intersection) [Pg] |
Benchmark Period Mean (intersection) [Pg] |
Model Period Mean (complement) [Pg] |
Benchmark Period Mean (complement) [Pg] |
Bias [kg m-2] |
Bias Score [1] |
Spatial Distribution Score [1] |
Overall Score [1] |
|||
|---|---|---|---|---|---|---|---|---|---|---|---|---|
| Benchmark | [-] | 4.33 | ||||||||||
| I123 | [-] | 5.99 | 5.94 | 4.27 | 0.000238 | 1.03 | 0.496 | 0.757 | 0.626 | |||
| post5.4 | [-] | 6.21 | 6.15 | 4.27 | 0.000238 | 1.11 | 0.487 | 0.744 | 0.616 |
Temporally integrated period mean