Mean State
Download Data |
Period Mean (original grids) [Pg yr-1] |
Model Period Mean (intersection) [Pg yr-1] |
Benchmark Period Mean (intersection) [Pg yr-1] |
Model Period Mean (complement) [Pg yr-1] |
Benchmark Period Mean (complement) [Pg yr-1] |
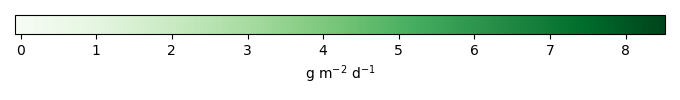
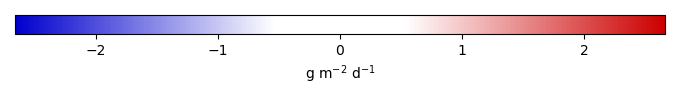
Bias [g m-2 d-1] |
RMSE [g m-2 d-1] |
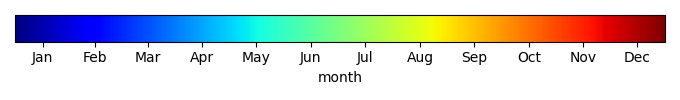
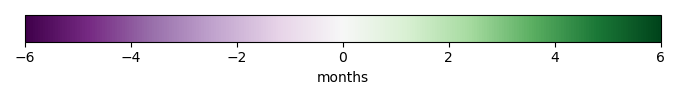
Phase Shift [months] |
Bias Score [1] |
RMSE Score [1] |
Seasonal Cycle Score [1] |
Spatial Distribution Score [1] |
Overall Score [1] |
|||
|---|---|---|---|---|---|---|---|---|---|---|---|---|---|---|---|---|
| Benchmark | [-] | 8.37 | ||||||||||||||
| I123 | [-] | 7.99 | 8.03 | 8.37 | 0.287 | -0.0336 | 1.28 | 1.61 | 0.516 | 0.443 | 0.758 | 0.986 | 0.629 | |||
| post5.4 | [-] | 8.08 | 8.13 | 8.38 | 0.288 | 0.0280 | 1.25 | 1.75 | 0.511 | 0.454 | 0.727 | 0.986 | 0.626 |
Download Data |
Period Mean (original grids) [Pg yr-1] |
Model Period Mean (intersection) [Pg yr-1] |
Benchmark Period Mean (intersection) [Pg yr-1] |
Model Period Mean (complement) [Pg yr-1] |
Benchmark Period Mean (complement) [Pg yr-1] |
Bias [g m-2 d-1] |
RMSE [g m-2 d-1] |
Phase Shift [months] |
Bias Score [1] |
RMSE Score [1] |
Seasonal Cycle Score [1] |
Spatial Distribution Score [1] |
Overall Score [1] |
|||
|---|---|---|---|---|---|---|---|---|---|---|---|---|---|---|---|---|
| Benchmark | [-] | 6.72 | ||||||||||||||
| I123 | [-] | 5.96 | 5.61 | 6.72 | 0.0563 | -0.425 | 1.92 | 0.961 | 0.567 | 0.443 | 0.889 | 0.756 | 0.620 | |||
| post5.4 | [-] | 6.23 | 5.88 | 6.77 | 0.0565 | -0.335 | 1.87 | 0.932 | 0.586 | 0.451 | 0.893 | 0.795 | 0.635 |
Download Data |
Period Mean (original grids) [Pg yr-1] |
Model Period Mean (intersection) [Pg yr-1] |
Benchmark Period Mean (intersection) [Pg yr-1] |
Model Period Mean (complement) [Pg yr-1] |
Benchmark Period Mean (complement) [Pg yr-1] |
Bias [g m-2 d-1] |
RMSE [g m-2 d-1] |
Phase Shift [months] |
Bias Score [1] |
RMSE Score [1] |
Seasonal Cycle Score [1] |
Spatial Distribution Score [1] |
Overall Score [1] |
|||
|---|---|---|---|---|---|---|---|---|---|---|---|---|---|---|---|---|
| Benchmark | [-] | 9.63 | ||||||||||||||
| I123 | [-] | 8.19 | 7.68 | 9.63 | 0.415 | 0.000762 | -0.449 | 1.86 | 1.13 | 0.587 | 0.468 | 0.857 | 0.964 | 0.669 | ||
| post5.4 | [-] | 8.46 | 7.93 | 9.62 | 0.435 | 0.000760 | -0.364 | 1.81 | 1.22 | 0.597 | 0.484 | 0.844 | 0.964 | 0.675 |
Download Data |
Period Mean (original grids) [Pg yr-1] |
Model Period Mean (intersection) [Pg yr-1] |
Benchmark Period Mean (intersection) [Pg yr-1] |
Model Period Mean (complement) [Pg yr-1] |
Benchmark Period Mean (complement) [Pg yr-1] |
Bias [g m-2 d-1] |
RMSE [g m-2 d-1] |
Phase Shift [months] |
Bias Score [1] |
RMSE Score [1] |
Seasonal Cycle Score [1] |
Spatial Distribution Score [1] |
Overall Score [1] |
|||
|---|---|---|---|---|---|---|---|---|---|---|---|---|---|---|---|---|
| Benchmark | [-] | 0.500 | ||||||||||||||
| I123 | [-] | 0.848 | 0.803 | 0.500 | 0.0524 | 0.335 | 0.984 | 0.102 | 0.666 | 0.448 | 0.990 | 0.531 | 0.616 | |||
| post5.4 | [-] | 1.18 | 1.11 | 0.503 | 0.0735 | 0.633 | 1.31 | 0.0769 | 0.551 | 0.391 | 0.994 | 0.404 | 0.546 |
Download Data |
Period Mean (original grids) [Pg yr-1] |
Model Period Mean (intersection) [Pg yr-1] |
Benchmark Period Mean (intersection) [Pg yr-1] |
Model Period Mean (complement) [Pg yr-1] |
Benchmark Period Mean (complement) [Pg yr-1] |
Bias [g m-2 d-1] |
RMSE [g m-2 d-1] |
Phase Shift [months] |
Bias Score [1] |
RMSE Score [1] |
Seasonal Cycle Score [1] |
Spatial Distribution Score [1] |
Overall Score [1] |
|||
|---|---|---|---|---|---|---|---|---|---|---|---|---|---|---|---|---|
| Benchmark | [-] | 7.70 | ||||||||||||||
| I123 | [-] | 6.85 | 5.40 | 7.69 | 1.41 | 0.0103 | -0.456 | 1.19 | 2.36 | 0.286 | 0.328 | 0.645 | 0.979 | 0.513 | ||
| post5.4 | [-] | 6.85 | 5.39 | 7.69 | 1.41 | 0.0103 | -0.459 | 1.21 | 2.25 | 0.295 | 0.317 | 0.663 | 0.937 | 0.506 |
Download Data |
Period Mean (original grids) [Pg yr-1] |
Model Period Mean (intersection) [Pg yr-1] |
Benchmark Period Mean (intersection) [Pg yr-1] |
Model Period Mean (complement) [Pg yr-1] |
Benchmark Period Mean (complement) [Pg yr-1] |
Bias [g m-2 d-1] |
RMSE [g m-2 d-1] |
Phase Shift [months] |
Bias Score [1] |
RMSE Score [1] |
Seasonal Cycle Score [1] |
Spatial Distribution Score [1] |
Overall Score [1] |
|||
|---|---|---|---|---|---|---|---|---|---|---|---|---|---|---|---|---|
| Benchmark | [-] | 5.23 | ||||||||||||||
| I123 | [-] | 5.56 | 5.31 | 5.23 | 0.0810 | 5.49e-06 | 0.0514 | 1.19 | 0.294 | 0.760 | 0.654 | 0.981 | 0.950 | 0.800 | ||
| post5.4 | [-] | 6.34 | 6.07 | 5.23 | 0.0934 | 5.51e-06 | 0.287 | 1.22 | 0.537 | 0.732 | 0.657 | 0.964 | 0.942 | 0.790 |
Download Data |
Period Mean (original grids) [Pg yr-1] |
Model Period Mean (intersection) [Pg yr-1] |
Benchmark Period Mean (intersection) [Pg yr-1] |
Model Period Mean (complement) [Pg yr-1] |
Benchmark Period Mean (complement) [Pg yr-1] |
Bias [g m-2 d-1] |
RMSE [g m-2 d-1] |
Phase Shift [months] |
Bias Score [1] |
RMSE Score [1] |
Seasonal Cycle Score [1] |
Spatial Distribution Score [1] |
Overall Score [1] |
|||
|---|---|---|---|---|---|---|---|---|---|---|---|---|---|---|---|---|
| Benchmark | [-] | 9.46 | ||||||||||||||
| I123 | [-] | 10.2 | 9.89 | 9.46 | 0.482 | 0.174 | 1.06 | 0.677 | 0.649 | 0.530 | 0.928 | 0.961 | 0.719 | |||
| post5.4 | [-] | 10.2 | 9.85 | 9.47 | 0.484 | 0.166 | 1.11 | 0.695 | 0.629 | 0.527 | 0.930 | 0.946 | 0.712 |
Download Data |
Period Mean (original grids) [Pg yr-1] |
Model Period Mean (intersection) [Pg yr-1] |
Benchmark Period Mean (intersection) [Pg yr-1] |
Model Period Mean (complement) [Pg yr-1] |
Benchmark Period Mean (complement) [Pg yr-1] |
Bias [g m-2 d-1] |
RMSE [g m-2 d-1] |
Phase Shift [months] |
Bias Score [1] |
RMSE Score [1] |
Seasonal Cycle Score [1] |
Spatial Distribution Score [1] |
Overall Score [1] |
|||
|---|---|---|---|---|---|---|---|---|---|---|---|---|---|---|---|---|
| Benchmark | [-] | 9.28 | ||||||||||||||
| I123 | [-] | 8.32 | 7.52 | 9.28 | 0.715 | 0.00218 | -0.323 | 1.46 | 1.10 | 0.644 | 0.501 | 0.862 | 0.987 | 0.699 | ||
| post5.4 | [-] | 8.38 | 7.57 | 9.29 | 0.722 | 0.00219 | -0.302 | 1.43 | 1.05 | 0.642 | 0.509 | 0.873 | 0.986 | 0.704 |
Download Data |
Period Mean (original grids) [Pg yr-1] |
Model Period Mean (intersection) [Pg yr-1] |
Benchmark Period Mean (intersection) [Pg yr-1] |
Model Period Mean (complement) [Pg yr-1] |
Benchmark Period Mean (complement) [Pg yr-1] |
Bias [g m-2 d-1] |
RMSE [g m-2 d-1] |
Phase Shift [months] |
Bias Score [1] |
RMSE Score [1] |
Seasonal Cycle Score [1] |
Spatial Distribution Score [1] |
Overall Score [1] |
|||
|---|---|---|---|---|---|---|---|---|---|---|---|---|---|---|---|---|
| Benchmark | [-] | 0.560 | ||||||||||||||
| I123 | [-] | 1.25 | 1.24 | 0.560 | 0.0390 | 0.600 | 1.37 | 0.173 | 0.564 | 0.330 | 0.984 | 0.644 | 0.571 | |||
| post5.4 | [-] | 1.63 | 1.61 | 0.561 | 0.0561 | 0.923 | 1.85 | 0.134 | 0.435 | 0.255 | 0.987 | 0.507 | 0.488 |
Download Data |
Period Mean (original grids) [Pg yr-1] |
Model Period Mean (intersection) [Pg yr-1] |
Benchmark Period Mean (intersection) [Pg yr-1] |
Model Period Mean (complement) [Pg yr-1] |
Benchmark Period Mean (complement) [Pg yr-1] |
Bias [g m-2 d-1] |
RMSE [g m-2 d-1] |
Phase Shift [months] |
Bias Score [1] |
RMSE Score [1] |
Seasonal Cycle Score [1] |
Spatial Distribution Score [1] |
Overall Score [1] |
|||
|---|---|---|---|---|---|---|---|---|---|---|---|---|---|---|---|---|
| Benchmark | [-] | 3.40 | ||||||||||||||
| I123 | [-] | 3.75 | 3.38 | 3.39 | 0.359 | 0.00722 | 0.187 | 0.850 | 1.54 | 0.493 | 0.530 | 0.772 | 0.857 | 0.637 | ||
| post5.4 | [-] | 4.05 | 3.65 | 3.40 | 0.379 | 0.00721 | 0.288 | 0.849 | 1.24 | 0.474 | 0.559 | 0.837 | 0.891 | 0.664 |
Download Data |
Period Mean (original grids) [Pg yr-1] |
Model Period Mean (intersection) [Pg yr-1] |
Benchmark Period Mean (intersection) [Pg yr-1] |
Model Period Mean (complement) [Pg yr-1] |
Benchmark Period Mean (complement) [Pg yr-1] |
Bias [g m-2 d-1] |
RMSE [g m-2 d-1] |
Phase Shift [months] |
Bias Score [1] |
RMSE Score [1] |
Seasonal Cycle Score [1] |
Spatial Distribution Score [1] |
Overall Score [1] |
|||
|---|---|---|---|---|---|---|---|---|---|---|---|---|---|---|---|---|
| Benchmark | [-] | 4.65 | ||||||||||||||
| I123 | [-] | 4.33 | 3.92 | 4.64 | 0.381 | 0.00423 | -0.100 | 1.43 | 0.246 | 0.705 | 0.565 | 0.984 | 0.880 | 0.740 | ||
| post5.4 | [-] | 4.44 | 4.02 | 4.65 | 0.393 | 0.00421 | -0.0434 | 1.43 | 0.270 | 0.697 | 0.565 | 0.982 | 0.856 | 0.733 |
Download Data |
Period Mean (original grids) [Pg yr-1] |
Model Period Mean (intersection) [Pg yr-1] |
Benchmark Period Mean (intersection) [Pg yr-1] |
Model Period Mean (complement) [Pg yr-1] |
Benchmark Period Mean (complement) [Pg yr-1] |
Bias [g m-2 d-1] |
RMSE [g m-2 d-1] |
Phase Shift [months] |
Bias Score [1] |
RMSE Score [1] |
Seasonal Cycle Score [1] |
Spatial Distribution Score [1] |
Overall Score [1] |
|||
|---|---|---|---|---|---|---|---|---|---|---|---|---|---|---|---|---|
| Benchmark | [-] | 114. | ||||||||||||||
| I123 | [-] | 115. | 108. | 114. | 6.62 | 0.0378 | 0.0575 | 1.27 | 0.893 | 0.587 | 0.509 | 0.888 | 0.969 | 0.692 | ||
| post5.4 | [-] | 119. | 112. | 114. | 6.85 | 0.0378 | 0.159 | 1.31 | 0.906 | 0.570 | 0.506 | 0.892 | 0.966 | 0.688 |
Download Data |
Period Mean (original grids) [Pg yr-1] |
Model Period Mean (intersection) [Pg yr-1] |
Benchmark Period Mean (intersection) [Pg yr-1] |
Model Period Mean (complement) [Pg yr-1] |
Benchmark Period Mean (complement) [Pg yr-1] |
Bias [g m-2 d-1] |
RMSE [g m-2 d-1] |
Phase Shift [months] |
Bias Score [1] |
RMSE Score [1] |
Seasonal Cycle Score [1] |
Spatial Distribution Score [1] |
Overall Score [1] |
|||
|---|---|---|---|---|---|---|---|---|---|---|---|---|---|---|---|---|
| Benchmark | [-] | 1.69 | ||||||||||||||
| I123 | [-] | 1.85 | 1.59 | 1.69 | 0.291 | 0.0384 | 0.782 | 0.884 | 0.535 | 0.393 | 0.890 | 0.939 | 0.630 | |||
| post5.4 | [-] | 1.82 | 1.57 | 1.69 | 0.285 | 0.0225 | 0.754 | 0.948 | 0.541 | 0.398 | 0.878 | 0.941 | 0.631 |
Download Data |
Period Mean (original grids) [Pg yr-1] |
Model Period Mean (intersection) [Pg yr-1] |
Benchmark Period Mean (intersection) [Pg yr-1] |
Model Period Mean (complement) [Pg yr-1] |
Benchmark Period Mean (complement) [Pg yr-1] |
Bias [g m-2 d-1] |
RMSE [g m-2 d-1] |
Phase Shift [months] |
Bias Score [1] |
RMSE Score [1] |
Seasonal Cycle Score [1] |
Spatial Distribution Score [1] |
Overall Score [1] |
|||
|---|---|---|---|---|---|---|---|---|---|---|---|---|---|---|---|---|
| Benchmark | [-] | 0.893 | ||||||||||||||
| I123 | [-] | 2.03 | 1.87 | 0.893 | 0.129 | 0.545 | 1.16 | 0.593 | 0.508 | 0.366 | 0.926 | 0.576 | 0.548 | |||
| post5.4 | [-] | 2.48 | 2.28 | 0.889 | 0.164 | 0.763 | 1.44 | 0.531 | 0.427 | 0.321 | 0.941 | 0.481 | 0.498 |
Download Data |
Period Mean (original grids) [Pg yr-1] |
Model Period Mean (intersection) [Pg yr-1] |
Benchmark Period Mean (intersection) [Pg yr-1] |
Model Period Mean (complement) [Pg yr-1] |
Benchmark Period Mean (complement) [Pg yr-1] |
Bias [g m-2 d-1] |
RMSE [g m-2 d-1] |
Phase Shift [months] |
Bias Score [1] |
RMSE Score [1] |
Seasonal Cycle Score [1] |
Spatial Distribution Score [1] |
Overall Score [1] |
|||
|---|---|---|---|---|---|---|---|---|---|---|---|---|---|---|---|---|
| Benchmark | [-] | 3.75 | ||||||||||||||
| I123 | [-] | 3.50 | 2.81 | 3.73 | 0.594 | 0.0112 | -0.0233 | 1.28 | 0.772 | 0.552 | 0.539 | 0.915 | 0.982 | 0.705 | ||
| post5.4 | [-] | 3.66 | 2.94 | 3.73 | 0.618 | 0.0112 | 0.150 | 1.30 | 0.837 | 0.544 | 0.528 | 0.913 | 0.981 | 0.699 |
Download Data |
Period Mean (original grids) [Pg yr-1] |
Model Period Mean (intersection) [Pg yr-1] |
Benchmark Period Mean (intersection) [Pg yr-1] |
Model Period Mean (complement) [Pg yr-1] |
Benchmark Period Mean (complement) [Pg yr-1] |
Bias [g m-2 d-1] |
RMSE [g m-2 d-1] |
Phase Shift [months] |
Bias Score [1] |
RMSE Score [1] |
Seasonal Cycle Score [1] |
Spatial Distribution Score [1] |
Overall Score [1] |
|||
|---|---|---|---|---|---|---|---|---|---|---|---|---|---|---|---|---|
| Benchmark | [-] | 4.42 | ||||||||||||||
| I123 | [-] | 4.70 | 4.40 | 4.42 | 0.213 | 0.129 | 1.26 | 0.306 | 0.789 | 0.679 | 0.979 | 0.956 | 0.817 | |||
| post5.4 | [-] | 4.82 | 4.50 | 4.43 | 0.227 | 0.211 | 1.36 | 0.481 | 0.794 | 0.661 | 0.968 | 0.984 | 0.813 |
Download Data |
Period Mean (original grids) [Pg yr-1] |
Model Period Mean (intersection) [Pg yr-1] |
Benchmark Period Mean (intersection) [Pg yr-1] |
Model Period Mean (complement) [Pg yr-1] |
Benchmark Period Mean (complement) [Pg yr-1] |
Bias [g m-2 d-1] |
RMSE [g m-2 d-1] |
Phase Shift [months] |
Bias Score [1] |
RMSE Score [1] |
Seasonal Cycle Score [1] |
Spatial Distribution Score [1] |
Overall Score [1] |
|||
|---|---|---|---|---|---|---|---|---|---|---|---|---|---|---|---|---|
| Benchmark | [-] | 3.23 | ||||||||||||||
| I123 | [-] | 3.36 | 3.22 | 3.23 | 0.181 | 0.0672 | 1.08 | 0.504 | 0.728 | 0.653 | 0.967 | 0.908 | 0.782 | |||
| post5.4 | [-] | 3.66 | 3.51 | 3.24 | 0.200 | 0.230 | 1.07 | 0.757 | 0.727 | 0.654 | 0.950 | 0.944 | 0.786 |
Download Data |
Period Mean (original grids) [Pg yr-1] |
Model Period Mean (intersection) [Pg yr-1] |
Benchmark Period Mean (intersection) [Pg yr-1] |
Model Period Mean (complement) [Pg yr-1] |
Benchmark Period Mean (complement) [Pg yr-1] |
Bias [g m-2 d-1] |
RMSE [g m-2 d-1] |
Phase Shift [months] |
Bias Score [1] |
RMSE Score [1] |
Seasonal Cycle Score [1] |
Spatial Distribution Score [1] |
Overall Score [1] |
|||
|---|---|---|---|---|---|---|---|---|---|---|---|---|---|---|---|---|
| Benchmark | [-] | 1.49 | ||||||||||||||
| I123 | [-] | 1.75 | 1.80 | 1.49 | 0.0450 | 0.266 | 0.893 | 0.539 | 0.547 | 0.538 | 0.948 | 0.940 | 0.702 | |||
| post5.4 | [-] | 1.79 | 1.84 | 1.48 | 0.0460 | 0.306 | 0.899 | 0.506 | 0.541 | 0.543 | 0.950 | 0.945 | 0.705 |
Download Data |
Period Mean (original grids) [Pg yr-1] |
Model Period Mean (intersection) [Pg yr-1] |
Benchmark Period Mean (intersection) [Pg yr-1] |
Model Period Mean (complement) [Pg yr-1] |
Benchmark Period Mean (complement) [Pg yr-1] |
Bias [g m-2 d-1] |
RMSE [g m-2 d-1] |
Phase Shift [months] |
Bias Score [1] |
RMSE Score [1] |
Seasonal Cycle Score [1] |
Spatial Distribution Score [1] |
Overall Score [1] |
|||
|---|---|---|---|---|---|---|---|---|---|---|---|---|---|---|---|---|
| Benchmark | [-] | 21.8 | ||||||||||||||
| I123 | [-] | 23.0 | 22.4 | 21.8 | 0.508 | 0.309 | 1.40 | 1.95 | 0.343 | 0.476 | 0.713 | 0.731 | 0.548 | |||
| post5.4 | [-] | 23.2 | 22.5 | 21.8 | 0.519 | 0.374 | 1.45 | 1.77 | 0.332 | 0.468 | 0.741 | 0.721 | 0.546 |
Download Data |
Period Mean (original grids) [Pg yr-1] |
Model Period Mean (intersection) [Pg yr-1] |
Benchmark Period Mean (intersection) [Pg yr-1] |
Model Period Mean (complement) [Pg yr-1] |
Benchmark Period Mean (complement) [Pg yr-1] |
Bias [g m-2 d-1] |
RMSE [g m-2 d-1] |
Phase Shift [months] |
Bias Score [1] |
RMSE Score [1] |
Seasonal Cycle Score [1] |
Spatial Distribution Score [1] |
Overall Score [1] |
|||
|---|---|---|---|---|---|---|---|---|---|---|---|---|---|---|---|---|
| Benchmark | [-] | 9.60 | ||||||||||||||
| I123 | [-] | 9.91 | 9.82 | 9.59 | 0.249 | 0.00187 | 0.212 | 1.62 | 0.823 | 0.638 | 0.602 | 0.919 | 0.909 | 0.734 | ||
| post5.4 | [-] | 10.4 | 10.3 | 9.59 | 0.252 | 0.00188 | 0.429 | 1.62 | 0.897 | 0.633 | 0.609 | 0.915 | 0.916 | 0.736 |
Download Data |
Period Mean (original grids) [Pg yr-1] |
Model Period Mean (intersection) [Pg yr-1] |
Benchmark Period Mean (intersection) [Pg yr-1] |
Model Period Mean (complement) [Pg yr-1] |
Benchmark Period Mean (complement) [Pg yr-1] |
Bias [g m-2 d-1] |
RMSE [g m-2 d-1] |
Phase Shift [months] |
Bias Score [1] |
RMSE Score [1] |
Seasonal Cycle Score [1] |
Spatial Distribution Score [1] |
Overall Score [1] |
|||
|---|---|---|---|---|---|---|---|---|---|---|---|---|---|---|---|---|
| Benchmark | [-] | 1.27 | ||||||||||||||
| I123 | [-] | 1.53 | 1.36 | 1.27 | 0.123 | 0.251 | 1.00 | 0.829 | 0.395 | 0.463 | 0.909 | 0.867 | 0.620 | |||
| post5.4 | [-] | 1.64 | 1.45 | 1.27 | 0.132 | 0.353 | 1.06 | 0.819 | 0.371 | 0.453 | 0.914 | 0.876 | 0.613 |
Temporally integrated period mean