Mean State
Download Data |
Period Mean (original grids) [Pg yr-1] |
Model Period Mean (intersection) [Pg yr-1] |
Benchmark Period Mean (intersection) [Pg yr-1] |
Model Period Mean (complement) [Pg yr-1] |
Benchmark Period Mean (complement) [Pg yr-1] |
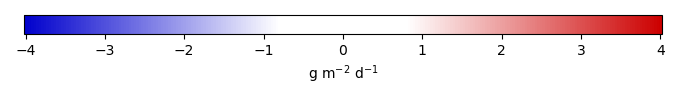
Bias [g m-2 d-1] |
RMSE [g m-2 d-1] |
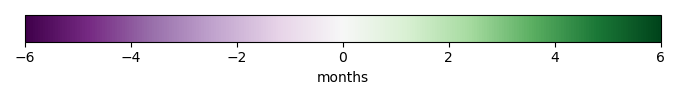
Phase Shift [months] |
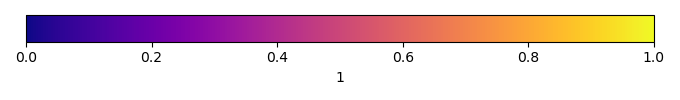
Bias Score [1] |
RMSE Score [1] |
Seasonal Cycle Score [1] |
Spatial Distribution Score [1] |
Overall Score [1] |
|||
|---|---|---|---|---|---|---|---|---|---|---|---|---|---|---|---|---|
| Benchmark | [-] | 8.19 | ||||||||||||||
| I123 | [-] | 7.97 | 8.03 | 8.19 | 0.275 | 0.0791 | 1.26 | 1.98 | 0.362 | 0.411 | 0.686 | 0.987 | 0.571 | |||
| post5.4 | [-] | 8.02 | 8.08 | 8.21 | 0.275 | 0.0989 | 1.24 | 2.08 | 0.374 | 0.426 | 0.661 | 0.987 | 0.575 |
Download Data |
Period Mean (original grids) [Pg yr-1] |
Model Period Mean (intersection) [Pg yr-1] |
Benchmark Period Mean (intersection) [Pg yr-1] |
Model Period Mean (complement) [Pg yr-1] |
Benchmark Period Mean (complement) [Pg yr-1] |
Bias [g m-2 d-1] |
RMSE [g m-2 d-1] |
Phase Shift [months] |
Bias Score [1] |
RMSE Score [1] |
Seasonal Cycle Score [1] |
Spatial Distribution Score [1] |
Overall Score [1] |
|||
|---|---|---|---|---|---|---|---|---|---|---|---|---|---|---|---|---|
| Benchmark | [-] | 5.55 | ||||||||||||||
| I123 | [-] | 5.92 | 5.60 | 5.55 | 0.0311 | 0.0466 | 1.75 | 1.27 | 0.467 | 0.388 | 0.855 | 0.758 | 0.571 | |||
| post5.4 | [-] | 6.17 | 5.84 | 5.66 | 0.0309 | 0.0999 | 1.72 | 1.27 | 0.474 | 0.394 | 0.852 | 0.790 | 0.581 |
Download Data |
Period Mean (original grids) [Pg yr-1] |
Model Period Mean (intersection) [Pg yr-1] |
Benchmark Period Mean (intersection) [Pg yr-1] |
Model Period Mean (complement) [Pg yr-1] |
Benchmark Period Mean (complement) [Pg yr-1] |
Bias [g m-2 d-1] |
RMSE [g m-2 d-1] |
Phase Shift [months] |
Bias Score [1] |
RMSE Score [1] |
Seasonal Cycle Score [1] |
Spatial Distribution Score [1] |
Overall Score [1] |
|||
|---|---|---|---|---|---|---|---|---|---|---|---|---|---|---|---|---|
| Benchmark | [-] | 9.94 | ||||||||||||||
| I123 | [-] | 8.15 | 7.71 | 9.94 | 0.350 | 0.000669 | -0.510 | 1.56 | 1.15 | 0.482 | 0.461 | 0.853 | 0.955 | 0.642 | ||
| post5.4 | [-] | 8.38 | 7.93 | 9.93 | 0.360 | 0.000669 | -0.432 | 1.53 | 1.27 | 0.496 | 0.471 | 0.836 | 0.954 | 0.646 |
Download Data |
Period Mean (original grids) [Pg yr-1] |
Model Period Mean (intersection) [Pg yr-1] |
Benchmark Period Mean (intersection) [Pg yr-1] |
Model Period Mean (complement) [Pg yr-1] |
Benchmark Period Mean (complement) [Pg yr-1] |
Bias [g m-2 d-1] |
RMSE [g m-2 d-1] |
Phase Shift [months] |
Bias Score [1] |
RMSE Score [1] |
Seasonal Cycle Score [1] |
Spatial Distribution Score [1] |
Overall Score [1] |
|||
|---|---|---|---|---|---|---|---|---|---|---|---|---|---|---|---|---|
| Benchmark | [-] | 1.03 | ||||||||||||||
| I123 | [-] | 0.843 | 0.809 | 1.03 | 0.0402 | -0.103 | 0.914 | 0.0628 | 0.705 | 0.509 | 0.993 | 0.905 | 0.724 | |||
| post5.4 | [-] | 1.15 | 1.10 | 1.04 | 0.0551 | 0.166 | 1.12 | 0.0361 | 0.663 | 0.461 | 0.997 | 0.835 | 0.683 |
Download Data |
Period Mean (original grids) [Pg yr-1] |
Model Period Mean (intersection) [Pg yr-1] |
Benchmark Period Mean (intersection) [Pg yr-1] |
Model Period Mean (complement) [Pg yr-1] |
Benchmark Period Mean (complement) [Pg yr-1] |
Bias [g m-2 d-1] |
RMSE [g m-2 d-1] |
Phase Shift [months] |
Bias Score [1] |
RMSE Score [1] |
Seasonal Cycle Score [1] |
Spatial Distribution Score [1] |
Overall Score [1] |
|||
|---|---|---|---|---|---|---|---|---|---|---|---|---|---|---|---|---|
| Benchmark | [-] | 7.13 | ||||||||||||||
| I123 | [-] | 6.83 | 5.60 | 7.12 | 1.19 | 0.00948 | 0.712 | 2.06 | 2.44 | 0.181 | 0.222 | 0.622 | 0.551 | 0.360 | ||
| post5.4 | [-] | 6.82 | 5.58 | 7.13 | 1.19 | 0.00948 | 0.688 | 2.10 | 2.28 | 0.185 | 0.216 | 0.655 | 0.625 | 0.379 |
Download Data |
Period Mean (original grids) [Pg yr-1] |
Model Period Mean (intersection) [Pg yr-1] |
Benchmark Period Mean (intersection) [Pg yr-1] |
Model Period Mean (complement) [Pg yr-1] |
Benchmark Period Mean (complement) [Pg yr-1] |
Bias [g m-2 d-1] |
RMSE [g m-2 d-1] |
Phase Shift [months] |
Bias Score [1] |
RMSE Score [1] |
Seasonal Cycle Score [1] |
Spatial Distribution Score [1] |
Overall Score [1] |
|||
|---|---|---|---|---|---|---|---|---|---|---|---|---|---|---|---|---|
| Benchmark | [-] | 6.86 | ||||||||||||||
| I123 | [-] | 5.55 | 5.34 | 6.86 | 0.0472 | 1.96e-06 | -0.434 | 1.20 | 0.343 | 0.763 | 0.676 | 0.977 | 0.959 | 0.810 | ||
| post5.4 | [-] | 6.26 | 6.03 | 6.88 | 0.0541 | 1.96e-06 | -0.225 | 1.21 | 0.636 | 0.770 | 0.665 | 0.958 | 0.962 | 0.804 |
Download Data |
Period Mean (original grids) [Pg yr-1] |
Model Period Mean (intersection) [Pg yr-1] |
Benchmark Period Mean (intersection) [Pg yr-1] |
Model Period Mean (complement) [Pg yr-1] |
Benchmark Period Mean (complement) [Pg yr-1] |
Bias [g m-2 d-1] |
RMSE [g m-2 d-1] |
Phase Shift [months] |
Bias Score [1] |
RMSE Score [1] |
Seasonal Cycle Score [1] |
Spatial Distribution Score [1] |
Overall Score [1] |
|||
|---|---|---|---|---|---|---|---|---|---|---|---|---|---|---|---|---|
| Benchmark | [-] | 10.1 | ||||||||||||||
| I123 | [-] | 10.2 | 9.97 | 10.1 | 0.356 | 0.0903 | 0.914 | 1.02 | 0.620 | 0.486 | 0.875 | 0.965 | 0.686 | |||
| post5.4 | [-] | 10.2 | 9.98 | 10.2 | 0.353 | 0.0777 | 0.979 | 1.08 | 0.610 | 0.476 | 0.873 | 0.955 | 0.678 |
Download Data |
Period Mean (original grids) [Pg yr-1] |
Model Period Mean (intersection) [Pg yr-1] |
Benchmark Period Mean (intersection) [Pg yr-1] |
Model Period Mean (complement) [Pg yr-1] |
Benchmark Period Mean (complement) [Pg yr-1] |
Bias [g m-2 d-1] |
RMSE [g m-2 d-1] |
Phase Shift [months] |
Bias Score [1] |
RMSE Score [1] |
Seasonal Cycle Score [1] |
Spatial Distribution Score [1] |
Overall Score [1] |
|||
|---|---|---|---|---|---|---|---|---|---|---|---|---|---|---|---|---|
| Benchmark | [-] | 8.37 | ||||||||||||||
| I123 | [-] | 8.28 | 7.63 | 8.37 | 0.564 | 0.00159 | 0.208 | 1.60 | 1.60 | 0.507 | 0.411 | 0.783 | 0.944 | 0.611 | ||
| post5.4 | [-] | 8.32 | 7.67 | 8.44 | 0.565 | 0.00160 | 0.196 | 1.58 | 1.56 | 0.518 | 0.420 | 0.792 | 0.951 | 0.620 |
Download Data |
Period Mean (original grids) [Pg yr-1] |
Model Period Mean (intersection) [Pg yr-1] |
Benchmark Period Mean (intersection) [Pg yr-1] |
Model Period Mean (complement) [Pg yr-1] |
Benchmark Period Mean (complement) [Pg yr-1] |
Bias [g m-2 d-1] |
RMSE [g m-2 d-1] |
Phase Shift [months] |
Bias Score [1] |
RMSE Score [1] |
Seasonal Cycle Score [1] |
Spatial Distribution Score [1] |
Overall Score [1] |
|||
|---|---|---|---|---|---|---|---|---|---|---|---|---|---|---|---|---|
| Benchmark | [-] | 1.28 | ||||||||||||||
| I123 | [-] | 1.24 | 1.25 | 1.28 | 0.0233 | 5.71e-07 | 0.0231 | 0.931 | 0.192 | 0.778 | 0.529 | 0.979 | 0.965 | 0.756 | ||
| post5.4 | [-] | 1.59 | 1.59 | 1.29 | 0.0327 | 5.74e-07 | 0.307 | 1.26 | 0.159 | 0.713 | 0.446 | 0.982 | 0.921 | 0.702 |
Download Data |
Period Mean (original grids) [Pg yr-1] |
Model Period Mean (intersection) [Pg yr-1] |
Benchmark Period Mean (intersection) [Pg yr-1] |
Model Period Mean (complement) [Pg yr-1] |
Benchmark Period Mean (complement) [Pg yr-1] |
Bias [g m-2 d-1] |
RMSE [g m-2 d-1] |
Phase Shift [months] |
Bias Score [1] |
RMSE Score [1] |
Seasonal Cycle Score [1] |
Spatial Distribution Score [1] |
Overall Score [1] |
|||
|---|---|---|---|---|---|---|---|---|---|---|---|---|---|---|---|---|
| Benchmark | [-] | 3.53 | ||||||||||||||
| I123 | [-] | 3.73 | 3.38 | 3.52 | 0.329 | 0.00284 | 0.187 | 0.778 | 1.74 | 0.463 | 0.347 | 0.750 | 0.914 | 0.565 | ||
| post5.4 | [-] | 3.97 | 3.61 | 3.54 | 0.347 | 0.00284 | 0.269 | 0.791 | 1.48 | 0.435 | 0.366 | 0.802 | 0.916 | 0.577 |
Download Data |
Period Mean (original grids) [Pg yr-1] |
Model Period Mean (intersection) [Pg yr-1] |
Benchmark Period Mean (intersection) [Pg yr-1] |
Model Period Mean (complement) [Pg yr-1] |
Benchmark Period Mean (complement) [Pg yr-1] |
Bias [g m-2 d-1] |
RMSE [g m-2 d-1] |
Phase Shift [months] |
Bias Score [1] |
RMSE Score [1] |
Seasonal Cycle Score [1] |
Spatial Distribution Score [1] |
Overall Score [1] |
|||
|---|---|---|---|---|---|---|---|---|---|---|---|---|---|---|---|---|
| Benchmark | [-] | 5.29 | ||||||||||||||
| I123 | [-] | 4.32 | 4.05 | 5.28 | 0.245 | 0.00303 | -0.256 | 1.64 | 0.351 | 0.642 | 0.528 | 0.976 | 0.786 | 0.692 | ||
| post5.4 | [-] | 4.41 | 4.12 | 5.32 | 0.251 | 0.00307 | -0.227 | 1.66 | 0.391 | 0.643 | 0.525 | 0.973 | 0.755 | 0.684 |
Download Data |
Period Mean (original grids) [Pg yr-1] |
Model Period Mean (intersection) [Pg yr-1] |
Benchmark Period Mean (intersection) [Pg yr-1] |
Model Period Mean (complement) [Pg yr-1] |
Benchmark Period Mean (complement) [Pg yr-1] |
Bias [g m-2 d-1] |
RMSE [g m-2 d-1] |
Phase Shift [months] |
Bias Score [1] |
RMSE Score [1] |
Seasonal Cycle Score [1] |
Spatial Distribution Score [1] |
Overall Score [1] |
|||
|---|---|---|---|---|---|---|---|---|---|---|---|---|---|---|---|---|
| Benchmark | [-] | 118. | ||||||||||||||
| I123 | [-] | 115. | 109. | 118. | 5.11 | 0.0258 | 0.0176 | 1.19 | 1.18 | 0.528 | 0.454 | 0.842 | 0.965 | 0.649 | ||
| post5.4 | [-] | 119. | 113. | 119. | 5.26 | 0.0258 | 0.0967 | 1.24 | 1.21 | 0.521 | 0.445 | 0.842 | 0.964 | 0.643 |
Download Data |
Period Mean (original grids) [Pg yr-1] |
Model Period Mean (intersection) [Pg yr-1] |
Benchmark Period Mean (intersection) [Pg yr-1] |
Model Period Mean (complement) [Pg yr-1] |
Benchmark Period Mean (complement) [Pg yr-1] |
Bias [g m-2 d-1] |
RMSE [g m-2 d-1] |
Phase Shift [months] |
Bias Score [1] |
RMSE Score [1] |
Seasonal Cycle Score [1] |
Spatial Distribution Score [1] |
Overall Score [1] |
|||
|---|---|---|---|---|---|---|---|---|---|---|---|---|---|---|---|---|
| Benchmark | [-] | 0.864 | ||||||||||||||
| I123 | [-] | 1.84 | 1.75 | 0.864 | 0.122 | 0.000218 | 0.375 | 0.707 | 2.18 | 0.261 | 0.120 | 0.657 | 0.815 | 0.395 | ||
| post5.4 | [-] | 1.79 | 1.71 | 0.883 | 0.118 | 0.000219 | 0.352 | 0.678 | 2.17 | 0.269 | 0.125 | 0.657 | 0.837 | 0.403 |
Download Data |
Period Mean (original grids) [Pg yr-1] |
Model Period Mean (intersection) [Pg yr-1] |
Benchmark Period Mean (intersection) [Pg yr-1] |
Model Period Mean (complement) [Pg yr-1] |
Benchmark Period Mean (complement) [Pg yr-1] |
Bias [g m-2 d-1] |
RMSE [g m-2 d-1] |
Phase Shift [months] |
Bias Score [1] |
RMSE Score [1] |
Seasonal Cycle Score [1] |
Spatial Distribution Score [1] |
Overall Score [1] |
|||
|---|---|---|---|---|---|---|---|---|---|---|---|---|---|---|---|---|
| Benchmark | [-] | 1.56 | ||||||||||||||
| I123 | [-] | 2.03 | 1.92 | 1.56 | 0.0716 | 0.239 | 0.955 | 0.682 | 0.584 | 0.369 | 0.912 | 0.799 | 0.607 | |||
| post5.4 | [-] | 2.45 | 2.33 | 1.57 | 0.0899 | 0.426 | 1.18 | 0.678 | 0.515 | 0.324 | 0.923 | 0.697 | 0.557 |
Download Data |
Period Mean (original grids) [Pg yr-1] |
Model Period Mean (intersection) [Pg yr-1] |
Benchmark Period Mean (intersection) [Pg yr-1] |
Model Period Mean (complement) [Pg yr-1] |
Benchmark Period Mean (complement) [Pg yr-1] |
Bias [g m-2 d-1] |
RMSE [g m-2 d-1] |
Phase Shift [months] |
Bias Score [1] |
RMSE Score [1] |
Seasonal Cycle Score [1] |
Spatial Distribution Score [1] |
Overall Score [1] |
|||
|---|---|---|---|---|---|---|---|---|---|---|---|---|---|---|---|---|
| Benchmark | [-] | 3.62 | ||||||||||||||
| I123 | [-] | 3.50 | 2.86 | 3.62 | 0.534 | 0.00725 | 0.246 | 1.61 | 1.09 | 0.392 | 0.417 | 0.869 | 0.949 | 0.609 | ||
| post5.4 | [-] | 3.66 | 2.99 | 3.62 | 0.555 | 0.00725 | 0.404 | 1.63 | 1.17 | 0.405 | 0.412 | 0.860 | 0.947 | 0.607 |
Download Data |
Period Mean (original grids) [Pg yr-1] |
Model Period Mean (intersection) [Pg yr-1] |
Benchmark Period Mean (intersection) [Pg yr-1] |
Model Period Mean (complement) [Pg yr-1] |
Benchmark Period Mean (complement) [Pg yr-1] |
Bias [g m-2 d-1] |
RMSE [g m-2 d-1] |
Phase Shift [months] |
Bias Score [1] |
RMSE Score [1] |
Seasonal Cycle Score [1] |
Spatial Distribution Score [1] |
Overall Score [1] |
|||
|---|---|---|---|---|---|---|---|---|---|---|---|---|---|---|---|---|
| Benchmark | [-] | 5.09 | ||||||||||||||
| I123 | [-] | 4.70 | 4.47 | 5.09 | 0.147 | 1.98e-05 | -0.284 | 1.35 | 0.456 | 0.768 | 0.664 | 0.968 | 0.898 | 0.792 | ||
| post5.4 | [-] | 4.80 | 4.55 | 5.10 | 0.159 | 1.97e-05 | -0.221 | 1.50 | 0.723 | 0.786 | 0.626 | 0.949 | 0.980 | 0.793 |
Download Data |
Period Mean (original grids) [Pg yr-1] |
Model Period Mean (intersection) [Pg yr-1] |
Benchmark Period Mean (intersection) [Pg yr-1] |
Model Period Mean (complement) [Pg yr-1] |
Benchmark Period Mean (complement) [Pg yr-1] |
Bias [g m-2 d-1] |
RMSE [g m-2 d-1] |
Phase Shift [months] |
Bias Score [1] |
RMSE Score [1] |
Seasonal Cycle Score [1] |
Spatial Distribution Score [1] |
Overall Score [1] |
|||
|---|---|---|---|---|---|---|---|---|---|---|---|---|---|---|---|---|
| Benchmark | [-] | 3.36 | ||||||||||||||
| I123 | [-] | 3.35 | 3.30 | 3.36 | 0.0800 | 0.0820 | 0.976 | 0.481 | 0.729 | 0.628 | 0.968 | 0.966 | 0.784 | |||
| post5.4 | [-] | 3.60 | 3.56 | 3.36 | 0.0887 | 0.222 | 1.10 | 0.780 | 0.718 | 0.597 | 0.948 | 0.958 | 0.764 |
Download Data |
Period Mean (original grids) [Pg yr-1] |
Model Period Mean (intersection) [Pg yr-1] |
Benchmark Period Mean (intersection) [Pg yr-1] |
Model Period Mean (complement) [Pg yr-1] |
Benchmark Period Mean (complement) [Pg yr-1] |
Bias [g m-2 d-1] |
RMSE [g m-2 d-1] |
Phase Shift [months] |
Bias Score [1] |
RMSE Score [1] |
Seasonal Cycle Score [1] |
Spatial Distribution Score [1] |
Overall Score [1] |
|||
|---|---|---|---|---|---|---|---|---|---|---|---|---|---|---|---|---|
| Benchmark | [-] | 1.79 | ||||||||||||||
| I123 | [-] | 1.76 | 1.83 | 1.79 | 0.0261 | 0.0972 | 0.817 | 0.666 | 0.576 | 0.507 | 0.935 | 0.957 | 0.696 | |||
| post5.4 | [-] | 1.79 | 1.86 | 1.81 | 0.0268 | 0.112 | 0.830 | 0.743 | 0.578 | 0.510 | 0.926 | 0.957 | 0.696 |
Download Data |
Period Mean (original grids) [Pg yr-1] |
Model Period Mean (intersection) [Pg yr-1] |
Benchmark Period Mean (intersection) [Pg yr-1] |
Model Period Mean (complement) [Pg yr-1] |
Benchmark Period Mean (complement) [Pg yr-1] |
Bias [g m-2 d-1] |
RMSE [g m-2 d-1] |
Phase Shift [months] |
Bias Score [1] |
RMSE Score [1] |
Seasonal Cycle Score [1] |
Spatial Distribution Score [1] |
Overall Score [1] |
|||
|---|---|---|---|---|---|---|---|---|---|---|---|---|---|---|---|---|
| Benchmark | [-] | 23.2 | ||||||||||||||
| I123 | [-] | 22.9 | 22.5 | 23.2 | 0.251 | -0.00288 | 1.17 | 2.57 | 0.300 | 0.416 | 0.593 | 0.775 | 0.500 | |||
| post5.4 | [-] | 23.0 | 22.7 | 23.2 | 0.254 | 0.0400 | 1.24 | 2.44 | 0.287 | 0.391 | 0.605 | 0.773 | 0.490 |
Download Data |
Period Mean (original grids) [Pg yr-1] |
Model Period Mean (intersection) [Pg yr-1] |
Benchmark Period Mean (intersection) [Pg yr-1] |
Model Period Mean (complement) [Pg yr-1] |
Benchmark Period Mean (complement) [Pg yr-1] |
Bias [g m-2 d-1] |
RMSE [g m-2 d-1] |
Phase Shift [months] |
Bias Score [1] |
RMSE Score [1] |
Seasonal Cycle Score [1] |
Spatial Distribution Score [1] |
Overall Score [1] |
|||
|---|---|---|---|---|---|---|---|---|---|---|---|---|---|---|---|---|
| Benchmark | [-] | 10.4 | ||||||||||||||
| I123 | [-] | 9.86 | 9.69 | 10.4 | 0.324 | 0.000470 | -0.203 | 1.55 | 0.822 | 0.544 | 0.621 | 0.922 | 0.918 | 0.725 | ||
| post5.4 | [-] | 10.4 | 10.2 | 10.4 | 0.333 | 0.000469 | 0.0286 | 1.56 | 0.847 | 0.548 | 0.614 | 0.916 | 0.929 | 0.724 |
Download Data |
Period Mean (original grids) [Pg yr-1] |
Model Period Mean (intersection) [Pg yr-1] |
Benchmark Period Mean (intersection) [Pg yr-1] |
Model Period Mean (complement) [Pg yr-1] |
Benchmark Period Mean (complement) [Pg yr-1] |
Bias [g m-2 d-1] |
RMSE [g m-2 d-1] |
Phase Shift [months] |
Bias Score [1] |
RMSE Score [1] |
Seasonal Cycle Score [1] |
Spatial Distribution Score [1] |
Overall Score [1] |
|||
|---|---|---|---|---|---|---|---|---|---|---|---|---|---|---|---|---|
| Benchmark | [-] | 1.16 | ||||||||||||||
| I123 | [-] | 1.53 | 1.39 | 1.16 | 0.0963 | 0.000228 | 0.381 | 1.01 | 1.37 | 0.314 | 0.297 | 0.814 | 0.896 | 0.524 | ||
| post5.4 | [-] | 1.65 | 1.48 | 1.16 | 0.104 | 0.000229 | 0.474 | 1.09 | 1.35 | 0.292 | 0.285 | 0.815 | 0.895 | 0.514 |
Temporally integrated period mean