Mean State
Download Data |
Period Mean (original grids) [Tg yr-1] |
Model Period Mean (intersection) [Tg yr-1] |
Benchmark Period Mean (intersection) [Tg yr-1] |
Model Period Mean (complement) [Tg yr-1] |
Benchmark Period Mean (complement) [Tg yr-1] |
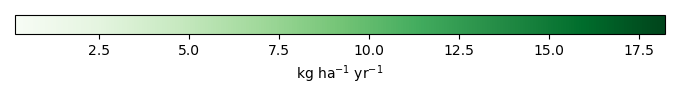
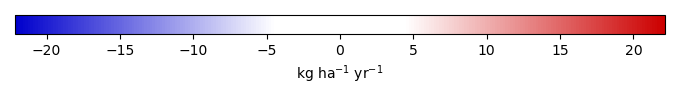
Bias [kg ha-1 yr-1] |
Bias Score [1] |
Spatial Distribution Score [1] |
Overall Score [1] |
|||
|---|---|---|---|---|---|---|---|---|---|---|---|---|
| Benchmark | [-] | 3.47 | ||||||||||
| I123 | [-] | 4.64 | 5.10 | 3.54 | 0.0804 | 3.86 | 0.413 | 0.598 | 0.506 | |||
| post5.4 | [-] | 3.76 | 4.18 | 3.54 | 0.0727 | 1.78 | 0.572 | 0.673 | 0.623 |
Download Data |
Period Mean (original grids) [Tg yr-1] |
Model Period Mean (intersection) [Tg yr-1] |
Benchmark Period Mean (intersection) [Tg yr-1] |
Model Period Mean (complement) [Tg yr-1] |
Benchmark Period Mean (complement) [Tg yr-1] |
Bias [kg ha-1 yr-1] |
Bias Score [1] |
Spatial Distribution Score [1] |
Overall Score [1] |
|||
|---|---|---|---|---|---|---|---|---|---|---|---|---|
| Benchmark | [-] | 5.23 | ||||||||||
| I123 | [-] | 6.09 | 5.45 | 5.20 | 0.0332 | 0.000959 | 0.530 | 0.189 | 0.658 | 0.424 | ||
| post5.4 | [-] | 5.90 | 5.30 | 5.20 | 0.0319 | 0.000959 | 0.298 | 0.191 | 0.674 | 0.432 |
Download Data |
Period Mean (original grids) [Tg yr-1] |
Model Period Mean (intersection) [Tg yr-1] |
Benchmark Period Mean (intersection) [Tg yr-1] |
Model Period Mean (complement) [Tg yr-1] |
Benchmark Period Mean (complement) [Tg yr-1] |
Bias [kg ha-1 yr-1] |
Bias Score [1] |
Spatial Distribution Score [1] |
Overall Score [1] |
|||
|---|---|---|---|---|---|---|---|---|---|---|---|---|
| Benchmark | [-] | 4.53 | ||||||||||
| I123 | [-] | 12.3 | 11.7 | 4.47 | 0.649 | 0.000112 | 8.53 | 0.185 | 0.468 | 0.327 | ||
| post5.4 | [-] | 11.6 | 11.1 | 4.47 | 0.606 | 0.000112 | 7.79 | 0.193 | 0.497 | 0.345 |
Download Data |
Period Mean (original grids) [Tg yr-1] |
Model Period Mean (intersection) [Tg yr-1] |
Benchmark Period Mean (intersection) [Tg yr-1] |
Model Period Mean (complement) [Tg yr-1] |
Benchmark Period Mean (complement) [Tg yr-1] |
Bias [kg ha-1 yr-1] |
Bias Score [1] |
Spatial Distribution Score [1] |
Overall Score [1] |
|||
|---|---|---|---|---|---|---|---|---|---|---|---|---|
| Benchmark | [-] | 1.06 | ||||||||||
| I123 | [-] | 0.832 | 0.776 | 1.08 | 0.0558 | -0.785 | 0.582 | 0.861 | 0.722 | |||
| post5.4 | [-] | 1.19 | 1.11 | 1.08 | 0.0819 | 0.437 | 0.508 | 0.865 | 0.686 |
Download Data |
Period Mean (original grids) [Tg yr-1] |
Model Period Mean (intersection) [Tg yr-1] |
Benchmark Period Mean (intersection) [Tg yr-1] |
Model Period Mean (complement) [Tg yr-1] |
Benchmark Period Mean (complement) [Tg yr-1] |
Bias [kg ha-1 yr-1] |
Bias Score [1] |
Spatial Distribution Score [1] |
Overall Score [1] |
|||
|---|---|---|---|---|---|---|---|---|---|---|---|---|
| Benchmark | [-] | 2.20 | ||||||||||
| I123 | [-] | 3.82 | 2.78 | 2.21 | 1.03 | 0.00166 | 5.94 | 0.351 | 0.499 | 0.425 | ||
| post5.4 | [-] | 2.65 | 1.89 | 2.21 | 0.749 | 0.00166 | 1.27 | 0.763 | 0.845 | 0.804 |
Download Data |
Period Mean (original grids) [Tg yr-1] |
Model Period Mean (intersection) [Tg yr-1] |
Benchmark Period Mean (intersection) [Tg yr-1] |
Model Period Mean (complement) [Tg yr-1] |
Benchmark Period Mean (complement) [Tg yr-1] |
Bias [kg ha-1 yr-1] |
Bias Score [1] |
Spatial Distribution Score [1] |
Overall Score [1] |
|||
|---|---|---|---|---|---|---|---|---|---|---|---|---|
| Benchmark | [-] | 6.28 | ||||||||||
| I123 | [-] | 4.64 | 4.36 | 6.41 | 0.119 | -2.27 | 0.418 | 0.759 | 0.588 | |||
| post5.4 | [-] | 4.46 | 4.18 | 6.41 | 0.114 | -2.48 | 0.384 | 0.720 | 0.552 |
Download Data |
Period Mean (original grids) [Tg yr-1] |
Model Period Mean (intersection) [Tg yr-1] |
Benchmark Period Mean (intersection) [Tg yr-1] |
Model Period Mean (complement) [Tg yr-1] |
Benchmark Period Mean (complement) [Tg yr-1] |
Bias [kg ha-1 yr-1] |
Bias Score [1] |
Spatial Distribution Score [1] |
Overall Score [1] |
|||
|---|---|---|---|---|---|---|---|---|---|---|---|---|
| Benchmark | [-] | 17.5 | ||||||||||
| I123 | [-] | 8.48 | 8.06 | 17.4 | 0.446 | -5.03 | 0.369 | 0.827 | 0.598 | |||
| post5.4 | [-] | 7.22 | 6.90 | 17.4 | 0.364 | -5.73 | 0.347 | 0.720 | 0.533 |
Download Data |
Period Mean (original grids) [Tg yr-1] |
Model Period Mean (intersection) [Tg yr-1] |
Benchmark Period Mean (intersection) [Tg yr-1] |
Model Period Mean (complement) [Tg yr-1] |
Benchmark Period Mean (complement) [Tg yr-1] |
Bias [kg ha-1 yr-1] |
Bias Score [1] |
Spatial Distribution Score [1] |
Overall Score [1] |
|||
|---|---|---|---|---|---|---|---|---|---|---|---|---|
| Benchmark | [-] | 6.61 | ||||||||||
| I123 | [-] | 5.62 | 5.14 | 6.60 | 0.521 | 0.000314 | -1.53 | 0.405 | 0.851 | 0.628 | ||
| post5.4 | [-] | 4.98 | 4.57 | 6.60 | 0.443 | 0.000314 | -2.49 | 0.435 | 0.907 | 0.671 |
Download Data |
Period Mean (original grids) [Tg yr-1] |
Model Period Mean (intersection) [Tg yr-1] |
Benchmark Period Mean (intersection) [Tg yr-1] |
Model Period Mean (complement) [Tg yr-1] |
Benchmark Period Mean (complement) [Tg yr-1] |
Bias [kg ha-1 yr-1] |
Bias Score [1] |
Spatial Distribution Score [1] |
Overall Score [1] |
|||
|---|---|---|---|---|---|---|---|---|---|---|---|---|
| Benchmark | [-] | 1.30 | ||||||||||
| I123 | [-] | 1.09 | 1.04 | 1.35 | 0.0607 | -0.875 | 0.508 | 0.725 | 0.617 | |||
| post5.4 | [-] | 1.23 | 1.18 | 1.35 | 0.0687 | -0.432 | 0.480 | 0.771 | 0.625 |
Download Data |
Period Mean (original grids) [Tg yr-1] |
Model Period Mean (intersection) [Tg yr-1] |
Benchmark Period Mean (intersection) [Tg yr-1] |
Model Period Mean (complement) [Tg yr-1] |
Benchmark Period Mean (complement) [Tg yr-1] |
Bias [kg ha-1 yr-1] |
Bias Score [1] |
Spatial Distribution Score [1] |
Overall Score [1] |
|||
|---|---|---|---|---|---|---|---|---|---|---|---|---|
| Benchmark | [-] | 3.77 | ||||||||||
| I123 | [-] | 4.12 | 3.44 | 3.77 | 0.686 | 0.00216 | 0.0939 | 0.446 | 0.895 | 0.670 | ||
| post5.4 | [-] | 4.08 | 3.42 | 3.77 | 0.659 | 0.00216 | 0.0447 | 0.470 | 0.895 | 0.682 |
Download Data |
Period Mean (original grids) [Tg yr-1] |
Model Period Mean (intersection) [Tg yr-1] |
Benchmark Period Mean (intersection) [Tg yr-1] |
Model Period Mean (complement) [Tg yr-1] |
Benchmark Period Mean (complement) [Tg yr-1] |
Bias [kg ha-1 yr-1] |
Bias Score [1] |
Spatial Distribution Score [1] |
Overall Score [1] |
|||
|---|---|---|---|---|---|---|---|---|---|---|---|---|
| Benchmark | [-] | 4.91 | ||||||||||
| I123 | [-] | 3.52 | 3.04 | 4.89 | 0.424 | 0.00238 | -3.04 | 0.436 | 0.905 | 0.670 | ||
| post5.4 | [-] | 3.41 | 2.94 | 4.89 | 0.413 | 0.00238 | -3.28 | 0.433 | 0.839 | 0.636 |
Download Data |
Period Mean (original grids) [Tg yr-1] |
Model Period Mean (intersection) [Tg yr-1] |
Benchmark Period Mean (intersection) [Tg yr-1] |
Model Period Mean (complement) [Tg yr-1] |
Benchmark Period Mean (complement) [Tg yr-1] |
Bias [kg ha-1 yr-1] |
Bias Score [1] |
Spatial Distribution Score [1] |
Overall Score [1] |
|||
|---|---|---|---|---|---|---|---|---|---|---|---|---|
| Benchmark | [-] | 88.2 | ||||||||||
| I123 | [-] | 96.7 | 89.7 | 88.2 | 6.73 | 0.00803 | 0.487 | 0.407 | 0.747 | 0.577 | ||
| post5.4 | [-] | 85.5 | 79.3 | 88.2 | 5.95 | 0.00803 | -0.368 | 0.447 | 0.800 | 0.623 |
Download Data |
Period Mean (original grids) [Tg yr-1] |
Model Period Mean (intersection) [Tg yr-1] |
Benchmark Period Mean (intersection) [Tg yr-1] |
Model Period Mean (complement) [Tg yr-1] |
Benchmark Period Mean (complement) [Tg yr-1] |
Bias [kg ha-1 yr-1] |
Bias Score [1] |
Spatial Distribution Score [1] |
Overall Score [1] |
|||
|---|---|---|---|---|---|---|---|---|---|---|---|---|
| Benchmark | [-] | 3.41 | ||||||||||
| I123 | [-] | 2.35 | 2.12 | 3.41 | 0.248 | -0.689 | 0.765 | 0.690 | 0.728 | |||
| post5.4 | [-] | 2.12 | 1.92 | 3.41 | 0.218 | -0.823 | 0.773 | 0.626 | 0.699 |
Download Data |
Period Mean (original grids) [Tg yr-1] |
Model Period Mean (intersection) [Tg yr-1] |
Benchmark Period Mean (intersection) [Tg yr-1] |
Model Period Mean (complement) [Tg yr-1] |
Benchmark Period Mean (complement) [Tg yr-1] |
Bias [kg ha-1 yr-1] |
Bias Score [1] |
Spatial Distribution Score [1] |
Overall Score [1] |
|||
|---|---|---|---|---|---|---|---|---|---|---|---|---|
| Benchmark | [-] | 3.56 | ||||||||||
| I123 | [-] | 1.85 | 1.58 | 3.61 | 0.235 | -3.61 | 0.353 | 0.464 | 0.408 | |||
| post5.4 | [-] | 2.05 | 1.76 | 3.61 | 0.262 | -3.25 | 0.350 | 0.504 | 0.427 |
Download Data |
Period Mean (original grids) [Tg yr-1] |
Model Period Mean (intersection) [Tg yr-1] |
Benchmark Period Mean (intersection) [Tg yr-1] |
Model Period Mean (complement) [Tg yr-1] |
Benchmark Period Mean (complement) [Tg yr-1] |
Bias [kg ha-1 yr-1] |
Bias Score [1] |
Spatial Distribution Score [1] |
Overall Score [1] |
|||
|---|---|---|---|---|---|---|---|---|---|---|---|---|
| Benchmark | [-] | 1.98 | ||||||||||
| I123 | [-] | 2.83 | 2.23 | 1.98 | 0.553 | 0.000448 | 2.79 | 0.416 | 0.751 | 0.584 | ||
| post5.4 | [-] | 2.61 | 2.10 | 1.98 | 0.471 | 0.000448 | 2.02 | 0.451 | 0.840 | 0.645 |
Download Data |
Period Mean (original grids) [Tg yr-1] |
Model Period Mean (intersection) [Tg yr-1] |
Benchmark Period Mean (intersection) [Tg yr-1] |
Model Period Mean (complement) [Tg yr-1] |
Benchmark Period Mean (complement) [Tg yr-1] |
Bias [kg ha-1 yr-1] |
Bias Score [1] |
Spatial Distribution Score [1] |
Overall Score [1] |
|||
|---|---|---|---|---|---|---|---|---|---|---|---|---|
| Benchmark | [-] | 4.09 | ||||||||||
| I123 | [-] | 6.92 | 6.41 | 4.06 | 0.363 | 6.70 | 0.283 | 0.299 | 0.291 | |||
| post5.4 | [-] | 4.82 | 4.45 | 4.06 | 0.290 | 1.43 | 0.380 | 0.589 | 0.485 |
Download Data |
Period Mean (original grids) [Tg yr-1] |
Model Period Mean (intersection) [Tg yr-1] |
Benchmark Period Mean (intersection) [Tg yr-1] |
Model Period Mean (complement) [Tg yr-1] |
Benchmark Period Mean (complement) [Tg yr-1] |
Bias [kg ha-1 yr-1] |
Bias Score [1] |
Spatial Distribution Score [1] |
Overall Score [1] |
|||
|---|---|---|---|---|---|---|---|---|---|---|---|---|
| Benchmark | [-] | 2.46 | ||||||||||
| I123 | [-] | 2.66 | 2.38 | 2.49 | 0.308 | -0.0496 | 0.444 | 0.556 | 0.500 | |||
| post5.4 | [-] | 2.43 | 2.15 | 2.49 | 0.283 | -0.501 | 0.452 | 0.376 | 0.414 |
Download Data |
Period Mean (original grids) [Tg yr-1] |
Model Period Mean (intersection) [Tg yr-1] |
Benchmark Period Mean (intersection) [Tg yr-1] |
Model Period Mean (complement) [Tg yr-1] |
Benchmark Period Mean (complement) [Tg yr-1] |
Bias [kg ha-1 yr-1] |
Bias Score [1] |
Spatial Distribution Score [1] |
Overall Score [1] |
|||
|---|---|---|---|---|---|---|---|---|---|---|---|---|
| Benchmark | [-] | 3.85 | ||||||||||
| I123 | [-] | 1.66 | 1.78 | 3.82 | 0.0276 | -4.92 | 0.265 | 0.768 | 0.516 | |||
| post5.4 | [-] | 1.58 | 1.65 | 3.82 | 0.0201 | -5.32 | 0.269 | 0.563 | 0.416 |
Download Data |
Period Mean (original grids) [Tg yr-1] |
Model Period Mean (intersection) [Tg yr-1] |
Benchmark Period Mean (intersection) [Tg yr-1] |
Model Period Mean (complement) [Tg yr-1] |
Benchmark Period Mean (complement) [Tg yr-1] |
Bias [kg ha-1 yr-1] |
Bias Score [1] |
Spatial Distribution Score [1] |
Overall Score [1] |
|||
|---|---|---|---|---|---|---|---|---|---|---|---|---|
| Benchmark | [-] | 6.52 | ||||||||||
| I123 | [-] | 12.3 | 11.8 | 6.58 | 0.433 | 6.65 | 0.278 | 0.961 | 0.619 | |||
| post5.4 | [-] | 8.87 | 8.46 | 6.58 | 0.355 | 2.48 | 0.680 | 0.788 | 0.734 |
Download Data |
Period Mean (original grids) [Tg yr-1] |
Model Period Mean (intersection) [Tg yr-1] |
Benchmark Period Mean (intersection) [Tg yr-1] |
Model Period Mean (complement) [Tg yr-1] |
Benchmark Period Mean (complement) [Tg yr-1] |
Bias [kg ha-1 yr-1] |
Bias Score [1] |
Spatial Distribution Score [1] |
Overall Score [1] |
|||
|---|---|---|---|---|---|---|---|---|---|---|---|---|
| Benchmark | [-] | 3.44 | ||||||||||
| I123 | [-] | 8.89 | 8.71 | 3.43 | 0.230 | 8.51 | 0.224 | 0.720 | 0.472 | |||
| post5.4 | [-] | 8.42 | 8.25 | 3.43 | 0.230 | 7.78 | 0.247 | 0.761 | 0.504 |
Download Data |
Period Mean (original grids) [Tg yr-1] |
Model Period Mean (intersection) [Tg yr-1] |
Benchmark Period Mean (intersection) [Tg yr-1] |
Model Period Mean (complement) [Tg yr-1] |
Benchmark Period Mean (complement) [Tg yr-1] |
Bias [kg ha-1 yr-1] |
Bias Score [1] |
Spatial Distribution Score [1] |
Overall Score [1] |
|||
|---|---|---|---|---|---|---|---|---|---|---|---|---|
| Benchmark | [-] | 1.80 | ||||||||||
| I123 | [-] | 2.02 | 1.83 | 1.75 | 0.197 | 4.31e-06 | 0.764 | 0.557 | 0.826 | 0.692 | ||
| post5.4 | [-] | 2.00 | 1.81 | 1.75 | 0.188 | 4.31e-06 | 0.660 | 0.554 | 0.826 | 0.690 |
Temporally integrated period mean