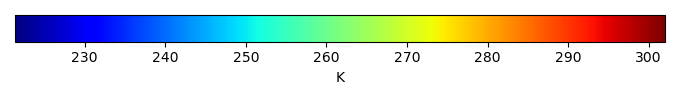
Mean State
Download Data |
Period Mean (original grids) [K] |
Model Period Mean (intersection) [K] |
Benchmark Period Mean (intersection) [K] |
Model Period Mean (complement) [K] |
Benchmark Period Mean (complement) [K] |
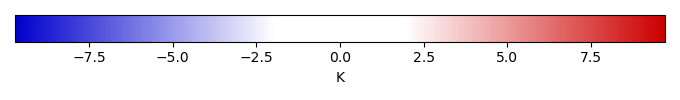
Bias [K] |
RMSE [K] |
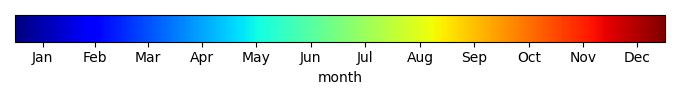
Phase Shift [months] |
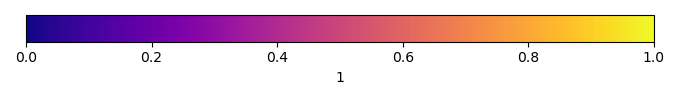
Bias Score [1] |
RMSE Score [1] |
Seasonal Cycle Score [1] |
Spatial Distribution Score [1] |
Overall Score [1] |
|||
|---|---|---|---|---|---|---|---|---|---|---|---|---|---|---|---|---|
| Benchmark | [-] | 298. | ||||||||||||||
| I123 | [-] | 297. | 297. | 298. | 300. | 300. | -0.894 | 1.29 | 0.738 | 0.367 | 0.676 | 0.924 | 0.992 | 0.727 | ||
| post5.4 | [-] | 298. | 298. | 299. | 300. | 300. | -0.577 | 1.15 | 0.726 | 0.409 | 0.666 | 0.930 | 0.991 | 0.733 |
Download Data |
Period Mean (original grids) [K] |
Model Period Mean (intersection) [K] |
Benchmark Period Mean (intersection) [K] |
Model Period Mean (complement) [K] |
Benchmark Period Mean (complement) [K] |
Bias [K] |
RMSE [K] |
Phase Shift [months] |
Bias Score [1] |
RMSE Score [1] |
Seasonal Cycle Score [1] |
Spatial Distribution Score [1] |
Overall Score [1] |
|||
|---|---|---|---|---|---|---|---|---|---|---|---|---|---|---|---|---|
| Benchmark | [-] | 300. | ||||||||||||||
| I123 | [-] | 299. | 299. | 300. | 300. | 299. | -0.961 | 1.58 | 0.485 | 0.618 | 0.671 | 0.965 | 0.958 | 0.777 | ||
| post5.4 | [-] | 300. | 300. | 300. | 301. | 299. | -0.342 | 1.21 | 0.441 | 0.732 | 0.690 | 0.968 | 0.972 | 0.810 |
Download Data |
Period Mean (original grids) [K] |
Model Period Mean (intersection) [K] |
Benchmark Period Mean (intersection) [K] |
Model Period Mean (complement) [K] |
Benchmark Period Mean (complement) [K] |
Bias [K] |
RMSE [K] |
Phase Shift [months] |
Bias Score [1] |
RMSE Score [1] |
Seasonal Cycle Score [1] |
Spatial Distribution Score [1] |
Overall Score [1] |
|||
|---|---|---|---|---|---|---|---|---|---|---|---|---|---|---|---|---|
| Benchmark | [-] | 295. | ||||||||||||||
| I123 | [-] | 294. | 294. | 295. | 296. | 299. | -0.883 | 1.32 | 0.581 | 0.614 | 0.765 | 0.927 | 0.999 | 0.814 | ||
| post5.4 | [-] | 295. | 295. | 295. | 296. | 299. | -0.283 | 1.04 | 0.477 | 0.682 | 0.762 | 0.943 | 0.998 | 0.829 |
Download Data |
Period Mean (original grids) [K] |
Model Period Mean (intersection) [K] |
Benchmark Period Mean (intersection) [K] |
Model Period Mean (complement) [K] |
Benchmark Period Mean (complement) [K] |
Bias [K] |
RMSE [K] |
Phase Shift [months] |
Bias Score [1] |
RMSE Score [1] |
Seasonal Cycle Score [1] |
Spatial Distribution Score [1] |
Overall Score [1] |
|||
|---|---|---|---|---|---|---|---|---|---|---|---|---|---|---|---|---|
| Benchmark | [-] | 262. | ||||||||||||||
| I123 | [-] | 259. | 259. | 262. | 263. | -2.56 | 3.37 | 0.0158 | 0.838 | 0.882 | 0.999 | 0.985 | 0.917 | |||
| post5.4 | [-] | 261. | 261. | 262. | 265. | -1.10 | 2.32 | 0.0189 | 0.906 | 0.897 | 0.999 | 0.988 | 0.938 |
Download Data |
Period Mean (original grids) [K] |
Model Period Mean (intersection) [K] |
Benchmark Period Mean (intersection) [K] |
Model Period Mean (complement) [K] |
Benchmark Period Mean (complement) [K] |
Bias [K] |
RMSE [K] |
Phase Shift [months] |
Bias Score [1] |
RMSE Score [1] |
Seasonal Cycle Score [1] |
Spatial Distribution Score [1] |
Overall Score [1] |
|||
|---|---|---|---|---|---|---|---|---|---|---|---|---|---|---|---|---|
| Benchmark | [-] | 299. | ||||||||||||||
| I123 | [-] | 298. | 298. | 299. | 299. | 300. | -0.868 | 1.20 | 1.65 | 0.243 | 0.623 | 0.740 | 1.00 | 0.646 | ||
| post5.4 | [-] | 298. | 298. | 299. | 299. | 300. | -0.607 | 1.05 | 1.14 | 0.292 | 0.666 | 0.835 | 0.996 | 0.691 |
Download Data |
Period Mean (original grids) [K] |
Model Period Mean (intersection) [K] |
Benchmark Period Mean (intersection) [K] |
Model Period Mean (complement) [K] |
Benchmark Period Mean (complement) [K] |
Bias [K] |
RMSE [K] |
Phase Shift [months] |
Bias Score [1] |
RMSE Score [1] |
Seasonal Cycle Score [1] |
Spatial Distribution Score [1] |
Overall Score [1] |
|||
|---|---|---|---|---|---|---|---|---|---|---|---|---|---|---|---|---|
| Benchmark | [-] | 271. | ||||||||||||||
| I123 | [-] | 269. | 269. | 271. | 272. | 275. | -2.61 | 3.08 | 0.00660 | 0.829 | 0.898 | 1.00 | 0.997 | 0.924 | ||
| post5.4 | [-] | 270. | 270. | 272. | 273. | 275. | -1.37 | 1.77 | 0.0161 | 0.902 | 0.936 | 0.999 | 0.999 | 0.954 |
Download Data |
Period Mean (original grids) [K] |
Model Period Mean (intersection) [K] |
Benchmark Period Mean (intersection) [K] |
Model Period Mean (complement) [K] |
Benchmark Period Mean (complement) [K] |
Bias [K] |
RMSE [K] |
Phase Shift [months] |
Bias Score [1] |
RMSE Score [1] |
Seasonal Cycle Score [1] |
Spatial Distribution Score [1] |
Overall Score [1] |
|||
|---|---|---|---|---|---|---|---|---|---|---|---|---|---|---|---|---|
| Benchmark | [-] | 281. | ||||||||||||||
| I123 | [-] | 279. | 279. | 281. | 286. | 288. | -1.40 | 2.07 | 0.0362 | 0.837 | 0.922 | 0.997 | 0.999 | 0.936 | ||
| post5.4 | [-] | 280. | 280. | 281. | 287. | 288. | -0.557 | 1.49 | 0.0438 | 0.877 | 0.937 | 0.997 | 1.00 | 0.949 |
Download Data |
Period Mean (original grids) [K] |
Model Period Mean (intersection) [K] |
Benchmark Period Mean (intersection) [K] |
Model Period Mean (complement) [K] |
Benchmark Period Mean (complement) [K] |
Bias [K] |
RMSE [K] |
Phase Shift [months] |
Bias Score [1] |
RMSE Score [1] |
Seasonal Cycle Score [1] |
Spatial Distribution Score [1] |
Overall Score [1] |
|||
|---|---|---|---|---|---|---|---|---|---|---|---|---|---|---|---|---|
| Benchmark | [-] | 297. | ||||||||||||||
| I123 | [-] | 296. | 296. | 297. | 299. | 299. | -0.926 | 1.57 | 0.275 | 0.699 | 0.813 | 0.976 | 0.995 | 0.859 | ||
| post5.4 | [-] | 296. | 296. | 297. | 300. | 299. | -0.493 | 1.31 | 0.228 | 0.738 | 0.848 | 0.979 | 0.994 | 0.881 |
Download Data |
Period Mean (original grids) [K] |
Model Period Mean (intersection) [K] |
Benchmark Period Mean (intersection) [K] |
Model Period Mean (complement) [K] |
Benchmark Period Mean (complement) [K] |
Bias [K] |
RMSE [K] |
Phase Shift [months] |
Bias Score [1] |
RMSE Score [1] |
Seasonal Cycle Score [1] |
Spatial Distribution Score [1] |
Overall Score [1] |
|||
|---|---|---|---|---|---|---|---|---|---|---|---|---|---|---|---|---|
| Benchmark | [-] | 264. | ||||||||||||||
| I123 | [-] | 261. | 261. | 264. | 262. | 269. | -2.97 | 3.57 | 0.0317 | 0.818 | 0.880 | 0.998 | 0.999 | 0.915 | ||
| post5.4 | [-] | 263. | 263. | 264. | 264. | 269. | -1.51 | 2.12 | 0.00916 | 0.900 | 0.918 | 0.999 | 0.999 | 0.947 |
Download Data |
Period Mean (original grids) [K] |
Model Period Mean (intersection) [K] |
Benchmark Period Mean (intersection) [K] |
Model Period Mean (complement) [K] |
Benchmark Period Mean (complement) [K] |
Bias [K] |
RMSE [K] |
Phase Shift [months] |
Bias Score [1] |
RMSE Score [1] |
Seasonal Cycle Score [1] |
Spatial Distribution Score [1] |
Overall Score [1] |
|||
|---|---|---|---|---|---|---|---|---|---|---|---|---|---|---|---|---|
| Benchmark | [-] | 295. | ||||||||||||||
| I123 | [-] | 294. | 294. | 295. | 291. | 294. | -0.916 | 1.18 | 0.118 | 0.814 | 0.896 | 0.992 | 1.00 | 0.919 | ||
| post5.4 | [-] | 295. | 295. | 295. | 292. | 294. | -0.184 | 0.715 | 0.0937 | 0.884 | 0.919 | 0.994 | 1.00 | 0.943 |
Download Data |
Period Mean (original grids) [K] |
Model Period Mean (intersection) [K] |
Benchmark Period Mean (intersection) [K] |
Model Period Mean (complement) [K] |
Benchmark Period Mean (complement) [K] |
Bias [K] |
RMSE [K] |
Phase Shift [months] |
Bias Score [1] |
RMSE Score [1] |
Seasonal Cycle Score [1] |
Spatial Distribution Score [1] |
Overall Score [1] |
|||
|---|---|---|---|---|---|---|---|---|---|---|---|---|---|---|---|---|
| Benchmark | [-] | 282. | ||||||||||||||
| I123 | [-] | 280. | 280. | 282. | 283. | 289. | -1.68 | 1.97 | 0.199 | 0.773 | 0.908 | 0.987 | 0.999 | 0.915 | ||
| post5.4 | [-] | 281. | 281. | 282. | 284. | 289. | -0.751 | 1.28 | 0.199 | 0.857 | 0.920 | 0.987 | 1.00 | 0.937 |
Download Data |
Period Mean (original grids) [K] |
Model Period Mean (intersection) [K] |
Benchmark Period Mean (intersection) [K] |
Model Period Mean (complement) [K] |
Benchmark Period Mean (complement) [K] |
Bias [K] |
RMSE [K] |
Phase Shift [months] |
Bias Score [1] |
RMSE Score [1] |
Seasonal Cycle Score [1] |
Spatial Distribution Score [1] |
Overall Score [1] |
|||
|---|---|---|---|---|---|---|---|---|---|---|---|---|---|---|---|---|
| Benchmark | [-] | 287. | ||||||||||||||
| I123 | [-] | 281. | 285. | 287. | 245. | 295. | -1.59 | 2.10 | 0.306 | 0.691 | 0.834 | 0.966 | 0.995 | 0.864 | ||
| post5.4 | [-] | 282. | 286. | 287. | 248. | 295. | -0.790 | 1.48 | 0.263 | 0.759 | 0.853 | 0.972 | 0.997 | 0.887 |
Download Data |
Period Mean (original grids) [K] |
Model Period Mean (intersection) [K] |
Benchmark Period Mean (intersection) [K] |
Model Period Mean (complement) [K] |
Benchmark Period Mean (complement) [K] |
Bias [K] |
RMSE [K] |
Phase Shift [months] |
Bias Score [1] |
RMSE Score [1] |
Seasonal Cycle Score [1] |
Spatial Distribution Score [1] |
Overall Score [1] |
|||
|---|---|---|---|---|---|---|---|---|---|---|---|---|---|---|---|---|
| Benchmark | [-] | 296. | ||||||||||||||
| I123 | [-] | 295. | 295. | 296. | 295. | 291. | -1.43 | 1.95 | 0.365 | 0.764 | 0.891 | 0.971 | 0.999 | 0.903 | ||
| post5.4 | [-] | 295. | 295. | 296. | 295. | 291. | -0.679 | 1.46 | 0.333 | 0.824 | 0.896 | 0.971 | 0.999 | 0.917 |
Download Data |
Period Mean (original grids) [K] |
Model Period Mean (intersection) [K] |
Benchmark Period Mean (intersection) [K] |
Model Period Mean (complement) [K] |
Benchmark Period Mean (complement) [K] |
Bias [K] |
RMSE [K] |
Phase Shift [months] |
Bias Score [1] |
RMSE Score [1] |
Seasonal Cycle Score [1] |
Spatial Distribution Score [1] |
Overall Score [1] |
|||
|---|---|---|---|---|---|---|---|---|---|---|---|---|---|---|---|---|
| Benchmark | [-] | 265. | ||||||||||||||
| I123 | [-] | 262. | 262. | 265. | 261. | -2.81 | 3.47 | 0.0188 | 0.806 | 0.863 | 0.999 | 0.994 | 0.905 | |||
| post5.4 | [-] | 264. | 264. | 265. | 262. | -1.50 | 2.21 | 0.0126 | 0.886 | 0.894 | 0.999 | 0.995 | 0.934 |
Download Data |
Period Mean (original grids) [K] |
Model Period Mean (intersection) [K] |
Benchmark Period Mean (intersection) [K] |
Model Period Mean (complement) [K] |
Benchmark Period Mean (complement) [K] |
Bias [K] |
RMSE [K] |
Phase Shift [months] |
Bias Score [1] |
RMSE Score [1] |
Seasonal Cycle Score [1] |
Spatial Distribution Score [1] |
Overall Score [1] |
|||
|---|---|---|---|---|---|---|---|---|---|---|---|---|---|---|---|---|
| Benchmark | [-] | 296. | ||||||||||||||
| I123 | [-] | 294. | 294. | 296. | 297. | 299. | -1.05 | 1.65 | 0.237 | 0.573 | 0.836 | 0.982 | 0.999 | 0.845 | ||
| post5.4 | [-] | 295. | 295. | 296. | 298. | 299. | -0.387 | 1.36 | 0.272 | 0.628 | 0.840 | 0.978 | 0.997 | 0.857 |
Download Data |
Period Mean (original grids) [K] |
Model Period Mean (intersection) [K] |
Benchmark Period Mean (intersection) [K] |
Model Period Mean (complement) [K] |
Benchmark Period Mean (complement) [K] |
Bias [K] |
RMSE [K] |
Phase Shift [months] |
Bias Score [1] |
RMSE Score [1] |
Seasonal Cycle Score [1] |
Spatial Distribution Score [1] |
Overall Score [1] |
|||
|---|---|---|---|---|---|---|---|---|---|---|---|---|---|---|---|---|
| Benchmark | [-] | 286. | ||||||||||||||
| I123 | [-] | 285. | 285. | 286. | 291. | 295. | -1.41 | 1.58 | 0.0364 | 0.851 | 0.928 | 0.998 | 0.996 | 0.940 | ||
| post5.4 | [-] | 286. | 286. | 287. | 292. | 295. | -0.642 | 0.796 | 0.0440 | 0.916 | 0.966 | 0.997 | 1.00 | 0.969 |
Download Data |
Period Mean (original grids) [K] |
Model Period Mean (intersection) [K] |
Benchmark Period Mean (intersection) [K] |
Model Period Mean (complement) [K] |
Benchmark Period Mean (complement) [K] |
Bias [K] |
RMSE [K] |
Phase Shift [months] |
Bias Score [1] |
RMSE Score [1] |
Seasonal Cycle Score [1] |
Spatial Distribution Score [1] |
Overall Score [1] |
|||
|---|---|---|---|---|---|---|---|---|---|---|---|---|---|---|---|---|
| Benchmark | [-] | 275. | ||||||||||||||
| I123 | [-] | 272. | 272. | 275. | 276. | -2.21 | 2.65 | 0.0945 | 0.814 | 0.884 | 0.994 | 0.990 | 0.913 | |||
| post5.4 | [-] | 273. | 273. | 275. | 277. | -0.981 | 1.36 | 0.0777 | 0.900 | 0.932 | 0.995 | 0.997 | 0.951 |
Download Data |
Period Mean (original grids) [K] |
Model Period Mean (intersection) [K] |
Benchmark Period Mean (intersection) [K] |
Model Period Mean (complement) [K] |
Benchmark Period Mean (complement) [K] |
Bias [K] |
RMSE [K] |
Phase Shift [months] |
Bias Score [1] |
RMSE Score [1] |
Seasonal Cycle Score [1] |
Spatial Distribution Score [1] |
Overall Score [1] |
|||
|---|---|---|---|---|---|---|---|---|---|---|---|---|---|---|---|---|
| Benchmark | [-] | 284. | ||||||||||||||
| I123 | [-] | 282. | 282. | 284. | 285. | 285. | -1.64 | 2.13 | 0.0537 | 0.798 | 0.892 | 0.996 | 1.00 | 0.916 | ||
| post5.4 | [-] | 283. | 283. | 284. | 286. | 285. | -0.620 | 1.41 | 0.0470 | 0.863 | 0.915 | 0.997 | 0.999 | 0.938 |
Download Data |
Period Mean (original grids) [K] |
Model Period Mean (intersection) [K] |
Benchmark Period Mean (intersection) [K] |
Model Period Mean (complement) [K] |
Benchmark Period Mean (complement) [K] |
Bias [K] |
RMSE [K] |
Phase Shift [months] |
Bias Score [1] |
RMSE Score [1] |
Seasonal Cycle Score [1] |
Spatial Distribution Score [1] |
Overall Score [1] |
|||
|---|---|---|---|---|---|---|---|---|---|---|---|---|---|---|---|---|
| Benchmark | [-] | 299. | ||||||||||||||
| I123 | [-] | 298. | 298. | 299. | 299. | 301. | -1.40 | 1.69 | 1.01 | 0.210 | 0.651 | 0.852 | 0.995 | 0.672 | ||
| post5.4 | [-] | 298. | 298. | 299. | 300. | 301. | -0.903 | 1.31 | 0.763 | 0.310 | 0.683 | 0.897 | 0.991 | 0.713 |
Download Data |
Period Mean (original grids) [K] |
Model Period Mean (intersection) [K] |
Benchmark Period Mean (intersection) [K] |
Model Period Mean (complement) [K] |
Benchmark Period Mean (complement) [K] |
Bias [K] |
RMSE [K] |
Phase Shift [months] |
Bias Score [1] |
RMSE Score [1] |
Seasonal Cycle Score [1] |
Spatial Distribution Score [1] |
Overall Score [1] |
|||
|---|---|---|---|---|---|---|---|---|---|---|---|---|---|---|---|---|
| Benchmark | [-] | 296. | ||||||||||||||
| I123 | [-] | 295. | 295. | 296. | 295. | 288. | -1.08 | 1.31 | 0.391 | 0.599 | 0.807 | 0.961 | 1.00 | 0.835 | ||
| post5.4 | [-] | 296. | 295. | 296. | 295. | 288. | -0.488 | 0.906 | 0.446 | 0.719 | 0.816 | 0.950 | 1.00 | 0.860 |
Download Data |
Period Mean (original grids) [K] |
Model Period Mean (intersection) [K] |
Benchmark Period Mean (intersection) [K] |
Model Period Mean (complement) [K] |
Benchmark Period Mean (complement) [K] |
Bias [K] |
RMSE [K] |
Phase Shift [months] |
Bias Score [1] |
RMSE Score [1] |
Seasonal Cycle Score [1] |
Spatial Distribution Score [1] |
Overall Score [1] |
|||
|---|---|---|---|---|---|---|---|---|---|---|---|---|---|---|---|---|
| Benchmark | [-] | 284. | ||||||||||||||
| I123 | [-] | 284. | 283. | 284. | 288. | 287. | -0.448 | 1.83 | 0.383 | 0.628 | 0.806 | 0.954 | 0.993 | 0.837 | ||
| post5.4 | [-] | 284. | 284. | 284. | 288. | 287. | -0.0812 | 1.77 | 0.294 | 0.635 | 0.805 | 0.969 | 0.994 | 0.842 |
Temporally integrated period mean