Mean State
Download Data |
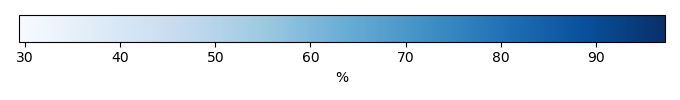
Period Mean (original grids) [%] |
Model Period Mean (intersection) [%] |
Benchmark Period Mean (intersection) [%] |
Model Period Mean (complement) [%] |
Benchmark Period Mean (complement) [%] |
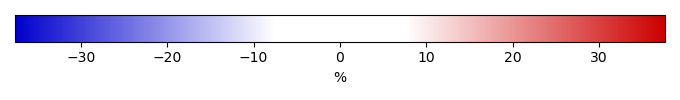
Bias [%] |
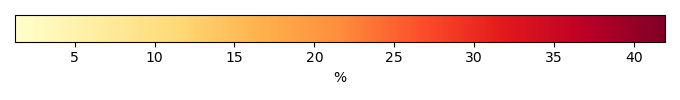
RMSE [%] |
Phase Shift [months] |
Bias Score [1] |
RMSE Score [1] |
Seasonal Cycle Score [1] |
Spatial Distribution Score [1] |
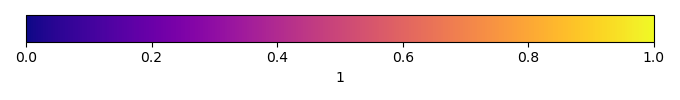
Overall Score [1] |
|||
|---|---|---|---|---|---|---|---|---|---|---|---|---|---|---|---|---|
| Benchmark | [-] | 75.1 | ||||||||||||||
| I123 | [-] | 76.1 | 76.1 | 74.8 | 94.4 | 1.89 | 6.09 | 1.59 | 0.360 | 0.623 | 0.761 | 0.991 | 0.671 | |||
| post5.4 | [-] | 76.3 | 76.3 | 74.6 | 94.4 | 2.17 | 6.41 | 1.42 | 0.342 | 0.611 | 0.796 | 0.987 | 0.669 |
Download Data |
Period Mean (original grids) [%] |
Model Period Mean (intersection) [%] |
Benchmark Period Mean (intersection) [%] |
Model Period Mean (complement) [%] |
Benchmark Period Mean (complement) [%] |
Bias [%] |
RMSE [%] |
Phase Shift [months] |
Bias Score [1] |
RMSE Score [1] |
Seasonal Cycle Score [1] |
Spatial Distribution Score [1] |
Overall Score [1] |
|||
|---|---|---|---|---|---|---|---|---|---|---|---|---|---|---|---|---|
| Benchmark | [-] | 53.2 | ||||||||||||||
| I123 | [-] | 54.1 | 53.7 | 53.0 | 93.1 | 0.989 | 6.00 | 0.254 | 0.777 | 0.774 | 0.973 | 0.979 | 0.855 | |||
| post5.4 | [-] | 54.4 | 54.0 | 53.2 | 93.0 | 1.13 | 5.80 | 0.239 | 0.782 | 0.783 | 0.973 | 0.974 | 0.859 |
Download Data |
Period Mean (original grids) [%] |
Model Period Mean (intersection) [%] |
Benchmark Period Mean (intersection) [%] |
Model Period Mean (complement) [%] |
Benchmark Period Mean (complement) [%] |
Bias [%] |
RMSE [%] |
Phase Shift [months] |
Bias Score [1] |
RMSE Score [1] |
Seasonal Cycle Score [1] |
Spatial Distribution Score [1] |
Overall Score [1] |
|||
|---|---|---|---|---|---|---|---|---|---|---|---|---|---|---|---|---|
| Benchmark | [-] | 68.1 | ||||||||||||||
| I123 | [-] | 63.8 | 63.7 | 67.8 | 94.3 | -2.68 | 6.12 | 1.05 | 0.560 | 0.684 | 0.861 | 0.939 | 0.745 | |||
| post5.4 | [-] | 63.8 | 63.7 | 67.8 | 94.3 | -2.77 | 6.49 | 1.08 | 0.545 | 0.677 | 0.855 | 0.937 | 0.738 |
Download Data |
Period Mean (original grids) [%] |
Model Period Mean (intersection) [%] |
Benchmark Period Mean (intersection) [%] |
Model Period Mean (complement) [%] |
Benchmark Period Mean (complement) [%] |
Bias [%] |
RMSE [%] |
Phase Shift [months] |
Bias Score [1] |
RMSE Score [1] |
Seasonal Cycle Score [1] |
Spatial Distribution Score [1] |
Overall Score [1] |
|||
|---|---|---|---|---|---|---|---|---|---|---|---|---|---|---|---|---|
| Benchmark | [-] | 72.7 | ||||||||||||||
| I123 | [-] | 82.2 | 82.2 | 72.4 | 95.0 | 10.7 | 18.0 | 2.67 | 0.482 | 0.520 | 0.561 | 0.415 | 0.500 | |||
| post5.4 | [-] | 85.6 | 85.6 | 73.5 | 95.0 | 12.5 | 18.8 | 2.41 | 0.431 | 0.530 | 0.624 | 0.163 | 0.456 |
Download Data |
Period Mean (original grids) [%] |
Model Period Mean (intersection) [%] |
Benchmark Period Mean (intersection) [%] |
Model Period Mean (complement) [%] |
Benchmark Period Mean (complement) [%] |
Bias [%] |
RMSE [%] |
Phase Shift [months] |
Bias Score [1] |
RMSE Score [1] |
Seasonal Cycle Score [1] |
Spatial Distribution Score [1] |
Overall Score [1] |
|||
|---|---|---|---|---|---|---|---|---|---|---|---|---|---|---|---|---|
| Benchmark | [-] | 86.2 | ||||||||||||||
| I123 | [-] | 85.5 | 85.5 | 85.8 | 94.2 | -1.20 | 6.68 | 2.34 | 0.235 | 0.556 | 0.627 | 0.704 | 0.536 | |||
| post5.4 | [-] | 85.6 | 85.7 | 85.9 | 94.2 | -1.24 | 6.61 | 2.25 | 0.237 | 0.566 | 0.646 | 0.704 | 0.544 |
Download Data |
Period Mean (original grids) [%] |
Model Period Mean (intersection) [%] |
Benchmark Period Mean (intersection) [%] |
Model Period Mean (complement) [%] |
Benchmark Period Mean (complement) [%] |
Bias [%] |
RMSE [%] |
Phase Shift [months] |
Bias Score [1] |
RMSE Score [1] |
Seasonal Cycle Score [1] |
Spatial Distribution Score [1] |
Overall Score [1] |
|||
|---|---|---|---|---|---|---|---|---|---|---|---|---|---|---|---|---|
| Benchmark | [-] | 72.9 | ||||||||||||||
| I123 | [-] | 78.5 | 78.5 | 72.9 | 95.0 | 5.66 | 10.0 | 2.14 | 0.678 | 0.619 | 0.678 | 0.582 | 0.635 | |||
| post5.4 | [-] | 82.9 | 82.9 | 73.4 | 95.0 | 9.53 | 12.5 | 1.96 | 0.522 | 0.634 | 0.704 | 0.443 | 0.587 |
Download Data |
Period Mean (original grids) [%] |
Model Period Mean (intersection) [%] |
Benchmark Period Mean (intersection) [%] |
Model Period Mean (complement) [%] |
Benchmark Period Mean (complement) [%] |
Bias [%] |
RMSE [%] |
Phase Shift [months] |
Bias Score [1] |
RMSE Score [1] |
Seasonal Cycle Score [1] |
Spatial Distribution Score [1] |
Overall Score [1] |
|||
|---|---|---|---|---|---|---|---|---|---|---|---|---|---|---|---|---|
| Benchmark | [-] | 57.3 | ||||||||||||||
| I123 | [-] | 64.4 | 64.5 | 57.2 | 94.5 | 8.14 | 12.5 | 1.52 | 0.561 | 0.644 | 0.787 | 0.641 | 0.656 | |||
| post5.4 | [-] | 65.4 | 65.5 | 57.2 | 94.5 | 9.03 | 13.0 | 1.36 | 0.538 | 0.655 | 0.802 | 0.640 | 0.658 |
Download Data |
Period Mean (original grids) [%] |
Model Period Mean (intersection) [%] |
Benchmark Period Mean (intersection) [%] |
Model Period Mean (complement) [%] |
Benchmark Period Mean (complement) [%] |
Bias [%] |
RMSE [%] |
Phase Shift [months] |
Bias Score [1] |
RMSE Score [1] |
Seasonal Cycle Score [1] |
Spatial Distribution Score [1] |
Overall Score [1] |
|||
|---|---|---|---|---|---|---|---|---|---|---|---|---|---|---|---|---|
| Benchmark | [-] | 67.0 | ||||||||||||||
| I123 | [-] | 66.0 | 66.1 | 66.6 | 94.0 | 1.66 | 8.01 | 1.12 | 0.562 | 0.688 | 0.829 | 0.850 | 0.724 | |||
| post5.4 | [-] | 66.8 | 66.8 | 66.4 | 94.0 | 2.52 | 8.39 | 1.08 | 0.538 | 0.689 | 0.841 | 0.839 | 0.720 |
Download Data |
Period Mean (original grids) [%] |
Model Period Mean (intersection) [%] |
Benchmark Period Mean (intersection) [%] |
Model Period Mean (complement) [%] |
Benchmark Period Mean (complement) [%] |
Bias [%] |
RMSE [%] |
Phase Shift [months] |
Bias Score [1] |
RMSE Score [1] |
Seasonal Cycle Score [1] |
Spatial Distribution Score [1] |
Overall Score [1] |
|||
|---|---|---|---|---|---|---|---|---|---|---|---|---|---|---|---|---|
| Benchmark | [-] | 77.4 | ||||||||||||||
| I123 | [-] | 85.7 | 85.6 | 77.3 | 94.8 | 8.91 | 13.2 | 2.76 | 0.550 | 0.593 | 0.547 | 0.458 | 0.548 | |||
| post5.4 | [-] | 88.1 | 88.0 | 77.7 | 94.8 | 10.6 | 14.3 | 2.62 | 0.476 | 0.604 | 0.565 | 0.172 | 0.484 |
Download Data |
Period Mean (original grids) [%] |
Model Period Mean (intersection) [%] |
Benchmark Period Mean (intersection) [%] |
Model Period Mean (complement) [%] |
Benchmark Period Mean (complement) [%] |
Bias [%] |
RMSE [%] |
Phase Shift [months] |
Bias Score [1] |
RMSE Score [1] |
Seasonal Cycle Score [1] |
Spatial Distribution Score [1] |
Overall Score [1] |
|||
|---|---|---|---|---|---|---|---|---|---|---|---|---|---|---|---|---|
| Benchmark | [-] | 55.2 | ||||||||||||||
| I123 | [-] | 49.0 | 49.0 | 54.5 | 89.3 | -2.76 | 6.29 | 0.675 | 0.650 | 0.737 | 0.894 | 0.898 | 0.783 | |||
| post5.4 | [-] | 49.0 | 49.0 | 54.3 | 89.3 | -2.59 | 6.41 | 0.633 | 0.633 | 0.755 | 0.899 | 0.895 | 0.787 |
Download Data |
Period Mean (original grids) [%] |
Model Period Mean (intersection) [%] |
Benchmark Period Mean (intersection) [%] |
Model Period Mean (complement) [%] |
Benchmark Period Mean (complement) [%] |
Bias [%] |
RMSE [%] |
Phase Shift [months] |
Bias Score [1] |
RMSE Score [1] |
Seasonal Cycle Score [1] |
Spatial Distribution Score [1] |
Overall Score [1] |
|||
|---|---|---|---|---|---|---|---|---|---|---|---|---|---|---|---|---|
| Benchmark | [-] | 78.5 | ||||||||||||||
| I123 | [-] | 79.4 | 79.4 | 78.3 | 90.7 | 1.24 | 6.50 | 0.869 | 0.575 | 0.717 | 0.917 | 0.738 | 0.733 | |||
| post5.4 | [-] | 78.8 | 78.8 | 77.9 | 90.6 | 0.850 | 6.29 | 0.622 | 0.588 | 0.759 | 0.935 | 0.774 | 0.763 |
Download Data |
Period Mean (original grids) [%] |
Model Period Mean (intersection) [%] |
Benchmark Period Mean (intersection) [%] |
Model Period Mean (complement) [%] |
Benchmark Period Mean (complement) [%] |
Bias [%] |
RMSE [%] |
Phase Shift [months] |
Bias Score [1] |
RMSE Score [1] |
Seasonal Cycle Score [1] |
Spatial Distribution Score [1] |
Overall Score [1] |
|||
|---|---|---|---|---|---|---|---|---|---|---|---|---|---|---|---|---|
| Benchmark | [-] | 68.9 | ||||||||||||||
| I123 | [-] | 69.9 | 69.9 | 68.7 | 93.4 | 2.30 | 8.68 | 1.53 | 0.501 | 0.639 | 0.775 | 0.959 | 0.703 | |||
| post5.4 | [-] | 70.8 | 70.8 | 68.8 | 93.4 | 2.93 | 8.82 | 1.42 | 0.489 | 0.652 | 0.790 | 0.960 | 0.709 |
Download Data |
Period Mean (original grids) [%] |
Model Period Mean (intersection) [%] |
Benchmark Period Mean (intersection) [%] |
Model Period Mean (complement) [%] |
Benchmark Period Mean (complement) [%] |
Bias [%] |
RMSE [%] |
Phase Shift [months] |
Bias Score [1] |
RMSE Score [1] |
Seasonal Cycle Score [1] |
Spatial Distribution Score [1] |
Overall Score [1] |
|||
|---|---|---|---|---|---|---|---|---|---|---|---|---|---|---|---|---|
| Benchmark | [-] | 44.5 | ||||||||||||||
| I123 | [-] | 48.5 | 48.6 | 44.2 | 92.9 | 5.91 | 11.5 | 0.830 | 0.393 | 0.599 | 0.894 | 0.843 | 0.665 | |||
| post5.4 | [-] | 48.5 | 48.6 | 44.3 | 92.9 | 5.81 | 11.3 | 0.756 | 0.397 | 0.605 | 0.900 | 0.834 | 0.668 |
Download Data |
Period Mean (original grids) [%] |
Model Period Mean (intersection) [%] |
Benchmark Period Mean (intersection) [%] |
Model Period Mean (complement) [%] |
Benchmark Period Mean (complement) [%] |
Bias [%] |
RMSE [%] |
Phase Shift [months] |
Bias Score [1] |
RMSE Score [1] |
Seasonal Cycle Score [1] |
Spatial Distribution Score [1] |
Overall Score [1] |
|||
|---|---|---|---|---|---|---|---|---|---|---|---|---|---|---|---|---|
| Benchmark | [-] | 83.0 | ||||||||||||||
| I123 | [-] | 79.6 | 79.6 | 82.9 | 95.0 | -2.57 | 11.8 | 2.51 | 0.533 | 0.494 | 0.603 | 0.644 | 0.553 | |||
| post5.4 | [-] | 80.5 | 80.4 | 83.7 | 95.0 | -2.75 | 11.6 | 2.44 | 0.504 | 0.509 | 0.611 | 0.518 | 0.530 |
Download Data |
Period Mean (original grids) [%] |
Model Period Mean (intersection) [%] |
Benchmark Period Mean (intersection) [%] |
Model Period Mean (complement) [%] |
Benchmark Period Mean (complement) [%] |
Bias [%] |
RMSE [%] |
Phase Shift [months] |
Bias Score [1] |
RMSE Score [1] |
Seasonal Cycle Score [1] |
Spatial Distribution Score [1] |
Overall Score [1] |
|||
|---|---|---|---|---|---|---|---|---|---|---|---|---|---|---|---|---|
| Benchmark | [-] | 72.3 | ||||||||||||||
| I123 | [-] | 65.8 | 65.8 | 71.5 | 92.9 | -1.91 | 8.30 | 1.52 | 0.406 | 0.640 | 0.762 | 0.890 | 0.668 | |||
| post5.4 | [-] | 66.5 | 66.4 | 71.5 | 92.9 | -1.47 | 8.34 | 1.42 | 0.406 | 0.645 | 0.781 | 0.882 | 0.672 |
Download Data |
Period Mean (original grids) [%] |
Model Period Mean (intersection) [%] |
Benchmark Period Mean (intersection) [%] |
Model Period Mean (complement) [%] |
Benchmark Period Mean (complement) [%] |
Bias [%] |
RMSE [%] |
Phase Shift [months] |
Bias Score [1] |
RMSE Score [1] |
Seasonal Cycle Score [1] |
Spatial Distribution Score [1] |
Overall Score [1] |
|||
|---|---|---|---|---|---|---|---|---|---|---|---|---|---|---|---|---|
| Benchmark | [-] | 73.0 | ||||||||||||||
| I123 | [-] | 72.0 | 72.1 | 72.7 | 94.8 | -0.114 | 5.48 | 2.59 | 0.645 | 0.626 | 0.555 | 0.692 | 0.629 | |||
| post5.4 | [-] | 73.4 | 73.5 | 72.8 | 94.8 | 0.994 | 5.01 | 2.15 | 0.625 | 0.718 | 0.642 | 0.637 | 0.668 |
Download Data |
Period Mean (original grids) [%] |
Model Period Mean (intersection) [%] |
Benchmark Period Mean (intersection) [%] |
Model Period Mean (complement) [%] |
Benchmark Period Mean (complement) [%] |
Bias [%] |
RMSE [%] |
Phase Shift [months] |
Bias Score [1] |
RMSE Score [1] |
Seasonal Cycle Score [1] |
Spatial Distribution Score [1] |
Overall Score [1] |
|||
|---|---|---|---|---|---|---|---|---|---|---|---|---|---|---|---|---|
| Benchmark | [-] | 79.5 | ||||||||||||||
| I123 | [-] | 74.9 | 75.0 | 79.5 | 95.0 | -3.93 | 9.26 | 1.77 | 0.657 | 0.507 | 0.750 | 0.944 | 0.673 | |||
| post5.4 | [-] | 77.7 | 77.8 | 79.9 | 95.0 | -1.79 | 7.32 | 1.10 | 0.735 | 0.580 | 0.872 | 0.882 | 0.730 |
Download Data |
Period Mean (original grids) [%] |
Model Period Mean (intersection) [%] |
Benchmark Period Mean (intersection) [%] |
Model Period Mean (complement) [%] |
Benchmark Period Mean (complement) [%] |
Bias [%] |
RMSE [%] |
Phase Shift [months] |
Bias Score [1] |
RMSE Score [1] |
Seasonal Cycle Score [1] |
Spatial Distribution Score [1] |
Overall Score [1] |
|||
|---|---|---|---|---|---|---|---|---|---|---|---|---|---|---|---|---|
| Benchmark | [-] | 56.3 | ||||||||||||||
| I123 | [-] | 55.8 | 56.0 | 56.2 | 94.8 | 0.464 | 5.62 | 1.27 | 0.727 | 0.717 | 0.838 | 0.961 | 0.792 | |||
| post5.4 | [-] | 57.7 | 57.9 | 56.4 | 94.9 | 2.21 | 5.80 | 1.07 | 0.706 | 0.728 | 0.869 | 0.939 | 0.794 |
Download Data |
Period Mean (original grids) [%] |
Model Period Mean (intersection) [%] |
Benchmark Period Mean (intersection) [%] |
Model Period Mean (complement) [%] |
Benchmark Period Mean (complement) [%] |
Bias [%] |
RMSE [%] |
Phase Shift [months] |
Bias Score [1] |
RMSE Score [1] |
Seasonal Cycle Score [1] |
Spatial Distribution Score [1] |
Overall Score [1] |
|||
|---|---|---|---|---|---|---|---|---|---|---|---|---|---|---|---|---|
| Benchmark | [-] | 82.0 | ||||||||||||||
| I123 | [-] | 86.7 | 86.7 | 81.9 | 93.2 | 4.56 | 6.34 | 1.15 | 0.280 | 0.658 | 0.839 | 0.992 | 0.685 | |||
| post5.4 | [-] | 86.6 | 86.6 | 82.0 | 93.2 | 4.38 | 6.22 | 0.937 | 0.294 | 0.663 | 0.877 | 0.995 | 0.698 |
Download Data |
Period Mean (original grids) [%] |
Model Period Mean (intersection) [%] |
Benchmark Period Mean (intersection) [%] |
Model Period Mean (complement) [%] |
Benchmark Period Mean (complement) [%] |
Bias [%] |
RMSE [%] |
Phase Shift [months] |
Bias Score [1] |
RMSE Score [1] |
Seasonal Cycle Score [1] |
Spatial Distribution Score [1] |
Overall Score [1] |
|||
|---|---|---|---|---|---|---|---|---|---|---|---|---|---|---|---|---|
| Benchmark | [-] | 72.6 | ||||||||||||||
| I123 | [-] | 74.3 | 74.1 | 72.3 | 94.1 | 2.15 | 4.99 | 1.07 | 0.575 | 0.707 | 0.860 | 0.934 | 0.757 | |||
| post5.4 | [-] | 73.7 | 73.5 | 72.4 | 94.1 | 1.53 | 4.97 | 1.05 | 0.584 | 0.704 | 0.859 | 0.965 | 0.763 |
Download Data |
Period Mean (original grids) [%] |
Model Period Mean (intersection) [%] |
Benchmark Period Mean (intersection) [%] |
Model Period Mean (complement) [%] |
Benchmark Period Mean (complement) [%] |
Bias [%] |
RMSE [%] |
Phase Shift [months] |
Bias Score [1] |
RMSE Score [1] |
Seasonal Cycle Score [1] |
Spatial Distribution Score [1] |
Overall Score [1] |
|||
|---|---|---|---|---|---|---|---|---|---|---|---|---|---|---|---|---|
| Benchmark | [-] | 61.9 | ||||||||||||||
| I123 | [-] | 59.4 | 59.5 | 61.5 | 94.7 | 0.311 | 12.2 | 1.49 | 0.363 | 0.614 | 0.789 | 0.739 | 0.623 | |||
| post5.4 | [-] | 59.7 | 59.8 | 61.8 | 94.7 | 0.120 | 11.9 | 1.43 | 0.366 | 0.625 | 0.795 | 0.729 | 0.628 |
Temporally integrated period mean