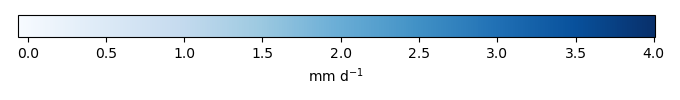
Mean State
Download Data |
Period Mean (original grids) [mm d-1] |
Model Period Mean (intersection) [mm d-1] |
Benchmark Period Mean (intersection) [mm d-1] |
Model Period Mean (complement) [mm d-1] |
Benchmark Period Mean (complement) [mm d-1] |
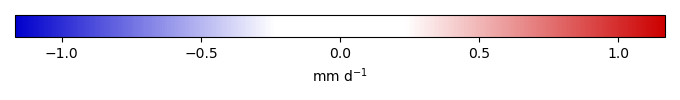
Bias [mm d-1] |
RMSE [mm d-1] |
Phase Shift [months] |
Bias Score [1] |
RMSE Score [1] |
Seasonal Cycle Score [1] |
Spatial Distribution Score [1] |
Overall Score [1] |
|||
|---|---|---|---|---|---|---|---|---|---|---|---|---|---|---|---|---|
| Benchmark | [-] | 2.49 | ||||||||||||||
| I123 | [-] | 2.49 | 2.53 | 2.49 | 1.80 | 0.0229 | 0.669 | 2.81 | 0.592 | 0.635 | 0.538 | 0.966 | 0.673 | |||
| post5.4 | [-] | 2.51 | 2.54 | 2.49 | 1.81 | 0.0394 | 0.658 | 2.85 | 0.588 | 0.649 | 0.527 | 0.974 | 0.677 |
Download Data |
Period Mean (original grids) [mm d-1] |
Model Period Mean (intersection) [mm d-1] |
Benchmark Period Mean (intersection) [mm d-1] |
Model Period Mean (complement) [mm d-1] |
Benchmark Period Mean (complement) [mm d-1] |
Bias [mm d-1] |
RMSE [mm d-1] |
Phase Shift [months] |
Bias Score [1] |
RMSE Score [1] |
Seasonal Cycle Score [1] |
Spatial Distribution Score [1] |
Overall Score [1] |
|||
|---|---|---|---|---|---|---|---|---|---|---|---|---|---|---|---|---|
| Benchmark | [-] | 1.21 | ||||||||||||||
| I123 | [-] | 1.70 | 1.72 | 1.21 | 0.767 | 0.509 | 0.991 | 0.847 | 0.282 | 0.478 | 0.900 | 0.790 | 0.586 | |||
| post5.4 | [-] | 1.71 | 1.73 | 1.21 | 0.767 | 0.520 | 1.00 | 0.927 | 0.275 | 0.471 | 0.890 | 0.784 | 0.578 |
Download Data |
Period Mean (original grids) [mm d-1] |
Model Period Mean (intersection) [mm d-1] |
Benchmark Period Mean (intersection) [mm d-1] |
Model Period Mean (complement) [mm d-1] |
Benchmark Period Mean (complement) [mm d-1] |
Bias [mm d-1] |
RMSE [mm d-1] |
Phase Shift [months] |
Bias Score [1] |
RMSE Score [1] |
Seasonal Cycle Score [1] |
Spatial Distribution Score [1] |
Overall Score [1] |
|||
|---|---|---|---|---|---|---|---|---|---|---|---|---|---|---|---|---|
| Benchmark | [-] | 1.67 | ||||||||||||||
| I123 | [-] | 1.63 | 1.62 | 1.67 | 1.73 | 2.90 | -0.0358 | 0.742 | 1.13 | 0.569 | 0.542 | 0.861 | 0.904 | 0.684 | ||
| post5.4 | [-] | 1.66 | 1.65 | 1.67 | 1.76 | 2.90 | -0.00631 | 0.730 | 1.25 | 0.571 | 0.547 | 0.853 | 0.890 | 0.681 |
Download Data |
Period Mean (original grids) [mm d-1] |
Model Period Mean (intersection) [mm d-1] |
Benchmark Period Mean (intersection) [mm d-1] |
Model Period Mean (complement) [mm d-1] |
Benchmark Period Mean (complement) [mm d-1] |
Bias [mm d-1] |
RMSE [mm d-1] |
Phase Shift [months] |
Bias Score [1] |
RMSE Score [1] |
Seasonal Cycle Score [1] |
Spatial Distribution Score [1] |
Overall Score [1] |
|||
|---|---|---|---|---|---|---|---|---|---|---|---|---|---|---|---|---|
| Benchmark | [-] | 0.851 | ||||||||||||||
| I123 | [-] | 0.429 | 0.430 | 0.851 | 0.415 | -0.421 | 0.537 | 0.376 | 0.0349 | 0.331 | 0.973 | 0.766 | 0.487 | |||
| post5.4 | [-] | 0.462 | 0.463 | 0.851 | 0.445 | -0.388 | 0.498 | 0.446 | 0.0607 | 0.382 | 0.970 | 0.882 | 0.536 |
Download Data |
Period Mean (original grids) [mm d-1] |
Model Period Mean (intersection) [mm d-1] |
Benchmark Period Mean (intersection) [mm d-1] |
Model Period Mean (complement) [mm d-1] |
Benchmark Period Mean (complement) [mm d-1] |
Bias [mm d-1] |
RMSE [mm d-1] |
Phase Shift [months] |
Bias Score [1] |
RMSE Score [1] |
Seasonal Cycle Score [1] |
Spatial Distribution Score [1] |
Overall Score [1] |
|||
|---|---|---|---|---|---|---|---|---|---|---|---|---|---|---|---|---|
| Benchmark | [-] | 3.76 | ||||||||||||||
| I123 | [-] | 3.73 | 3.76 | 3.76 | 3.64 | 3.88 | -0.0328 | 0.537 | 3.08 | 0.554 | 0.721 | 0.486 | 0.774 | 0.651 | ||
| post5.4 | [-] | 3.66 | 3.67 | 3.76 | 3.64 | 3.88 | -0.101 | 0.587 | 2.91 | 0.496 | 0.709 | 0.519 | 0.652 | 0.617 |
Download Data |
Period Mean (original grids) [mm d-1] |
Model Period Mean (intersection) [mm d-1] |
Benchmark Period Mean (intersection) [mm d-1] |
Model Period Mean (complement) [mm d-1] |
Benchmark Period Mean (complement) [mm d-1] |
Bias [mm d-1] |
RMSE [mm d-1] |
Phase Shift [months] |
Bias Score [1] |
RMSE Score [1] |
Seasonal Cycle Score [1] |
Spatial Distribution Score [1] |
Overall Score [1] |
|||
|---|---|---|---|---|---|---|---|---|---|---|---|---|---|---|---|---|
| Benchmark | [-] | 1.12 | ||||||||||||||
| I123 | [-] | 0.823 | 0.819 | 1.12 | 0.876 | 1.43 | -0.297 | 0.490 | 0.548 | 0.229 | 0.359 | 0.961 | 0.894 | 0.560 | ||
| post5.4 | [-] | 0.812 | 0.809 | 1.12 | 0.851 | 1.43 | -0.308 | 0.497 | 0.757 | 0.187 | 0.350 | 0.944 | 0.967 | 0.560 |
Download Data |
Period Mean (original grids) [mm d-1] |
Model Period Mean (intersection) [mm d-1] |
Benchmark Period Mean (intersection) [mm d-1] |
Model Period Mean (complement) [mm d-1] |
Benchmark Period Mean (complement) [mm d-1] |
Bias [mm d-1] |
RMSE [mm d-1] |
Phase Shift [months] |
Bias Score [1] |
RMSE Score [1] |
Seasonal Cycle Score [1] |
Spatial Distribution Score [1] |
Overall Score [1] |
|||
|---|---|---|---|---|---|---|---|---|---|---|---|---|---|---|---|---|
| Benchmark | [-] | 1.17 | ||||||||||||||
| I123 | [-] | 0.994 | 1.08 | 1.17 | 0.602 | -0.0696 | 0.649 | 1.43 | 0.553 | 0.357 | 0.784 | 0.934 | 0.597 | |||
| post5.4 | [-] | 0.959 | 1.04 | 1.17 | 0.594 | -0.111 | 0.663 | 1.44 | 0.528 | 0.360 | 0.784 | 0.874 | 0.581 |
Download Data |
Period Mean (original grids) [mm d-1] |
Model Period Mean (intersection) [mm d-1] |
Benchmark Period Mean (intersection) [mm d-1] |
Model Period Mean (complement) [mm d-1] |
Benchmark Period Mean (complement) [mm d-1] |
Bias [mm d-1] |
RMSE [mm d-1] |
Phase Shift [months] |
Bias Score [1] |
RMSE Score [1] |
Seasonal Cycle Score [1] |
Spatial Distribution Score [1] |
Overall Score [1] |
|||
|---|---|---|---|---|---|---|---|---|---|---|---|---|---|---|---|---|
| Benchmark | [-] | 2.11 | ||||||||||||||
| I123 | [-] | 1.99 | 2.05 | 2.11 | 1.55 | 4.04 | -0.00270 | 0.781 | 1.55 | 0.484 | 0.553 | 0.788 | 0.797 | 0.635 | ||
| post5.4 | [-] | 1.96 | 2.02 | 2.11 | 1.54 | 4.04 | -0.0261 | 0.806 | 1.63 | 0.502 | 0.524 | 0.780 | 0.800 | 0.626 |
Download Data |
Period Mean (original grids) [mm d-1] |
Model Period Mean (intersection) [mm d-1] |
Benchmark Period Mean (intersection) [mm d-1] |
Model Period Mean (complement) [mm d-1] |
Benchmark Period Mean (complement) [mm d-1] |
Bias [mm d-1] |
RMSE [mm d-1] |
Phase Shift [months] |
Bias Score [1] |
RMSE Score [1] |
Seasonal Cycle Score [1] |
Spatial Distribution Score [1] |
Overall Score [1] |
|||
|---|---|---|---|---|---|---|---|---|---|---|---|---|---|---|---|---|
| Benchmark | [-] | 0.785 | ||||||||||||||
| I123 | [-] | 0.522 | 0.545 | 0.785 | 0.347 | -0.242 | 0.389 | 0.371 | 0.238 | 0.409 | 0.975 | 0.975 | 0.601 | |||
| post5.4 | [-] | 0.536 | 0.558 | 0.785 | 0.365 | -0.228 | 0.367 | 0.549 | 0.262 | 0.454 | 0.963 | 0.978 | 0.622 |
Download Data |
Period Mean (original grids) [mm d-1] |
Model Period Mean (intersection) [mm d-1] |
Benchmark Period Mean (intersection) [mm d-1] |
Model Period Mean (complement) [mm d-1] |
Benchmark Period Mean (complement) [mm d-1] |
Bias [mm d-1] |
RMSE [mm d-1] |
Phase Shift [months] |
Bias Score [1] |
RMSE Score [1] |
Seasonal Cycle Score [1] |
Spatial Distribution Score [1] |
Overall Score [1] |
|||
|---|---|---|---|---|---|---|---|---|---|---|---|---|---|---|---|---|
| Benchmark | [-] | 0.787 | ||||||||||||||
| I123 | [-] | 1.08 | 1.05 | 0.786 | 1.62 | 1.79 | 0.306 | 0.566 | 1.94 | 0.510 | 0.675 | 0.705 | 0.901 | 0.693 | ||
| post5.4 | [-] | 1.15 | 1.12 | 0.786 | 1.66 | 1.79 | 0.376 | 0.631 | 2.01 | 0.443 | 0.641 | 0.693 | 0.915 | 0.666 |
Download Data |
Period Mean (original grids) [mm d-1] |
Model Period Mean (intersection) [mm d-1] |
Benchmark Period Mean (intersection) [mm d-1] |
Model Period Mean (complement) [mm d-1] |
Benchmark Period Mean (complement) [mm d-1] |
Bias [mm d-1] |
RMSE [mm d-1] |
Phase Shift [months] |
Bias Score [1] |
RMSE Score [1] |
Seasonal Cycle Score [1] |
Spatial Distribution Score [1] |
Overall Score [1] |
|||
|---|---|---|---|---|---|---|---|---|---|---|---|---|---|---|---|---|
| Benchmark | [-] | 1.32 | ||||||||||||||
| I123 | [-] | 1.13 | 1.13 | 1.32 | 1.13 | 1.05 | -0.188 | 0.505 | 0.435 | 0.434 | 0.554 | 0.970 | 0.986 | 0.700 | ||
| post5.4 | [-] | 1.17 | 1.17 | 1.32 | 1.19 | 1.05 | -0.142 | 0.484 | 0.401 | 0.500 | 0.548 | 0.973 | 0.988 | 0.712 |
Download Data |
Period Mean (original grids) [mm d-1] |
Model Period Mean (intersection) [mm d-1] |
Benchmark Period Mean (intersection) [mm d-1] |
Model Period Mean (complement) [mm d-1] |
Benchmark Period Mean (complement) [mm d-1] |
Bias [mm d-1] |
RMSE [mm d-1] |
Phase Shift [months] |
Bias Score [1] |
RMSE Score [1] |
Seasonal Cycle Score [1] |
Spatial Distribution Score [1] |
Overall Score [1] |
|||
|---|---|---|---|---|---|---|---|---|---|---|---|---|---|---|---|---|
| Benchmark | [-] | 1.56 | ||||||||||||||
| I123 | [-] | 1.18 | 1.48 | 1.56 | 0.362 | 2.15 | -0.0626 | 0.653 | 1.33 | 0.438 | 0.491 | 0.818 | 0.967 | 0.641 | ||
| post5.4 | [-] | 1.19 | 1.49 | 1.56 | 0.357 | 2.15 | -0.0430 | 0.652 | 1.40 | 0.439 | 0.492 | 0.810 | 0.969 | 0.640 |
Download Data |
Period Mean (original grids) [mm d-1] |
Model Period Mean (intersection) [mm d-1] |
Benchmark Period Mean (intersection) [mm d-1] |
Model Period Mean (complement) [mm d-1] |
Benchmark Period Mean (complement) [mm d-1] |
Bias [mm d-1] |
RMSE [mm d-1] |
Phase Shift [months] |
Bias Score [1] |
RMSE Score [1] |
Seasonal Cycle Score [1] |
Spatial Distribution Score [1] |
Overall Score [1] |
|||
|---|---|---|---|---|---|---|---|---|---|---|---|---|---|---|---|---|
| Benchmark | [-] | 0.603 | ||||||||||||||
| I123 | [-] | 0.359 | 0.917 | 0.603 | 0.226 | 0.326 | 0.786 | 2.17 | 0.463 | 0.339 | 0.666 | 0.957 | 0.553 | |||
| post5.4 | [-] | 0.338 | 0.871 | 0.603 | 0.212 | 0.280 | 0.738 | 2.10 | 0.513 | 0.369 | 0.683 | 0.956 | 0.578 |
Download Data |
Period Mean (original grids) [mm d-1] |
Model Period Mean (intersection) [mm d-1] |
Benchmark Period Mean (intersection) [mm d-1] |
Model Period Mean (complement) [mm d-1] |
Benchmark Period Mean (complement) [mm d-1] |
Bias [mm d-1] |
RMSE [mm d-1] |
Phase Shift [months] |
Bias Score [1] |
RMSE Score [1] |
Seasonal Cycle Score [1] |
Spatial Distribution Score [1] |
Overall Score [1] |
|||
|---|---|---|---|---|---|---|---|---|---|---|---|---|---|---|---|---|
| Benchmark | [-] | 0.876 | ||||||||||||||
| I123 | [-] | 0.570 | 0.646 | 0.876 | 0.357 | -0.230 | 0.402 | 0.700 | 0.318 | 0.420 | 0.953 | 0.904 | 0.603 | |||
| post5.4 | [-] | 0.607 | 0.688 | 0.876 | 0.381 | -0.187 | 0.385 | 0.699 | 0.373 | 0.428 | 0.953 | 0.855 | 0.607 |
Download Data |
Period Mean (original grids) [mm d-1] |
Model Period Mean (intersection) [mm d-1] |
Benchmark Period Mean (intersection) [mm d-1] |
Model Period Mean (complement) [mm d-1] |
Benchmark Period Mean (complement) [mm d-1] |
Bias [mm d-1] |
RMSE [mm d-1] |
Phase Shift [months] |
Bias Score [1] |
RMSE Score [1] |
Seasonal Cycle Score [1] |
Spatial Distribution Score [1] |
Overall Score [1] |
|||
|---|---|---|---|---|---|---|---|---|---|---|---|---|---|---|---|---|
| Benchmark | [-] | 2.12 | ||||||||||||||
| I123 | [-] | 2.03 | 1.98 | 2.12 | 2.33 | 3.97 | -0.0485 | 0.676 | 1.55 | 0.585 | 0.574 | 0.787 | 0.975 | 0.699 | ||
| post5.4 | [-] | 2.02 | 1.97 | 2.12 | 2.35 | 3.97 | -0.0596 | 0.657 | 1.59 | 0.589 | 0.579 | 0.790 | 0.970 | 0.702 |
Download Data |
Period Mean (original grids) [mm d-1] |
Model Period Mean (intersection) [mm d-1] |
Benchmark Period Mean (intersection) [mm d-1] |
Model Period Mean (complement) [mm d-1] |
Benchmark Period Mean (complement) [mm d-1] |
Bias [mm d-1] |
RMSE [mm d-1] |
Phase Shift [months] |
Bias Score [1] |
RMSE Score [1] |
Seasonal Cycle Score [1] |
Spatial Distribution Score [1] |
Overall Score [1] |
|||
|---|---|---|---|---|---|---|---|---|---|---|---|---|---|---|---|---|
| Benchmark | [-] | 1.88 | ||||||||||||||
| I123 | [-] | 1.58 | 1.58 | 1.88 | 1.70 | -0.290 | 0.615 | 0.681 | 0.372 | 0.431 | 0.949 | 0.751 | 0.587 | |||
| post5.4 | [-] | 1.65 | 1.65 | 1.88 | 1.78 | -0.218 | 0.586 | 0.856 | 0.422 | 0.427 | 0.936 | 0.891 | 0.621 |
Download Data |
Period Mean (original grids) [mm d-1] |
Model Period Mean (intersection) [mm d-1] |
Benchmark Period Mean (intersection) [mm d-1] |
Model Period Mean (complement) [mm d-1] |
Benchmark Period Mean (complement) [mm d-1] |
Bias [mm d-1] |
RMSE [mm d-1] |
Phase Shift [months] |
Bias Score [1] |
RMSE Score [1] |
Seasonal Cycle Score [1] |
Spatial Distribution Score [1] |
Overall Score [1] |
|||
|---|---|---|---|---|---|---|---|---|---|---|---|---|---|---|---|---|
| Benchmark | [-] | 1.14 | ||||||||||||||
| I123 | [-] | 1.04 | 1.03 | 1.14 | 1.28 | -0.103 | 0.419 | 0.640 | 0.562 | 0.432 | 0.954 | 0.994 | 0.675 | |||
| post5.4 | [-] | 1.05 | 1.04 | 1.14 | 1.34 | -0.0861 | 0.407 | 0.727 | 0.597 | 0.450 | 0.949 | 0.993 | 0.688 |
Download Data |
Period Mean (original grids) [mm d-1] |
Model Period Mean (intersection) [mm d-1] |
Benchmark Period Mean (intersection) [mm d-1] |
Model Period Mean (complement) [mm d-1] |
Benchmark Period Mean (complement) [mm d-1] |
Bias [mm d-1] |
RMSE [mm d-1] |
Phase Shift [months] |
Bias Score [1] |
RMSE Score [1] |
Seasonal Cycle Score [1] |
Spatial Distribution Score [1] |
Overall Score [1] |
|||
|---|---|---|---|---|---|---|---|---|---|---|---|---|---|---|---|---|
| Benchmark | [-] | 0.787 | ||||||||||||||
| I123 | [-] | 0.928 | 0.935 | 0.787 | 1.14 | 0.157 | 0.661 | 1.89 | 0.617 | 0.370 | 0.700 | 0.957 | 0.603 | |||
| post5.4 | [-] | 0.909 | 0.918 | 0.787 | 1.12 | 0.140 | 0.633 | 1.86 | 0.635 | 0.393 | 0.704 | 0.962 | 0.617 |
Download Data |
Period Mean (original grids) [mm d-1] |
Model Period Mean (intersection) [mm d-1] |
Benchmark Period Mean (intersection) [mm d-1] |
Model Period Mean (complement) [mm d-1] |
Benchmark Period Mean (complement) [mm d-1] |
Bias [mm d-1] |
RMSE [mm d-1] |
Phase Shift [months] |
Bias Score [1] |
RMSE Score [1] |
Seasonal Cycle Score [1] |
Spatial Distribution Score [1] |
Overall Score [1] |
|||
|---|---|---|---|---|---|---|---|---|---|---|---|---|---|---|---|---|
| Benchmark | [-] | 3.61 | ||||||||||||||
| I123 | [-] | 3.04 | 3.05 | 3.61 | 2.96 | -0.571 | 0.810 | 1.95 | 0.325 | 0.664 | 0.723 | 0.986 | 0.672 | |||
| post5.4 | [-] | 3.16 | 3.17 | 3.61 | 3.05 | -0.449 | 0.748 | 2.14 | 0.388 | 0.667 | 0.685 | 0.994 | 0.680 |
Download Data |
Period Mean (original grids) [mm d-1] |
Model Period Mean (intersection) [mm d-1] |
Benchmark Period Mean (intersection) [mm d-1] |
Model Period Mean (complement) [mm d-1] |
Benchmark Period Mean (complement) [mm d-1] |
Bias [mm d-1] |
RMSE [mm d-1] |
Phase Shift [months] |
Bias Score [1] |
RMSE Score [1] |
Seasonal Cycle Score [1] |
Spatial Distribution Score [1] |
Overall Score [1] |
|||
|---|---|---|---|---|---|---|---|---|---|---|---|---|---|---|---|---|
| Benchmark | [-] | 1.96 | ||||||||||||||
| I123 | [-] | 2.04 | 2.02 | 1.96 | 2.13 | 1.87 | 0.0630 | 0.870 | 1.32 | 0.427 | 0.512 | 0.841 | 0.780 | 0.615 | ||
| post5.4 | [-] | 2.11 | 2.10 | 1.96 | 2.18 | 1.87 | 0.139 | 0.903 | 1.46 | 0.370 | 0.508 | 0.815 | 0.770 | 0.594 |
Download Data |
Period Mean (original grids) [mm d-1] |
Model Period Mean (intersection) [mm d-1] |
Benchmark Period Mean (intersection) [mm d-1] |
Model Period Mean (complement) [mm d-1] |
Benchmark Period Mean (complement) [mm d-1] |
Bias [mm d-1] |
RMSE [mm d-1] |
Phase Shift [months] |
Bias Score [1] |
RMSE Score [1] |
Seasonal Cycle Score [1] |
Spatial Distribution Score [1] |
Overall Score [1] |
|||
|---|---|---|---|---|---|---|---|---|---|---|---|---|---|---|---|---|
| Benchmark | [-] | 1.17 | ||||||||||||||
| I123 | [-] | 0.925 | 1.03 | 1.17 | 0.544 | -0.143 | 0.583 | 1.89 | 0.454 | 0.571 | 0.712 | 0.934 | 0.648 | |||
| post5.4 | [-] | 0.968 | 1.07 | 1.17 | 0.562 | -0.0957 | 0.619 | 1.91 | 0.432 | 0.550 | 0.713 | 0.929 | 0.635 |
Temporally integrated period mean