Mean State
Download Data |
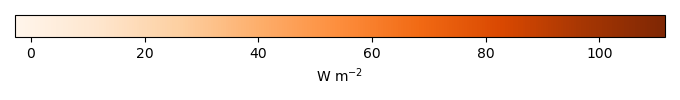
Period Mean (original grids) [W m-2] |
Model Period Mean (intersection) [W m-2] |
Benchmark Period Mean (intersection) [W m-2] |
Model Period Mean (complement) [W m-2] |
Benchmark Period Mean (complement) [W m-2] |
Bias [W m-2] |
RMSE [W m-2] |
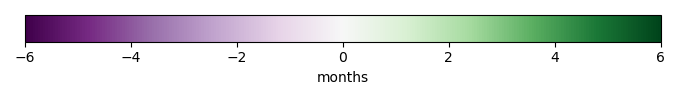
Phase Shift [months] |
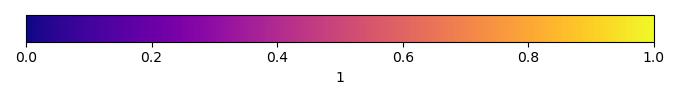
Bias Score [1] |
RMSE Score [1] |
Seasonal Cycle Score [1] |
Spatial Distribution Score [1] |
Overall Score [1] |
|||
|---|---|---|---|---|---|---|---|---|---|---|---|---|---|---|---|---|
| Benchmark | [-] | 65.9 | ||||||||||||||
| I123 | [-] | 71.8 | 72.5 | 65.9 | 61.7 | 5.68 | 14.9 | 2.87 | 0.580 | 0.673 | 0.519 | 0.980 | 0.685 | |||
| post5.4 | [-] | 72.9 | 73.6 | 65.9 | 62.0 | 6.73 | 15.9 | 2.49 | 0.556 | 0.654 | 0.596 | 0.976 | 0.687 |
Download Data |
Period Mean (original grids) [W m-2] |
Model Period Mean (intersection) [W m-2] |
Benchmark Period Mean (intersection) [W m-2] |
Model Period Mean (complement) [W m-2] |
Benchmark Period Mean (complement) [W m-2] |
Bias [W m-2] |
RMSE [W m-2] |
Phase Shift [months] |
Bias Score [1] |
RMSE Score [1] |
Seasonal Cycle Score [1] |
Spatial Distribution Score [1] |
Overall Score [1] |
|||
|---|---|---|---|---|---|---|---|---|---|---|---|---|---|---|---|---|
| Benchmark | [-] | 47.3 | ||||||||||||||
| I123 | [-] | 49.0 | 48.3 | 47.3 | 47.5 | 2.19 | 17.1 | 0.993 | 0.637 | 0.467 | 0.860 | 0.966 | 0.679 | |||
| post5.4 | [-] | 50.2 | 49.6 | 47.3 | 49.9 | 3.41 | 16.8 | 1.08 | 0.612 | 0.481 | 0.842 | 0.964 | 0.676 |
Download Data |
Period Mean (original grids) [W m-2] |
Model Period Mean (intersection) [W m-2] |
Benchmark Period Mean (intersection) [W m-2] |
Model Period Mean (complement) [W m-2] |
Benchmark Period Mean (complement) [W m-2] |
Bias [W m-2] |
RMSE [W m-2] |
Phase Shift [months] |
Bias Score [1] |
RMSE Score [1] |
Seasonal Cycle Score [1] |
Spatial Distribution Score [1] |
Overall Score [1] |
|||
|---|---|---|---|---|---|---|---|---|---|---|---|---|---|---|---|---|
| Benchmark | [-] | 52.2 | ||||||||||||||
| I123 | [-] | 46.7 | 46.0 | 52.2 | 58.5 | 55.3 | -5.95 | 17.1 | 1.17 | 0.549 | 0.557 | 0.850 | 0.948 | 0.692 | ||
| post5.4 | [-] | 47.7 | 47.0 | 52.2 | 60.1 | 55.3 | -4.97 | 15.8 | 1.00 | 0.566 | 0.601 | 0.872 | 0.944 | 0.717 |
Download Data |
Period Mean (original grids) [W m-2] |
Model Period Mean (intersection) [W m-2] |
Benchmark Period Mean (intersection) [W m-2] |
Model Period Mean (complement) [W m-2] |
Benchmark Period Mean (complement) [W m-2] |
Bias [W m-2] |
RMSE [W m-2] |
Phase Shift [months] |
Bias Score [1] |
RMSE Score [1] |
Seasonal Cycle Score [1] |
Spatial Distribution Score [1] |
Overall Score [1] |
|||
|---|---|---|---|---|---|---|---|---|---|---|---|---|---|---|---|---|
| Benchmark | [-] | 16.2 | ||||||||||||||
| I123 | [-] | 12.4 | 12.4 | 16.2 | 12.5 | -3.79 | 10.4 | 0.457 | 0.487 | 0.389 | 0.969 | 0.793 | 0.605 | |||
| post5.4 | [-] | 13.8 | 13.8 | 16.2 | 13.8 | -2.36 | 9.16 | 0.555 | 0.512 | 0.464 | 0.962 | 0.908 | 0.662 |
Download Data |
Period Mean (original grids) [W m-2] |
Model Period Mean (intersection) [W m-2] |
Benchmark Period Mean (intersection) [W m-2] |
Model Period Mean (complement) [W m-2] |
Benchmark Period Mean (complement) [W m-2] |
Bias [W m-2] |
RMSE [W m-2] |
Phase Shift [months] |
Bias Score [1] |
RMSE Score [1] |
Seasonal Cycle Score [1] |
Spatial Distribution Score [1] |
Overall Score [1] |
|||
|---|---|---|---|---|---|---|---|---|---|---|---|---|---|---|---|---|
| Benchmark | [-] | 86.9 | ||||||||||||||
| I123 | [-] | 107. | 108. | 86.9 | 103. | 20.4 | 24.2 | 2.14 | 0.350 | 0.799 | 0.665 | 0.981 | 0.719 | |||
| post5.4 | [-] | 107. | 107. | 86.9 | 105. | 20.0 | 25.5 | 2.51 | 0.356 | 0.777 | 0.594 | 0.924 | 0.686 |
Download Data |
Period Mean (original grids) [W m-2] |
Model Period Mean (intersection) [W m-2] |
Benchmark Period Mean (intersection) [W m-2] |
Model Period Mean (complement) [W m-2] |
Benchmark Period Mean (complement) [W m-2] |
Bias [W m-2] |
RMSE [W m-2] |
Phase Shift [months] |
Bias Score [1] |
RMSE Score [1] |
Seasonal Cycle Score [1] |
Spatial Distribution Score [1] |
Overall Score [1] |
|||
|---|---|---|---|---|---|---|---|---|---|---|---|---|---|---|---|---|
| Benchmark | [-] | 28.6 | ||||||||||||||
| I123 | [-] | 23.7 | 23.6 | 28.6 | 25.1 | -4.99 | 11.8 | 0.596 | 0.522 | 0.416 | 0.957 | 0.990 | 0.660 | |||
| post5.4 | [-] | 23.7 | 23.6 | 28.6 | 24.3 | -4.96 | 11.1 | 0.711 | 0.532 | 0.456 | 0.946 | 0.987 | 0.676 |
Download Data |
Period Mean (original grids) [W m-2] |
Model Period Mean (intersection) [W m-2] |
Benchmark Period Mean (intersection) [W m-2] |
Model Period Mean (complement) [W m-2] |
Benchmark Period Mean (complement) [W m-2] |
Bias [W m-2] |
RMSE [W m-2] |
Phase Shift [months] |
Bias Score [1] |
RMSE Score [1] |
Seasonal Cycle Score [1] |
Spatial Distribution Score [1] |
Overall Score [1] |
|||
|---|---|---|---|---|---|---|---|---|---|---|---|---|---|---|---|---|
| Benchmark | [-] | 30.9 | ||||||||||||||
| I123 | [-] | 29.0 | 28.2 | 30.9 | 51.9 | -2.20 | 11.2 | 0.829 | 0.634 | 0.599 | 0.908 | 0.983 | 0.745 | |||
| post5.4 | [-] | 27.7 | 26.9 | 30.9 | 50.1 | -3.46 | 11.6 | 0.780 | 0.588 | 0.616 | 0.919 | 0.957 | 0.739 |
Download Data |
Period Mean (original grids) [W m-2] |
Model Period Mean (intersection) [W m-2] |
Benchmark Period Mean (intersection) [W m-2] |
Model Period Mean (complement) [W m-2] |
Benchmark Period Mean (complement) [W m-2] |
Bias [W m-2] |
RMSE [W m-2] |
Phase Shift [months] |
Bias Score [1] |
RMSE Score [1] |
Seasonal Cycle Score [1] |
Spatial Distribution Score [1] |
Overall Score [1] |
|||
|---|---|---|---|---|---|---|---|---|---|---|---|---|---|---|---|---|
| Benchmark | [-] | 56.7 | ||||||||||||||
| I123 | [-] | 58.4 | 56.9 | 56.7 | 79.1 | 1.81 | 14.7 | 1.19 | 0.655 | 0.611 | 0.848 | 0.992 | 0.743 | |||
| post5.4 | [-] | 57.0 | 55.5 | 56.7 | 79.1 | 0.447 | 14.6 | 1.20 | 0.660 | 0.613 | 0.856 | 0.993 | 0.747 |
Download Data |
Period Mean (original grids) [W m-2] |
Model Period Mean (intersection) [W m-2] |
Benchmark Period Mean (intersection) [W m-2] |
Model Period Mean (complement) [W m-2] |
Benchmark Period Mean (complement) [W m-2] |
Bias [W m-2] |
RMSE [W m-2] |
Phase Shift [months] |
Bias Score [1] |
RMSE Score [1] |
Seasonal Cycle Score [1] |
Spatial Distribution Score [1] |
Overall Score [1] |
|||
|---|---|---|---|---|---|---|---|---|---|---|---|---|---|---|---|---|
| Benchmark | [-] | 16.2 | ||||||||||||||
| I123 | [-] | 15.4 | 15.7 | 16.2 | 13.5 | -0.774 | 7.38 | 0.224 | 0.780 | 0.524 | 0.985 | 0.972 | 0.757 | |||
| post5.4 | [-] | 15.5 | 15.7 | 16.2 | 13.9 | -0.741 | 6.96 | 0.405 | 0.768 | 0.556 | 0.973 | 0.981 | 0.767 |
Download Data |
Period Mean (original grids) [W m-2] |
Model Period Mean (intersection) [W m-2] |
Benchmark Period Mean (intersection) [W m-2] |
Model Period Mean (complement) [W m-2] |
Benchmark Period Mean (complement) [W m-2] |
Bias [W m-2] |
RMSE [W m-2] |
Phase Shift [months] |
Bias Score [1] |
RMSE Score [1] |
Seasonal Cycle Score [1] |
Spatial Distribution Score [1] |
Overall Score [1] |
|||
|---|---|---|---|---|---|---|---|---|---|---|---|---|---|---|---|---|
| Benchmark | [-] | 29.5 | ||||||||||||||
| I123 | [-] | 31.3 | 30.0 | 29.5 | 48.9 | 1.42 | 8.86 | 1.01 | 0.724 | 0.734 | 0.899 | 0.982 | 0.814 | |||
| post5.4 | [-] | 33.4 | 32.2 | 29.5 | 50.3 | 3.56 | 9.94 | 0.957 | 0.675 | 0.710 | 0.892 | 0.970 | 0.792 |
Download Data |
Period Mean (original grids) [W m-2] |
Model Period Mean (intersection) [W m-2] |
Benchmark Period Mean (intersection) [W m-2] |
Model Period Mean (complement) [W m-2] |
Benchmark Period Mean (complement) [W m-2] |
Bias [W m-2] |
RMSE [W m-2] |
Phase Shift [months] |
Bias Score [1] |
RMSE Score [1] |
Seasonal Cycle Score [1] |
Spatial Distribution Score [1] |
Overall Score [1] |
|||
|---|---|---|---|---|---|---|---|---|---|---|---|---|---|---|---|---|
| Benchmark | [-] | 39.3 | ||||||||||||||
| I123 | [-] | 32.3 | 32.4 | 39.3 | 31.9 | 33.0 | -6.87 | 12.7 | 0.446 | 0.505 | 0.611 | 0.970 | 0.959 | 0.731 | ||
| post5.4 | [-] | 34.6 | 34.6 | 39.3 | 34.7 | 33.0 | -4.58 | 11.4 | 0.406 | 0.602 | 0.628 | 0.972 | 0.976 | 0.761 |
Download Data |
Period Mean (original grids) [W m-2] |
Model Period Mean (intersection) [W m-2] |
Benchmark Period Mean (intersection) [W m-2] |
Model Period Mean (complement) [W m-2] |
Benchmark Period Mean (complement) [W m-2] |
Bias [W m-2] |
RMSE [W m-2] |
Phase Shift [months] |
Bias Score [1] |
RMSE Score [1] |
Seasonal Cycle Score [1] |
Spatial Distribution Score [1] |
Overall Score [1] |
|||
|---|---|---|---|---|---|---|---|---|---|---|---|---|---|---|---|---|
| Benchmark | [-] | 39.7 | ||||||||||||||
| I123 | [-] | 34.0 | 37.5 | 39.7 | 14.9 | 35.9 | -1.73 | 12.3 | 1.12 | 0.603 | 0.618 | 0.857 | 0.984 | 0.736 | ||
| post5.4 | [-] | 34.5 | 38.2 | 39.7 | 14.7 | 35.9 | -1.02 | 12.1 | 1.08 | 0.607 | 0.631 | 0.863 | 0.981 | 0.743 |
Download Data |
Period Mean (original grids) [W m-2] |
Model Period Mean (intersection) [W m-2] |
Benchmark Period Mean (intersection) [W m-2] |
Model Period Mean (complement) [W m-2] |
Benchmark Period Mean (complement) [W m-2] |
Bias [W m-2] |
RMSE [W m-2] |
Phase Shift [months] |
Bias Score [1] |
RMSE Score [1] |
Seasonal Cycle Score [1] |
Spatial Distribution Score [1] |
Overall Score [1] |
|||
|---|---|---|---|---|---|---|---|---|---|---|---|---|---|---|---|---|
| Benchmark | [-] | 10.2 | ||||||||||||||
| I123 | [-] | 10.5 | 10.2 | 10.2 | 23.2 | 8.43 | 0.333 | 7.93 | 2.07 | 0.732 | 0.732 | 0.679 | 0.941 | 0.763 | ||
| post5.4 | [-] | 9.96 | 9.68 | 10.2 | 21.7 | 8.43 | -0.181 | 7.50 | 1.98 | 0.739 | 0.750 | 0.694 | 0.947 | 0.776 |
Download Data |
Period Mean (original grids) [W m-2] |
Model Period Mean (intersection) [W m-2] |
Benchmark Period Mean (intersection) [W m-2] |
Model Period Mean (complement) [W m-2] |
Benchmark Period Mean (complement) [W m-2] |
Bias [W m-2] |
RMSE [W m-2] |
Phase Shift [months] |
Bias Score [1] |
RMSE Score [1] |
Seasonal Cycle Score [1] |
Spatial Distribution Score [1] |
Overall Score [1] |
|||
|---|---|---|---|---|---|---|---|---|---|---|---|---|---|---|---|---|
| Benchmark | [-] | 17.6 | ||||||||||||||
| I123 | [-] | 16.3 | 16.7 | 17.6 | 13.1 | -1.30 | 7.76 | 0.424 | 0.634 | 0.548 | 0.971 | 0.930 | 0.726 | |||
| post5.4 | [-] | 17.8 | 18.2 | 17.6 | 14.6 | 0.230 | 7.52 | 0.433 | 0.644 | 0.566 | 0.971 | 0.897 | 0.729 |
Download Data |
Period Mean (original grids) [W m-2] |
Model Period Mean (intersection) [W m-2] |
Benchmark Period Mean (intersection) [W m-2] |
Model Period Mean (complement) [W m-2] |
Benchmark Period Mean (complement) [W m-2] |
Bias [W m-2] |
RMSE [W m-2] |
Phase Shift [months] |
Bias Score [1] |
RMSE Score [1] |
Seasonal Cycle Score [1] |
Spatial Distribution Score [1] |
Overall Score [1] |
|||
|---|---|---|---|---|---|---|---|---|---|---|---|---|---|---|---|---|
| Benchmark | [-] | 57.1 | ||||||||||||||
| I123 | [-] | 58.4 | 56.5 | 57.1 | 69.4 | 1.31 | 15.8 | 1.01 | 0.518 | 0.672 | 0.883 | 0.901 | 0.729 | |||
| post5.4 | [-] | 59.2 | 57.1 | 57.1 | 70.7 | 2.12 | 14.9 | 0.966 | 0.578 | 0.672 | 0.892 | 0.922 | 0.747 |
Download Data |
Period Mean (original grids) [W m-2] |
Model Period Mean (intersection) [W m-2] |
Benchmark Period Mean (intersection) [W m-2] |
Model Period Mean (complement) [W m-2] |
Benchmark Period Mean (complement) [W m-2] |
Bias [W m-2] |
RMSE [W m-2] |
Phase Shift [months] |
Bias Score [1] |
RMSE Score [1] |
Seasonal Cycle Score [1] |
Spatial Distribution Score [1] |
Overall Score [1] |
|||
|---|---|---|---|---|---|---|---|---|---|---|---|---|---|---|---|---|
| Benchmark | [-] | 59.7 | ||||||||||||||
| I123 | [-] | 46.0 | 45.8 | 59.7 | 50.4 | -13.6 | 17.7 | 0.399 | 0.228 | 0.566 | 0.973 | 0.882 | 0.643 | |||
| post5.4 | [-] | 48.8 | 48.6 | 59.7 | 53.0 | -10.7 | 15.5 | 0.486 | 0.334 | 0.579 | 0.967 | 0.975 | 0.687 |
Download Data |
Period Mean (original grids) [W m-2] |
Model Period Mean (intersection) [W m-2] |
Benchmark Period Mean (intersection) [W m-2] |
Model Period Mean (complement) [W m-2] |
Benchmark Period Mean (complement) [W m-2] |
Bias [W m-2] |
RMSE [W m-2] |
Phase Shift [months] |
Bias Score [1] |
RMSE Score [1] |
Seasonal Cycle Score [1] |
Spatial Distribution Score [1] |
Overall Score [1] |
|||
|---|---|---|---|---|---|---|---|---|---|---|---|---|---|---|---|---|
| Benchmark | [-] | 32.3 | ||||||||||||||
| I123 | [-] | 29.9 | 29.4 | 32.3 | 37.7 | -2.63 | 10.4 | 0.608 | 0.687 | 0.541 | 0.955 | 0.990 | 0.743 | |||
| post5.4 | [-] | 30.5 | 30.0 | 32.3 | 39.4 | -1.97 | 9.60 | 0.715 | 0.721 | 0.579 | 0.950 | 0.990 | 0.764 |
Download Data |
Period Mean (original grids) [W m-2] |
Model Period Mean (intersection) [W m-2] |
Benchmark Period Mean (intersection) [W m-2] |
Model Period Mean (complement) [W m-2] |
Benchmark Period Mean (complement) [W m-2] |
Bias [W m-2] |
RMSE [W m-2] |
Phase Shift [months] |
Bias Score [1] |
RMSE Score [1] |
Seasonal Cycle Score [1] |
Spatial Distribution Score [1] |
Overall Score [1] |
|||
|---|---|---|---|---|---|---|---|---|---|---|---|---|---|---|---|---|
| Benchmark | [-] | 31.4 | ||||||||||||||
| I123 | [-] | 27.4 | 27.5 | 31.4 | 43.7 | -3.74 | 10.4 | 0.738 | 0.672 | 0.629 | 0.921 | 0.988 | 0.768 | |||
| post5.4 | [-] | 26.7 | 26.9 | 31.4 | 40.5 | -4.27 | 10.1 | 0.754 | 0.667 | 0.650 | 0.918 | 0.992 | 0.776 |
Download Data |
Period Mean (original grids) [W m-2] |
Model Period Mean (intersection) [W m-2] |
Benchmark Period Mean (intersection) [W m-2] |
Model Period Mean (complement) [W m-2] |
Benchmark Period Mean (complement) [W m-2] |
Bias [W m-2] |
RMSE [W m-2] |
Phase Shift [months] |
Bias Score [1] |
RMSE Score [1] |
Seasonal Cycle Score [1] |
Spatial Distribution Score [1] |
Overall Score [1] |
|||
|---|---|---|---|---|---|---|---|---|---|---|---|---|---|---|---|---|
| Benchmark | [-] | 86.4 | ||||||||||||||
| I123 | [-] | 87.5 | 87.6 | 86.4 | 86.7 | 1.20 | 12.1 | 1.61 | 0.630 | 0.804 | 0.776 | 0.722 | 0.747 | |||
| post5.4 | [-] | 92.1 | 92.2 | 86.4 | 88.5 | 5.85 | 13.7 | 1.31 | 0.620 | 0.785 | 0.827 | 0.639 | 0.731 |
Download Data |
Period Mean (original grids) [W m-2] |
Model Period Mean (intersection) [W m-2] |
Benchmark Period Mean (intersection) [W m-2] |
Model Period Mean (complement) [W m-2] |
Benchmark Period Mean (complement) [W m-2] |
Bias [W m-2] |
RMSE [W m-2] |
Phase Shift [months] |
Bias Score [1] |
RMSE Score [1] |
Seasonal Cycle Score [1] |
Spatial Distribution Score [1] |
Overall Score [1] |
|||
|---|---|---|---|---|---|---|---|---|---|---|---|---|---|---|---|---|
| Benchmark | [-] | 68.6 | ||||||||||||||
| I123 | [-] | 58.5 | 58.1 | 68.6 | 61.7 | -10.7 | 16.0 | 1.09 | 0.494 | 0.690 | 0.887 | 0.963 | 0.745 | |||
| post5.4 | [-] | 60.8 | 60.5 | 68.6 | 63.1 | -8.35 | 15.0 | 1.12 | 0.565 | 0.678 | 0.878 | 0.953 | 0.751 |
Download Data |
Period Mean (original grids) [W m-2] |
Model Period Mean (intersection) [W m-2] |
Benchmark Period Mean (intersection) [W m-2] |
Model Period Mean (complement) [W m-2] |
Benchmark Period Mean (complement) [W m-2] |
Bias [W m-2] |
RMSE [W m-2] |
Phase Shift [months] |
Bias Score [1] |
RMSE Score [1] |
Seasonal Cycle Score [1] |
Spatial Distribution Score [1] |
Overall Score [1] |
|||
|---|---|---|---|---|---|---|---|---|---|---|---|---|---|---|---|---|
| Benchmark | [-] | 31.5 | ||||||||||||||
| I123 | [-] | 26.5 | 26.7 | 31.5 | 24.2 | 16.6 | -4.61 | 14.9 | 1.05 | 0.333 | 0.655 | 0.875 | 0.739 | 0.651 | ||
| post5.4 | [-] | 27.5 | 27.5 | 31.5 | 26.1 | 16.6 | -3.80 | 15.2 | 1.14 | 0.347 | 0.636 | 0.858 | 0.717 | 0.639 |
Temporally integrated period mean