Mean State
Download Data |
Period Mean (original grids) [W m-2] |
Model Period Mean (intersection) [W m-2] |
Benchmark Period Mean (intersection) [W m-2] |
Model Period Mean (complement) [W m-2] |
Benchmark Period Mean (complement) [W m-2] |
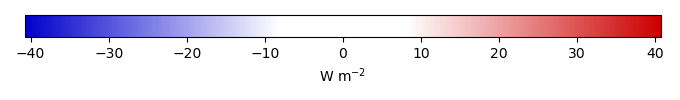
Bias [W m-2] |
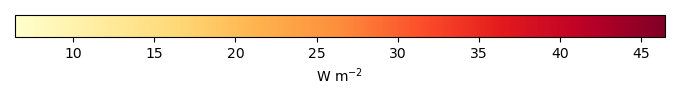
RMSE [W m-2] |
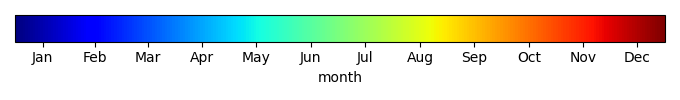
Phase Shift [months] |
Bias Score [1] |
RMSE Score [1] |
Seasonal Cycle Score [1] |
Spatial Distribution Score [1] |
Overall Score [1] |
|||
|---|---|---|---|---|---|---|---|---|---|---|---|---|---|---|---|---|
| Benchmark | [-] | 108. | ||||||||||||||
| I123 | [-] | 121. | 122. | 108. | 113. | 12.9 | 24.1 | 3.15 | 0.368 | 0.283 | 0.490 | 0.998 | 0.484 | |||
| post5.4 | [-] | 116. | 117. | 108. | 111. | 8.05 | 24.8 | 3.13 | 0.473 | 0.222 | 0.498 | 0.990 | 0.481 |
Download Data |
Period Mean (original grids) [W m-2] |
Model Period Mean (intersection) [W m-2] |
Benchmark Period Mean (intersection) [W m-2] |
Model Period Mean (complement) [W m-2] |
Benchmark Period Mean (complement) [W m-2] |
Bias [W m-2] |
RMSE [W m-2] |
Phase Shift [months] |
Bias Score [1] |
RMSE Score [1] |
Seasonal Cycle Score [1] |
Spatial Distribution Score [1] |
Overall Score [1] |
|||
|---|---|---|---|---|---|---|---|---|---|---|---|---|---|---|---|---|
| Benchmark | [-] | 98.5 | ||||||||||||||
| I123 | [-] | 104. | 103. | 98.5 | 110. | 4.44 | 24.0 | 2.17 | 0.476 | 0.228 | 0.654 | 0.975 | 0.512 | |||
| post5.4 | [-] | 103. | 103. | 98.5 | 111. | 4.20 | 25.8 | 1.99 | 0.460 | 0.203 | 0.696 | 0.985 | 0.509 |
Download Data |
Period Mean (original grids) [W m-2] |
Model Period Mean (intersection) [W m-2] |
Benchmark Period Mean (intersection) [W m-2] |
Model Period Mean (complement) [W m-2] |
Benchmark Period Mean (complement) [W m-2] |
Bias [W m-2] |
RMSE [W m-2] |
Phase Shift [months] |
Bias Score [1] |
RMSE Score [1] |
Seasonal Cycle Score [1] |
Spatial Distribution Score [1] |
Overall Score [1] |
|||
|---|---|---|---|---|---|---|---|---|---|---|---|---|---|---|---|---|
| Benchmark | [-] | 105. | ||||||||||||||
| I123 | [-] | 111. | 110. | 105. | 121. | 4.75 | 14.7 | 1.89 | 0.584 | 0.556 | 0.712 | 0.980 | 0.678 | |||
| post5.4 | [-] | 108. | 106. | 105. | 118. | 1.51 | 16.4 | 1.75 | 0.495 | 0.525 | 0.744 | 0.971 | 0.652 |
Download Data |
Period Mean (original grids) [W m-2] |
Model Period Mean (intersection) [W m-2] |
Benchmark Period Mean (intersection) [W m-2] |
Model Period Mean (complement) [W m-2] |
Benchmark Period Mean (complement) [W m-2] |
Bias [W m-2] |
RMSE [W m-2] |
Phase Shift [months] |
Bias Score [1] |
RMSE Score [1] |
Seasonal Cycle Score [1] |
Spatial Distribution Score [1] |
Overall Score [1] |
|||
|---|---|---|---|---|---|---|---|---|---|---|---|---|---|---|---|---|
| Benchmark | [-] | 20.1 | ||||||||||||||
| I123 | [-] | 26.1 | 27.0 | 20.1 | 22.0 | 6.81 | 19.9 | 0.285 | 0.603 | 0.262 | 0.981 | 0.981 | 0.618 | |||
| post5.4 | [-] | 26.8 | 27.6 | 20.1 | 23.1 | 7.42 | 19.4 | 0.270 | 0.577 | 0.280 | 0.982 | 0.960 | 0.616 |
Download Data |
Period Mean (original grids) [W m-2] |
Model Period Mean (intersection) [W m-2] |
Benchmark Period Mean (intersection) [W m-2] |
Model Period Mean (complement) [W m-2] |
Benchmark Period Mean (complement) [W m-2] |
Bias [W m-2] |
RMSE [W m-2] |
Phase Shift [months] |
Bias Score [1] |
RMSE Score [1] |
Seasonal Cycle Score [1] |
Spatial Distribution Score [1] |
Overall Score [1] |
|||
|---|---|---|---|---|---|---|---|---|---|---|---|---|---|---|---|---|
| Benchmark | [-] | 112. | ||||||||||||||
| I123 | [-] | 152. | 152. | 112. | 150. | 40.2 | 42.2 | 3.26 | 0.0372 | 0.623 | 0.465 | 0.979 | 0.546 | |||
| post5.4 | [-] | 142. | 141. | 112. | 144. | 29.1 | 34.3 | 3.11 | 0.204 | 0.550 | 0.493 | 0.825 | 0.524 |
Download Data |
Period Mean (original grids) [W m-2] |
Model Period Mean (intersection) [W m-2] |
Benchmark Period Mean (intersection) [W m-2] |
Model Period Mean (complement) [W m-2] |
Benchmark Period Mean (complement) [W m-2] |
Bias [W m-2] |
RMSE [W m-2] |
Phase Shift [months] |
Bias Score [1] |
RMSE Score [1] |
Seasonal Cycle Score [1] |
Spatial Distribution Score [1] |
Overall Score [1] |
|||
|---|---|---|---|---|---|---|---|---|---|---|---|---|---|---|---|---|
| Benchmark | [-] | 37.0 | ||||||||||||||
| I123 | [-] | 46.9 | 46.8 | 37.0 | 46.9 | 9.80 | 22.2 | 0.422 | 0.397 | 0.208 | 0.969 | 0.875 | 0.531 | |||
| post5.4 | [-] | 44.6 | 44.5 | 37.0 | 44.1 | 7.51 | 19.9 | 0.440 | 0.488 | 0.277 | 0.968 | 0.891 | 0.580 |
Download Data |
Period Mean (original grids) [W m-2] |
Model Period Mean (intersection) [W m-2] |
Benchmark Period Mean (intersection) [W m-2] |
Model Period Mean (complement) [W m-2] |
Benchmark Period Mean (complement) [W m-2] |
Bias [W m-2] |
RMSE [W m-2] |
Phase Shift [months] |
Bias Score [1] |
RMSE Score [1] |
Seasonal Cycle Score [1] |
Spatial Distribution Score [1] |
Overall Score [1] |
|||
|---|---|---|---|---|---|---|---|---|---|---|---|---|---|---|---|---|
| Benchmark | [-] | 54.8 | ||||||||||||||
| I123 | [-] | 67.9 | 66.6 | 54.8 | 81.2 | 12.1 | 24.1 | 0.840 | 0.178 | 0.297 | 0.919 | 0.965 | 0.531 | |||
| post5.4 | [-] | 62.6 | 61.5 | 54.8 | 74.3 | 6.91 | 20.1 | 0.737 | 0.358 | 0.375 | 0.931 | 0.981 | 0.604 |
Download Data |
Period Mean (original grids) [W m-2] |
Model Period Mean (intersection) [W m-2] |
Benchmark Period Mean (intersection) [W m-2] |
Model Period Mean (complement) [W m-2] |
Benchmark Period Mean (complement) [W m-2] |
Bias [W m-2] |
RMSE [W m-2] |
Phase Shift [months] |
Bias Score [1] |
RMSE Score [1] |
Seasonal Cycle Score [1] |
Spatial Distribution Score [1] |
Overall Score [1] |
|||
|---|---|---|---|---|---|---|---|---|---|---|---|---|---|---|---|---|
| Benchmark | [-] | 90.0 | ||||||||||||||
| I123 | [-] | 103. | 100. | 90.0 | 120. | 10.6 | 22.0 | 1.77 | 0.420 | 0.331 | 0.733 | 0.958 | 0.555 | |||
| post5.4 | [-] | 97.8 | 94.6 | 90.0 | 117. | 5.14 | 19.7 | 1.59 | 0.570 | 0.347 | 0.774 | 0.967 | 0.601 |
Download Data |
Period Mean (original grids) [W m-2] |
Model Period Mean (intersection) [W m-2] |
Benchmark Period Mean (intersection) [W m-2] |
Model Period Mean (complement) [W m-2] |
Benchmark Period Mean (complement) [W m-2] |
Bias [W m-2] |
RMSE [W m-2] |
Phase Shift [months] |
Bias Score [1] |
RMSE Score [1] |
Seasonal Cycle Score [1] |
Spatial Distribution Score [1] |
Overall Score [1] |
|||
|---|---|---|---|---|---|---|---|---|---|---|---|---|---|---|---|---|
| Benchmark | [-] | 18.4 | ||||||||||||||
| I123 | [-] | 20.3 | 21.9 | 18.4 | 13.7 | 3.42 | 17.9 | 0.364 | 0.716 | 0.310 | 0.976 | 0.920 | 0.646 | |||
| post5.4 | [-] | 19.8 | 21.3 | 18.4 | 14.0 | 2.80 | 17.8 | 0.446 | 0.712 | 0.309 | 0.970 | 0.926 | 0.645 |
Download Data |
Period Mean (original grids) [W m-2] |
Model Period Mean (intersection) [W m-2] |
Benchmark Period Mean (intersection) [W m-2] |
Model Period Mean (complement) [W m-2] |
Benchmark Period Mean (complement) [W m-2] |
Bias [W m-2] |
RMSE [W m-2] |
Phase Shift [months] |
Bias Score [1] |
RMSE Score [1] |
Seasonal Cycle Score [1] |
Spatial Distribution Score [1] |
Overall Score [1] |
|||
|---|---|---|---|---|---|---|---|---|---|---|---|---|---|---|---|---|
| Benchmark | [-] | 91.7 | ||||||||||||||
| I123 | [-] | 106. | 105. | 91.7 | 116. | 14.0 | 19.0 | 0.696 | 0.358 | 0.557 | 0.941 | 0.997 | 0.682 | |||
| post5.4 | [-] | 102. | 101. | 91.7 | 112. | 9.59 | 14.7 | 0.729 | 0.518 | 0.627 | 0.940 | 0.998 | 0.742 |
Download Data |
Period Mean (original grids) [W m-2] |
Model Period Mean (intersection) [W m-2] |
Benchmark Period Mean (intersection) [W m-2] |
Model Period Mean (complement) [W m-2] |
Benchmark Period Mean (complement) [W m-2] |
Bias [W m-2] |
RMSE [W m-2] |
Phase Shift [months] |
Bias Score [1] |
RMSE Score [1] |
Seasonal Cycle Score [1] |
Spatial Distribution Score [1] |
Overall Score [1] |
|||
|---|---|---|---|---|---|---|---|---|---|---|---|---|---|---|---|---|
| Benchmark | [-] | 44.4 | ||||||||||||||
| I123 | [-] | 64.1 | 64.6 | 44.4 | 61.5 | 66.8 | 20.5 | 27.9 | 0.408 | 0.0365 | 0.196 | 0.969 | 0.982 | 0.476 | ||
| post5.4 | [-] | 62.0 | 62.6 | 44.4 | 59.2 | 66.8 | 18.4 | 26.3 | 0.345 | 0.0615 | 0.190 | 0.975 | 0.994 | 0.482 |
Download Data |
Period Mean (original grids) [W m-2] |
Model Period Mean (intersection) [W m-2] |
Benchmark Period Mean (intersection) [W m-2] |
Model Period Mean (complement) [W m-2] |
Benchmark Period Mean (complement) [W m-2] |
Bias [W m-2] |
RMSE [W m-2] |
Phase Shift [months] |
Bias Score [1] |
RMSE Score [1] |
Seasonal Cycle Score [1] |
Spatial Distribution Score [1] |
Overall Score [1] |
|||
|---|---|---|---|---|---|---|---|---|---|---|---|---|---|---|---|---|
| Benchmark | [-] | 72.3 | ||||||||||||||
| I123 | [-] | 69.1 | 79.3 | 72.3 | 30.1 | 66.8 | 7.26 | 20.8 | 1.14 | 0.413 | 0.386 | 0.850 | 0.989 | 0.605 | ||
| post5.4 | [-] | 67.3 | 77.0 | 72.3 | 30.0 | 66.8 | 4.94 | 19.6 | 1.08 | 0.454 | 0.405 | 0.861 | 0.991 | 0.623 |
Download Data |
Period Mean (original grids) [W m-2] |
Model Period Mean (intersection) [W m-2] |
Benchmark Period Mean (intersection) [W m-2] |
Model Period Mean (complement) [W m-2] |
Benchmark Period Mean (complement) [W m-2] |
Bias [W m-2] |
RMSE [W m-2] |
Phase Shift [months] |
Bias Score [1] |
RMSE Score [1] |
Seasonal Cycle Score [1] |
Spatial Distribution Score [1] |
Overall Score [1] |
|||
|---|---|---|---|---|---|---|---|---|---|---|---|---|---|---|---|---|
| Benchmark | [-] | 57.6 | ||||||||||||||
| I123 | [-] | 54.5 | 53.5 | 57.6 | 75.9 | -3.55 | 17.5 | 1.22 | 0.416 | 0.586 | 0.849 | 0.820 | 0.651 | |||
| post5.4 | [-] | 53.1 | 52.3 | 57.6 | 71.0 | -4.85 | 16.0 | 1.05 | 0.434 | 0.626 | 0.870 | 0.881 | 0.687 |
Download Data |
Period Mean (original grids) [W m-2] |
Model Period Mean (intersection) [W m-2] |
Benchmark Period Mean (intersection) [W m-2] |
Model Period Mean (complement) [W m-2] |
Benchmark Period Mean (complement) [W m-2] |
Bias [W m-2] |
RMSE [W m-2] |
Phase Shift [months] |
Bias Score [1] |
RMSE Score [1] |
Seasonal Cycle Score [1] |
Spatial Distribution Score [1] |
Overall Score [1] |
|||
|---|---|---|---|---|---|---|---|---|---|---|---|---|---|---|---|---|
| Benchmark | [-] | 23.5 | ||||||||||||||
| I123 | [-] | 26.0 | 29.3 | 23.5 | 18.3 | 5.22 | 22.9 | 0.206 | 0.540 | 0.172 | 0.985 | 0.766 | 0.527 | |||
| post5.4 | [-] | 27.4 | 30.4 | 23.5 | 20.3 | 6.29 | 23.1 | 0.187 | 0.521 | 0.169 | 0.987 | 0.812 | 0.532 |
Download Data |
Period Mean (original grids) [W m-2] |
Model Period Mean (intersection) [W m-2] |
Benchmark Period Mean (intersection) [W m-2] |
Model Period Mean (complement) [W m-2] |
Benchmark Period Mean (complement) [W m-2] |
Bias [W m-2] |
RMSE [W m-2] |
Phase Shift [months] |
Bias Score [1] |
RMSE Score [1] |
Seasonal Cycle Score [1] |
Spatial Distribution Score [1] |
Overall Score [1] |
|||
|---|---|---|---|---|---|---|---|---|---|---|---|---|---|---|---|---|
| Benchmark | [-] | 98.2 | ||||||||||||||
| I123 | [-] | 113. | 108. | 98.2 | 128. | 11.6 | 24.2 | 1.25 | 0.427 | 0.391 | 0.840 | 0.599 | 0.530 | |||
| post5.4 | [-] | 110. | 104. | 98.2 | 125. | 7.81 | 24.1 | 1.49 | 0.458 | 0.339 | 0.796 | 0.650 | 0.517 |
Download Data |
Period Mean (original grids) [W m-2] |
Model Period Mean (intersection) [W m-2] |
Benchmark Period Mean (intersection) [W m-2] |
Model Period Mean (complement) [W m-2] |
Benchmark Period Mean (complement) [W m-2] |
Bias [W m-2] |
RMSE [W m-2] |
Phase Shift [months] |
Bias Score [1] |
RMSE Score [1] |
Seasonal Cycle Score [1] |
Spatial Distribution Score [1] |
Overall Score [1] |
|||
|---|---|---|---|---|---|---|---|---|---|---|---|---|---|---|---|---|
| Benchmark | [-] | 75.4 | ||||||||||||||
| I123 | [-] | 78.4 | 78.1 | 75.4 | 80.9 | 3.06 | 17.0 | 0.501 | 0.691 | 0.306 | 0.966 | 0.968 | 0.647 | |||
| post5.4 | [-] | 82.8 | 82.6 | 75.4 | 85.3 | 7.66 | 18.0 | 0.507 | 0.489 | 0.313 | 0.965 | 0.999 | 0.616 |
Download Data |
Period Mean (original grids) [W m-2] |
Model Period Mean (intersection) [W m-2] |
Benchmark Period Mean (intersection) [W m-2] |
Model Period Mean (complement) [W m-2] |
Benchmark Period Mean (complement) [W m-2] |
Bias [W m-2] |
RMSE [W m-2] |
Phase Shift [months] |
Bias Score [1] |
RMSE Score [1] |
Seasonal Cycle Score [1] |
Spatial Distribution Score [1] |
Overall Score [1] |
|||
|---|---|---|---|---|---|---|---|---|---|---|---|---|---|---|---|---|
| Benchmark | [-] | 44.3 | ||||||||||||||
| I123 | [-] | 61.2 | 60.9 | 44.3 | 63.1 | 16.4 | 26.7 | 0.301 | 0.155 | 0.148 | 0.980 | 0.968 | 0.480 | |||
| post5.4 | [-] | 59.7 | 59.2 | 44.3 | 62.8 | 14.8 | 25.0 | 0.307 | 0.214 | 0.172 | 0.979 | 0.967 | 0.501 |
Download Data |
Period Mean (original grids) [W m-2] |
Model Period Mean (intersection) [W m-2] |
Benchmark Period Mean (intersection) [W m-2] |
Model Period Mean (complement) [W m-2] |
Benchmark Period Mean (complement) [W m-2] |
Bias [W m-2] |
RMSE [W m-2] |
Phase Shift [months] |
Bias Score [1] |
RMSE Score [1] |
Seasonal Cycle Score [1] |
Spatial Distribution Score [1] |
Overall Score [1] |
|||
|---|---|---|---|---|---|---|---|---|---|---|---|---|---|---|---|---|
| Benchmark | [-] | 66.6 | ||||||||||||||
| I123 | [-] | 69.0 | 69.1 | 66.6 | 78.8 | 2.72 | 16.3 | 0.495 | 0.618 | 0.418 | 0.967 | 0.933 | 0.671 | |||
| post5.4 | [-] | 67.2 | 67.4 | 66.6 | 74.0 | 0.981 | 14.0 | 0.502 | 0.649 | 0.497 | 0.966 | 0.977 | 0.717 |
Download Data |
Period Mean (original grids) [W m-2] |
Model Period Mean (intersection) [W m-2] |
Benchmark Period Mean (intersection) [W m-2] |
Model Period Mean (complement) [W m-2] |
Benchmark Period Mean (complement) [W m-2] |
Bias [W m-2] |
RMSE [W m-2] |
Phase Shift [months] |
Bias Score [1] |
RMSE Score [1] |
Seasonal Cycle Score [1] |
Spatial Distribution Score [1] |
Overall Score [1] |
|||
|---|---|---|---|---|---|---|---|---|---|---|---|---|---|---|---|---|
| Benchmark | [-] | 116. | ||||||||||||||
| I123 | [-] | 123. | 123. | 116. | 127. | 6.81 | 17.9 | 1.61 | 0.566 | 0.508 | 0.769 | 0.997 | 0.670 | |||
| post5.4 | [-] | 120. | 120. | 116. | 128. | 3.88 | 20.6 | 1.58 | 0.462 | 0.460 | 0.774 | 0.855 | 0.602 |
Download Data |
Period Mean (original grids) [W m-2] |
Model Period Mean (intersection) [W m-2] |
Benchmark Period Mean (intersection) [W m-2] |
Model Period Mean (complement) [W m-2] |
Benchmark Period Mean (complement) [W m-2] |
Bias [W m-2] |
RMSE [W m-2] |
Phase Shift [months] |
Bias Score [1] |
RMSE Score [1] |
Seasonal Cycle Score [1] |
Spatial Distribution Score [1] |
Overall Score [1] |
|||
|---|---|---|---|---|---|---|---|---|---|---|---|---|---|---|---|---|
| Benchmark | [-] | 111. | ||||||||||||||
| I123 | [-] | 107. | 107. | 111. | 109. | -4.48 | 14.3 | 1.47 | 0.623 | 0.527 | 0.802 | 0.994 | 0.695 | |||
| post5.4 | [-] | 108. | 108. | 111. | 106. | -3.95 | 14.1 | 1.43 | 0.616 | 0.537 | 0.809 | 0.999 | 0.700 |
Download Data |
Period Mean (original grids) [W m-2] |
Model Period Mean (intersection) [W m-2] |
Benchmark Period Mean (intersection) [W m-2] |
Model Period Mean (complement) [W m-2] |
Benchmark Period Mean (complement) [W m-2] |
Bias [W m-2] |
RMSE [W m-2] |
Phase Shift [months] |
Bias Score [1] |
RMSE Score [1] |
Seasonal Cycle Score [1] |
Spatial Distribution Score [1] |
Overall Score [1] |
|||
|---|---|---|---|---|---|---|---|---|---|---|---|---|---|---|---|---|
| Benchmark | [-] | 80.4 | ||||||||||||||
| I123 | [-] | 82.3 | 81.7 | 80.4 | 84.4 | 1.84 | 21.9 | 0.724 | 0.362 | 0.430 | 0.921 | 0.980 | 0.625 | |||
| post5.4 | [-] | 86.5 | 85.8 | 80.4 | 88.7 | 5.89 | 21.8 | 0.934 | 0.423 | 0.417 | 0.896 | 0.983 | 0.627 |
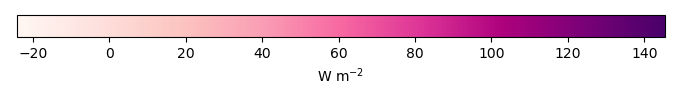
Temporally integrated period mean