Mean State
Download Data |
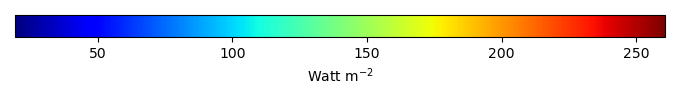
Period Mean (original grids) [Watt m-2] |
Model Period Mean (intersection) [Watt m-2] |
Benchmark Period Mean (intersection) [Watt m-2] |
Model Period Mean (complement) [Watt m-2] |
Benchmark Period Mean (complement) [Watt m-2] |
Bias [Watt m-2] |
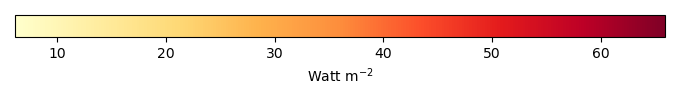
RMSE [Watt m-2] |
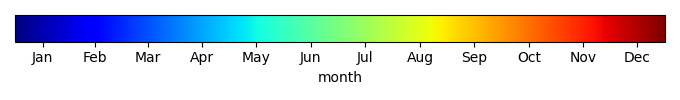
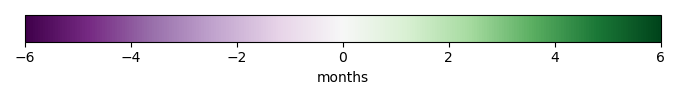
Phase Shift [months] |
Bias Score [1] |
RMSE Score [1] |
Seasonal Cycle Score [1] |
Spatial Distribution Score [1] |
Overall Score [1] |
|||
|---|---|---|---|---|---|---|---|---|---|---|---|---|---|---|---|---|
| Benchmark | [-] | 179. | ||||||||||||||
| I123 | [-] | 189. | 189. | 178. | 218. | 9.62 | 27.2 | 2.13 | 0.391 | 0.324 | 0.690 | 0.975 | 0.541 | |||
| post5.4 | [-] | 182. | 181. | 179. | 218. | 1.48 | 29.3 | 2.11 | 0.478 | 0.223 | 0.706 | 0.948 | 0.516 |
Download Data |
Period Mean (original grids) [Watt m-2] |
Model Period Mean (intersection) [Watt m-2] |
Benchmark Period Mean (intersection) [Watt m-2] |
Model Period Mean (complement) [Watt m-2] |
Benchmark Period Mean (complement) [Watt m-2] |
Bias [Watt m-2] |
RMSE [Watt m-2] |
Phase Shift [months] |
Bias Score [1] |
RMSE Score [1] |
Seasonal Cycle Score [1] |
Spatial Distribution Score [1] |
Overall Score [1] |
|||
|---|---|---|---|---|---|---|---|---|---|---|---|---|---|---|---|---|
| Benchmark | [-] | 189. | ||||||||||||||
| I123 | [-] | 199. | 199. | 189. | 210. | 10.8 | 29.5 | 2.04 | 0.355 | 0.147 | 0.700 | 0.898 | 0.449 | |||
| post5.4 | [-] | 196. | 196. | 190. | 209. | 6.05 | 30.3 | 2.19 | 0.397 | 0.123 | 0.670 | 0.912 | 0.445 |
Download Data |
Period Mean (original grids) [Watt m-2] |
Model Period Mean (intersection) [Watt m-2] |
Benchmark Period Mean (intersection) [Watt m-2] |
Model Period Mean (complement) [Watt m-2] |
Benchmark Period Mean (complement) [Watt m-2] |
Bias [Watt m-2] |
RMSE [Watt m-2] |
Phase Shift [months] |
Bias Score [1] |
RMSE Score [1] |
Seasonal Cycle Score [1] |
Spatial Distribution Score [1] |
Overall Score [1] |
|||
|---|---|---|---|---|---|---|---|---|---|---|---|---|---|---|---|---|
| Benchmark | [-] | 194. | ||||||||||||||
| I123 | [-] | 198. | 198. | 193. | 223. | 5.08 | 21.9 | 1.53 | 0.480 | 0.419 | 0.781 | 0.869 | 0.594 | |||
| post5.4 | [-] | 193. | 194. | 195. | 224. | -1.12 | 23.5 | 1.76 | 0.490 | 0.352 | 0.737 | 0.944 | 0.575 |
Download Data |
Period Mean (original grids) [Watt m-2] |
Model Period Mean (intersection) [Watt m-2] |
Benchmark Period Mean (intersection) [Watt m-2] |
Model Period Mean (complement) [Watt m-2] |
Benchmark Period Mean (complement) [Watt m-2] |
Bias [Watt m-2] |
RMSE [Watt m-2] |
Phase Shift [months] |
Bias Score [1] |
RMSE Score [1] |
Seasonal Cycle Score [1] |
Spatial Distribution Score [1] |
Overall Score [1] |
|||
|---|---|---|---|---|---|---|---|---|---|---|---|---|---|---|---|---|
| Benchmark | [-] | 81.3 | ||||||||||||||
| I123 | [-] | 67.8 | 67.9 | 81.3 | 84.8 | -14.2 | 17.2 | 0.214 | 0.319 | 0.535 | 0.986 | 0.990 | 0.673 | |||
| post5.4 | [-] | 68.3 | 68.4 | 81.2 | 85.0 | -13.3 | 17.1 | 0.183 | 0.344 | 0.507 | 0.988 | 0.998 | 0.669 |
Download Data |
Period Mean (original grids) [Watt m-2] |
Model Period Mean (intersection) [Watt m-2] |
Benchmark Period Mean (intersection) [Watt m-2] |
Model Period Mean (complement) [Watt m-2] |
Benchmark Period Mean (complement) [Watt m-2] |
Bias [Watt m-2] |
RMSE [Watt m-2] |
Phase Shift [months] |
Bias Score [1] |
RMSE Score [1] |
Seasonal Cycle Score [1] |
Spatial Distribution Score [1] |
Overall Score [1] |
|||
|---|---|---|---|---|---|---|---|---|---|---|---|---|---|---|---|---|
| Benchmark | [-] | 189. | ||||||||||||||
| I123 | [-] | 202. | 202. | 188. | 215. | 15.6 | 26.8 | 1.83 | 0.173 | 0.676 | 0.725 | 0.755 | 0.601 | |||
| post5.4 | [-] | 190. | 190. | 186. | 215. | 7.71 | 24.7 | 2.00 | 0.316 | 0.617 | 0.690 | 0.883 | 0.625 |
Download Data |
Period Mean (original grids) [Watt m-2] |
Model Period Mean (intersection) [Watt m-2] |
Benchmark Period Mean (intersection) [Watt m-2] |
Model Period Mean (complement) [Watt m-2] |
Benchmark Period Mean (complement) [Watt m-2] |
Bias [Watt m-2] |
RMSE [Watt m-2] |
Phase Shift [months] |
Bias Score [1] |
RMSE Score [1] |
Seasonal Cycle Score [1] |
Spatial Distribution Score [1] |
Overall Score [1] |
|||
|---|---|---|---|---|---|---|---|---|---|---|---|---|---|---|---|---|
| Benchmark | [-] | 105. | ||||||||||||||
| I123 | [-] | 97.5 | 97.4 | 105. | 130. | -6.93 | 16.5 | 0.248 | 0.535 | 0.446 | 0.984 | 0.995 | 0.681 | |||
| post5.4 | [-] | 96.6 | 96.4 | 104. | 129. | -7.37 | 16.3 | 0.315 | 0.512 | 0.468 | 0.979 | 0.992 | 0.684 |
Download Data |
Period Mean (original grids) [Watt m-2] |
Model Period Mean (intersection) [Watt m-2] |
Benchmark Period Mean (intersection) [Watt m-2] |
Model Period Mean (complement) [Watt m-2] |
Benchmark Period Mean (complement) [Watt m-2] |
Bias [Watt m-2] |
RMSE [Watt m-2] |
Phase Shift [months] |
Bias Score [1] |
RMSE Score [1] |
Seasonal Cycle Score [1] |
Spatial Distribution Score [1] |
Overall Score [1] |
|||
|---|---|---|---|---|---|---|---|---|---|---|---|---|---|---|---|---|
| Benchmark | [-] | 140. | ||||||||||||||
| I123 | [-] | 144. | 143. | 140. | 166. | 4.17 | 20.7 | 0.582 | 0.424 | 0.354 | 0.948 | 0.941 | 0.604 | |||
| post5.4 | [-] | 140. | 140. | 139. | 166. | 1.52 | 18.4 | 0.574 | 0.461 | 0.403 | 0.947 | 0.921 | 0.627 |
Download Data |
Period Mean (original grids) [Watt m-2] |
Model Period Mean (intersection) [Watt m-2] |
Benchmark Period Mean (intersection) [Watt m-2] |
Model Period Mean (complement) [Watt m-2] |
Benchmark Period Mean (complement) [Watt m-2] |
Bias [Watt m-2] |
RMSE [Watt m-2] |
Phase Shift [months] |
Bias Score [1] |
RMSE Score [1] |
Seasonal Cycle Score [1] |
Spatial Distribution Score [1] |
Overall Score [1] |
|||
|---|---|---|---|---|---|---|---|---|---|---|---|---|---|---|---|---|
| Benchmark | [-] | 180. | ||||||||||||||
| I123 | [-] | 185. | 185. | 180. | 216. | 6.77 | 24.1 | 0.696 | 0.340 | 0.400 | 0.947 | 0.949 | 0.607 | |||
| post5.4 | [-] | 182. | 182. | 178. | 216. | 4.90 | 23.7 | 0.669 | 0.367 | 0.404 | 0.951 | 0.978 | 0.621 |
Download Data |
Period Mean (original grids) [Watt m-2] |
Model Period Mean (intersection) [Watt m-2] |
Benchmark Period Mean (intersection) [Watt m-2] |
Model Period Mean (complement) [Watt m-2] |
Benchmark Period Mean (complement) [Watt m-2] |
Bias [Watt m-2] |
RMSE [Watt m-2] |
Phase Shift [months] |
Bias Score [1] |
RMSE Score [1] |
Seasonal Cycle Score [1] |
Spatial Distribution Score [1] |
Overall Score [1] |
|||
|---|---|---|---|---|---|---|---|---|---|---|---|---|---|---|---|---|
| Benchmark | [-] | 74.6 | ||||||||||||||
| I123 | [-] | 61.8 | 62.2 | 74.5 | 81.8 | -13.9 | 15.2 | 0.292 | 0.334 | 0.465 | 0.981 | 0.945 | 0.638 | |||
| post5.4 | [-] | 60.9 | 61.4 | 74.5 | 82.4 | -14.5 | 16.0 | 0.363 | 0.301 | 0.446 | 0.976 | 0.961 | 0.626 |
Download Data |
Period Mean (original grids) [Watt m-2] |
Model Period Mean (intersection) [Watt m-2] |
Benchmark Period Mean (intersection) [Watt m-2] |
Model Period Mean (complement) [Watt m-2] |
Benchmark Period Mean (complement) [Watt m-2] |
Bias [Watt m-2] |
RMSE [Watt m-2] |
Phase Shift [months] |
Bias Score [1] |
RMSE Score [1] |
Seasonal Cycle Score [1] |
Spatial Distribution Score [1] |
Overall Score [1] |
|||
|---|---|---|---|---|---|---|---|---|---|---|---|---|---|---|---|---|
| Benchmark | [-] | 193. | ||||||||||||||
| I123 | [-] | 203. | 203. | 193. | 219. | 7.61 | 18.0 | 0.528 | 0.350 | 0.589 | 0.950 | 0.946 | 0.685 | |||
| post5.4 | [-] | 199. | 199. | 191. | 218. | 6.61 | 17.2 | 0.730 | 0.367 | 0.595 | 0.938 | 0.931 | 0.685 |
Download Data |
Period Mean (original grids) [Watt m-2] |
Model Period Mean (intersection) [Watt m-2] |
Benchmark Period Mean (intersection) [Watt m-2] |
Model Period Mean (complement) [Watt m-2] |
Benchmark Period Mean (complement) [Watt m-2] |
Bias [Watt m-2] |
RMSE [Watt m-2] |
Phase Shift [months] |
Bias Score [1] |
RMSE Score [1] |
Seasonal Cycle Score [1] |
Spatial Distribution Score [1] |
Overall Score [1] |
|||
|---|---|---|---|---|---|---|---|---|---|---|---|---|---|---|---|---|
| Benchmark | [-] | 120. | ||||||||||||||
| I123 | [-] | 120. | 120. | 120. | 157. | 2.33 | 21.3 | 0.425 | 0.328 | 0.307 | 0.965 | 0.995 | 0.580 | |||
| post5.4 | [-] | 120. | 120. | 121. | 158. | 0.628 | 19.3 | 0.470 | 0.373 | 0.378 | 0.964 | 0.992 | 0.617 |
Download Data |
Period Mean (original grids) [Watt m-2] |
Model Period Mean (intersection) [Watt m-2] |
Benchmark Period Mean (intersection) [Watt m-2] |
Model Period Mean (complement) [Watt m-2] |
Benchmark Period Mean (complement) [Watt m-2] |
Bias [Watt m-2] |
RMSE [Watt m-2] |
Phase Shift [months] |
Bias Score [1] |
RMSE Score [1] |
Seasonal Cycle Score [1] |
Spatial Distribution Score [1] |
Overall Score [1] |
|||
|---|---|---|---|---|---|---|---|---|---|---|---|---|---|---|---|---|
| Benchmark | [-] | 145. | ||||||||||||||
| I123 | [-] | 140. | 140. | 144. | 197. | -2.88 | 20.4 | 0.747 | 0.419 | 0.458 | 0.912 | 0.954 | 0.640 | |||
| post5.4 | [-] | 138. | 138. | 144. | 197. | -5.39 | 20.1 | 0.817 | 0.417 | 0.461 | 0.902 | 0.968 | 0.642 |
Download Data |
Period Mean (original grids) [Watt m-2] |
Model Period Mean (intersection) [Watt m-2] |
Benchmark Period Mean (intersection) [Watt m-2] |
Model Period Mean (complement) [Watt m-2] |
Benchmark Period Mean (complement) [Watt m-2] |
Bias [Watt m-2] |
RMSE [Watt m-2] |
Phase Shift [months] |
Bias Score [1] |
RMSE Score [1] |
Seasonal Cycle Score [1] |
Spatial Distribution Score [1] |
Overall Score [1] |
|||
|---|---|---|---|---|---|---|---|---|---|---|---|---|---|---|---|---|
| Benchmark | [-] | 175. | ||||||||||||||
| I123 | [-] | 167. | 167. | 175. | 233. | -6.09 | 19.9 | 0.785 | 0.355 | 0.525 | 0.913 | 0.979 | 0.659 | |||
| post5.4 | [-] | 166. | 166. | 176. | 234. | -9.12 | 20.3 | 0.742 | 0.342 | 0.533 | 0.922 | 0.974 | 0.661 |
Download Data |
Period Mean (original grids) [Watt m-2] |
Model Period Mean (intersection) [Watt m-2] |
Benchmark Period Mean (intersection) [Watt m-2] |
Model Period Mean (complement) [Watt m-2] |
Benchmark Period Mean (complement) [Watt m-2] |
Bias [Watt m-2] |
RMSE [Watt m-2] |
Phase Shift [months] |
Bias Score [1] |
RMSE Score [1] |
Seasonal Cycle Score [1] |
Spatial Distribution Score [1] |
Overall Score [1] |
|||
|---|---|---|---|---|---|---|---|---|---|---|---|---|---|---|---|---|
| Benchmark | [-] | 80.0 | ||||||||||||||
| I123 | [-] | 70.9 | 70.7 | 80.0 | 78.6 | -11.1 | 15.3 | 0.117 | 0.404 | 0.517 | 0.992 | 0.893 | 0.665 | |||
| post5.4 | [-] | 71.0 | 70.8 | 80.1 | 78.5 | -10.9 | 14.6 | 0.139 | 0.418 | 0.548 | 0.991 | 0.927 | 0.686 |
Download Data |
Period Mean (original grids) [Watt m-2] |
Model Period Mean (intersection) [Watt m-2] |
Benchmark Period Mean (intersection) [Watt m-2] |
Model Period Mean (complement) [Watt m-2] |
Benchmark Period Mean (complement) [Watt m-2] |
Bias [Watt m-2] |
RMSE [Watt m-2] |
Phase Shift [months] |
Bias Score [1] |
RMSE Score [1] |
Seasonal Cycle Score [1] |
Spatial Distribution Score [1] |
Overall Score [1] |
|||
|---|---|---|---|---|---|---|---|---|---|---|---|---|---|---|---|---|
| Benchmark | [-] | 205. | ||||||||||||||
| I123 | [-] | 195. | 195. | 204. | 226. | -7.69 | 27.9 | 0.748 | 0.360 | 0.442 | 0.929 | 0.728 | 0.580 | |||
| post5.4 | [-] | 191. | 192. | 205. | 227. | -13.0 | 29.6 | 1.22 | 0.326 | 0.421 | 0.846 | 0.725 | 0.548 |
Download Data |
Period Mean (original grids) [Watt m-2] |
Model Period Mean (intersection) [Watt m-2] |
Benchmark Period Mean (intersection) [Watt m-2] |
Model Period Mean (complement) [Watt m-2] |
Benchmark Period Mean (complement) [Watt m-2] |
Bias [Watt m-2] |
RMSE [Watt m-2] |
Phase Shift [months] |
Bias Score [1] |
RMSE Score [1] |
Seasonal Cycle Score [1] |
Spatial Distribution Score [1] |
Overall Score [1] |
|||
|---|---|---|---|---|---|---|---|---|---|---|---|---|---|---|---|---|
| Benchmark | [-] | 153. | ||||||||||||||
| I123 | [-] | 143. | 143. | 152. | 202. | -7.58 | 15.9 | 0.721 | 0.606 | 0.491 | 0.952 | 0.952 | 0.698 | |||
| post5.4 | [-] | 145. | 145. | 153. | 202. | -6.15 | 15.0 | 0.739 | 0.688 | 0.495 | 0.951 | 0.959 | 0.718 |
Download Data |
Period Mean (original grids) [Watt m-2] |
Model Period Mean (intersection) [Watt m-2] |
Benchmark Period Mean (intersection) [Watt m-2] |
Model Period Mean (complement) [Watt m-2] |
Benchmark Period Mean (complement) [Watt m-2] |
Bias [Watt m-2] |
RMSE [Watt m-2] |
Phase Shift [months] |
Bias Score [1] |
RMSE Score [1] |
Seasonal Cycle Score [1] |
Spatial Distribution Score [1] |
Overall Score [1] |
|||
|---|---|---|---|---|---|---|---|---|---|---|---|---|---|---|---|---|
| Benchmark | [-] | 115. | ||||||||||||||
| I123 | [-] | 115. | 115. | 115. | 142. | -0.309 | 15.1 | 0.276 | 0.690 | 0.422 | 0.982 | 0.999 | 0.703 | |||
| post5.4 | [-] | 113. | 113. | 115. | 143. | -2.39 | 13.0 | 0.256 | 0.723 | 0.511 | 0.983 | 0.997 | 0.745 |
Download Data |
Period Mean (original grids) [Watt m-2] |
Model Period Mean (intersection) [Watt m-2] |
Benchmark Period Mean (intersection) [Watt m-2] |
Model Period Mean (complement) [Watt m-2] |
Benchmark Period Mean (complement) [Watt m-2] |
Bias [Watt m-2] |
RMSE [Watt m-2] |
Phase Shift [months] |
Bias Score [1] |
RMSE Score [1] |
Seasonal Cycle Score [1] |
Spatial Distribution Score [1] |
Overall Score [1] |
|||
|---|---|---|---|---|---|---|---|---|---|---|---|---|---|---|---|---|
| Benchmark | [-] | 162. | ||||||||||||||
| I123 | [-] | 154. | 154. | 162. | 181. | -8.05 | 15.4 | 0.433 | 0.474 | 0.498 | 0.971 | 1.00 | 0.688 | |||
| post5.4 | [-] | 153. | 153. | 163. | 181. | -9.81 | 15.7 | 0.342 | 0.413 | 0.544 | 0.977 | 0.996 | 0.695 |
Download Data |
Period Mean (original grids) [Watt m-2] |
Model Period Mean (intersection) [Watt m-2] |
Benchmark Period Mean (intersection) [Watt m-2] |
Model Period Mean (complement) [Watt m-2] |
Benchmark Period Mean (complement) [Watt m-2] |
Bias [Watt m-2] |
RMSE [Watt m-2] |
Phase Shift [months] |
Bias Score [1] |
RMSE Score [1] |
Seasonal Cycle Score [1] |
Spatial Distribution Score [1] |
Overall Score [1] |
|||
|---|---|---|---|---|---|---|---|---|---|---|---|---|---|---|---|---|
| Benchmark | [-] | 176. | ||||||||||||||
| I123 | [-] | 172. | 172. | 175. | 232. | -2.24 | 17.6 | 1.33 | 0.516 | 0.664 | 0.810 | 0.951 | 0.721 | |||
| post5.4 | [-] | 164. | 164. | 177. | 234. | -12.0 | 23.3 | 1.62 | 0.278 | 0.631 | 0.762 | 0.996 | 0.659 |
Download Data |
Period Mean (original grids) [Watt m-2] |
Model Period Mean (intersection) [Watt m-2] |
Benchmark Period Mean (intersection) [Watt m-2] |
Model Period Mean (complement) [Watt m-2] |
Benchmark Period Mean (complement) [Watt m-2] |
Bias [Watt m-2] |
RMSE [Watt m-2] |
Phase Shift [months] |
Bias Score [1] |
RMSE Score [1] |
Seasonal Cycle Score [1] |
Spatial Distribution Score [1] |
Overall Score [1] |
|||
|---|---|---|---|---|---|---|---|---|---|---|---|---|---|---|---|---|
| Benchmark | [-] | 182. | ||||||||||||||
| I123 | [-] | 175. | 175. | 182. | 207. | -6.27 | 15.4 | 0.923 | 0.604 | 0.588 | 0.881 | 0.973 | 0.727 | |||
| post5.4 | [-] | 174. | 174. | 183. | 209. | -9.21 | 17.9 | 1.00 | 0.493 | 0.562 | 0.878 | 0.934 | 0.686 |
Download Data |
Period Mean (original grids) [Watt m-2] |
Model Period Mean (intersection) [Watt m-2] |
Benchmark Period Mean (intersection) [Watt m-2] |
Model Period Mean (complement) [Watt m-2] |
Benchmark Period Mean (complement) [Watt m-2] |
Bias [Watt m-2] |
RMSE [Watt m-2] |
Phase Shift [months] |
Bias Score [1] |
RMSE Score [1] |
Seasonal Cycle Score [1] |
Spatial Distribution Score [1] |
Overall Score [1] |
|||
|---|---|---|---|---|---|---|---|---|---|---|---|---|---|---|---|---|
| Benchmark | [-] | 176. | ||||||||||||||
| I123 | [-] | 177. | 177. | 175. | 198. | -1.07 | 24.1 | 0.625 | 0.304 | 0.466 | 0.940 | 0.842 | 0.604 | |||
| post5.4 | [-] | 176. | 176. | 175. | 197. | -2.19 | 24.5 | 0.678 | 0.301 | 0.465 | 0.938 | 0.815 | 0.596 |
Temporally integrated period mean