Mean State
Download Data |
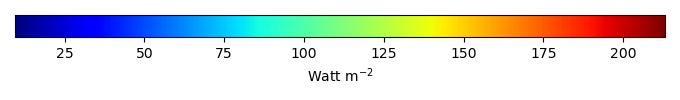
Period Mean (original grids) [Watt m-2] |
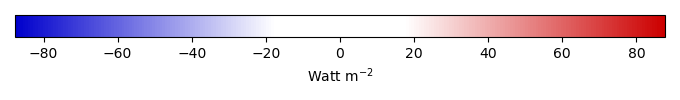
Bias [Watt m-2] |
RMSE [Watt m-2] |
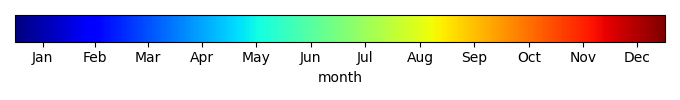
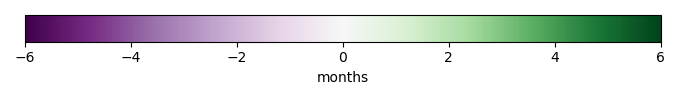
Phase Shift [months] |
Bias Score [1] |
RMSE Score [1] |
Seasonal Cycle Score [1] |
Overall Score [1] |
|||
|---|---|---|---|---|---|---|---|---|---|---|---|
| Benchmark | [-] | 202. | |||||||||
| I123 | [-] | 196. | 8.91 | 61.1 | 0.00 | 0.577 | 0.00 | 1.00 | 0.394 | ||
| post5.4 | [-] | 196. | 10.9 | 59.8 | 0.00 | 0.484 | 0.00 | 1.00 | 0.371 |
Download Data |
Period Mean (original grids) [Watt m-2] |
Bias [Watt m-2] |
RMSE [Watt m-2] |
Phase Shift [months] |
Bias Score [1] |
RMSE Score [1] |
Seasonal Cycle Score [1] |
Overall Score [1] |
|||
|---|---|---|---|---|---|---|---|---|---|---|---|
| Benchmark | [-] | 69.4 | |||||||||
| I123 | [-] | 124. | 42.2 | 72.5 | 0.508 | 0.00 | 0.0636 | 0.966 | 0.273 | ||
| post5.4 | [-] | 123. | 43.4 | 72.5 | 0.508 | 0.00 | 0.0779 | 0.966 | 0.281 |
Download Data |
Period Mean (original grids) [Watt m-2] |
Bias [Watt m-2] |
RMSE [Watt m-2] |
Phase Shift [months] |
Bias Score [1] |
RMSE Score [1] |
Seasonal Cycle Score [1] |
Overall Score [1] |
|||
|---|---|---|---|---|---|---|---|---|---|---|---|
| Benchmark | [-] | 120. | |||||||||
| I123 | [-] | 135. | 12.6 | 39.3 | 0.476 | 0.454 | 0.0901 | 0.968 | 0.401 | ||
| post5.4 | [-] | 135. | 14.5 | 38.9 | 0.543 | 0.386 | 0.215 | 0.964 | 0.445 |
Download Data |
Period Mean (original grids) [Watt m-2] |
Bias [Watt m-2] |
RMSE [Watt m-2] |
Phase Shift [months] |
Bias Score [1] |
RMSE Score [1] |
Seasonal Cycle Score [1] |
Overall Score [1] |
|||
|---|---|---|---|---|---|---|---|---|---|---|---|
| Benchmark | [-] | 176. | |||||||||
| I123 | [-] | 175. | -4.80 | 15.7 | 1.02 | 0.717 | 0.321 | 0.933 | 0.573 | ||
| post5.4 | [-] | 173. | -5.54 | 12.9 | 1.02 | 0.673 | 0.482 | 0.933 | 0.642 |
Download Data |
Period Mean (original grids) [Watt m-2] |
Bias [Watt m-2] |
RMSE [Watt m-2] |
Phase Shift [months] |
Bias Score [1] |
RMSE Score [1] |
Seasonal Cycle Score [1] |
Overall Score [1] |
|||
|---|---|---|---|---|---|---|---|---|---|---|---|
| Benchmark | [-] | 62.8 | |||||||||
| I123 | [-] | 43.2 | -10.8 | 34.0 | 0.00 | 0.418 | 0.00 | 1.00 | 0.354 | ||
| post5.4 | [-] | 48.1 | -3.21 | 55.1 | 0.00 | 0.826 | 0.00 | 1.00 | 0.457 |
Download Data |
Period Mean (original grids) [Watt m-2] |
Bias [Watt m-2] |
RMSE [Watt m-2] |
Phase Shift [months] |
Bias Score [1] |
RMSE Score [1] |
Seasonal Cycle Score [1] |
Overall Score [1] |
|||
|---|---|---|---|---|---|---|---|---|---|---|---|
| Benchmark | [-] | 135. | |||||||||
| I123 | [-] | 144. | 5.17 | 23.5 | 0.610 | 0.354 | 0.122 | 0.960 | 0.389 | ||
| post5.4 | [-] | 146. | 7.53 | 21.9 | 0.813 | 0.209 | 0.284 | 0.946 | 0.431 |
Download Data |
Period Mean (original grids) [Watt m-2] |
Bias [Watt m-2] |
RMSE [Watt m-2] |
Phase Shift [months] |
Bias Score [1] |
RMSE Score [1] |
Seasonal Cycle Score [1] |
Overall Score [1] |
|||
|---|---|---|---|---|---|---|---|---|---|---|---|
| Benchmark | [-] | 151. | |||||||||
| I123 | [-] | 150. | -0.660 | 22.3 | 0.254 | 0.720 | 0.0505 | 0.983 | 0.451 | ||
| post5.4 | [-] | 152. | 0.703 | 18.7 | 0.254 | 0.594 | 0.237 | 0.983 | 0.513 |
Temporally integrated period mean