Mean State
Download Data |
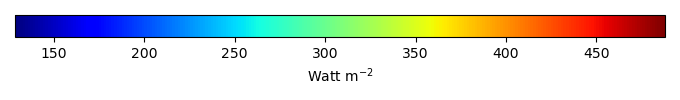
Period Mean (original grids) [Watt m-2] |
Model Period Mean (intersection) [Watt m-2] |
Benchmark Period Mean (intersection) [Watt m-2] |
Model Period Mean (complement) [Watt m-2] |
Benchmark Period Mean (complement) [Watt m-2] |
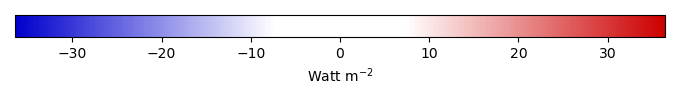
Bias [Watt m-2] |
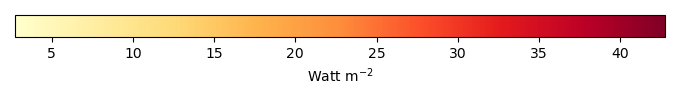
RMSE [Watt m-2] |
Phase Shift [months] |
Bias Score [1] |
RMSE Score [1] |
Seasonal Cycle Score [1] |
Spatial Distribution Score [1] |
Overall Score [1] |
|||
|---|---|---|---|---|---|---|---|---|---|---|---|---|---|---|---|---|
| Benchmark | [-] | 453. | ||||||||||||||
| I123 | [-] | 454. | 454. | 453. | 461. | 2.03 | 11.7 | 1.85 | 0.553 | 0.638 | 0.732 | 0.980 | 0.708 | |||
| post5.4 | [-] | 455. | 455. | 453. | 462. | 3.79 | 11.9 | 1.70 | 0.560 | 0.641 | 0.761 | 0.979 | 0.716 |
Download Data |
Period Mean (original grids) [Watt m-2] |
Model Period Mean (intersection) [Watt m-2] |
Benchmark Period Mean (intersection) [Watt m-2] |
Model Period Mean (complement) [Watt m-2] |
Benchmark Period Mean (complement) [Watt m-2] |
Bias [Watt m-2] |
RMSE [Watt m-2] |
Phase Shift [months] |
Bias Score [1] |
RMSE Score [1] |
Seasonal Cycle Score [1] |
Spatial Distribution Score [1] |
Overall Score [1] |
|||
|---|---|---|---|---|---|---|---|---|---|---|---|---|---|---|---|---|
| Benchmark | [-] | 471. | ||||||||||||||
| I123 | [-] | 466. | 466. | 471. | 461. | -5.32 | 22.6 | 1.27 | 0.417 | 0.201 | 0.874 | 0.913 | 0.521 | |||
| post5.4 | [-] | 469. | 469. | 471. | 461. | -1.22 | 21.6 | 1.19 | 0.478 | 0.204 | 0.888 | 0.946 | 0.544 |
Download Data |
Period Mean (original grids) [Watt m-2] |
Model Period Mean (intersection) [Watt m-2] |
Benchmark Period Mean (intersection) [Watt m-2] |
Model Period Mean (complement) [Watt m-2] |
Benchmark Period Mean (complement) [Watt m-2] |
Bias [Watt m-2] |
RMSE [Watt m-2] |
Phase Shift [months] |
Bias Score [1] |
RMSE Score [1] |
Seasonal Cycle Score [1] |
Spatial Distribution Score [1] |
Overall Score [1] |
|||
|---|---|---|---|---|---|---|---|---|---|---|---|---|---|---|---|---|
| Benchmark | [-] | 443. | ||||||||||||||
| I123 | [-] | 437. | 437. | 443. | 443. | -5.05 | 16.3 | 1.43 | 0.484 | 0.425 | 0.814 | 0.982 | 0.626 | |||
| post5.4 | [-] | 439. | 439. | 444. | 443. | -2.72 | 16.7 | 1.54 | 0.518 | 0.379 | 0.798 | 0.986 | 0.612 |
Download Data |
Period Mean (original grids) [Watt m-2] |
Model Period Mean (intersection) [Watt m-2] |
Benchmark Period Mean (intersection) [Watt m-2] |
Model Period Mean (complement) [Watt m-2] |
Benchmark Period Mean (complement) [Watt m-2] |
Bias [Watt m-2] |
RMSE [Watt m-2] |
Phase Shift [months] |
Bias Score [1] |
RMSE Score [1] |
Seasonal Cycle Score [1] |
Spatial Distribution Score [1] |
Overall Score [1] |
|||
|---|---|---|---|---|---|---|---|---|---|---|---|---|---|---|---|---|
| Benchmark | [-] | 276. | ||||||||||||||
| I123 | [-] | 264. | 264. | 276. | 287. | -9.60 | 19.0 | 0.0904 | 0.298 | 0.239 | 0.994 | 0.998 | 0.554 | |||
| post5.4 | [-] | 268. | 268. | 276. | 288. | -5.71 | 16.4 | 0.0846 | 0.474 | 0.282 | 0.994 | 1.00 | 0.606 |
Download Data |
Period Mean (original grids) [Watt m-2] |
Model Period Mean (intersection) [Watt m-2] |
Benchmark Period Mean (intersection) [Watt m-2] |
Model Period Mean (complement) [Watt m-2] |
Benchmark Period Mean (complement) [Watt m-2] |
Bias [Watt m-2] |
RMSE [Watt m-2] |
Phase Shift [months] |
Bias Score [1] |
RMSE Score [1] |
Seasonal Cycle Score [1] |
Spatial Distribution Score [1] |
Overall Score [1] |
|||
|---|---|---|---|---|---|---|---|---|---|---|---|---|---|---|---|---|
| Benchmark | [-] | 456. | ||||||||||||||
| I123 | [-] | 453. | 453. | 455. | 466. | 0.000704 | 10.1 | 2.22 | 0.464 | 0.796 | 0.662 | 0.950 | 0.733 | |||
| post5.4 | [-] | 454. | 454. | 455. | 466. | 1.27 | 10.5 | 2.16 | 0.446 | 0.797 | 0.670 | 0.921 | 0.726 |
Download Data |
Period Mean (original grids) [Watt m-2] |
Model Period Mean (intersection) [Watt m-2] |
Benchmark Period Mean (intersection) [Watt m-2] |
Model Period Mean (complement) [Watt m-2] |
Benchmark Period Mean (complement) [Watt m-2] |
Bias [Watt m-2] |
RMSE [Watt m-2] |
Phase Shift [months] |
Bias Score [1] |
RMSE Score [1] |
Seasonal Cycle Score [1] |
Spatial Distribution Score [1] |
Overall Score [1] |
|||
|---|---|---|---|---|---|---|---|---|---|---|---|---|---|---|---|---|
| Benchmark | [-] | 306. | ||||||||||||||
| I123 | [-] | 303. | 303. | 306. | 333. | -2.27 | 11.0 | 0.0204 | 0.606 | 0.499 | 0.999 | 0.976 | 0.716 | |||
| post5.4 | [-] | 308. | 308. | 306. | 333. | 1.78 | 10.8 | 0.0270 | 0.570 | 0.533 | 0.998 | 0.969 | 0.721 |
Download Data |
Period Mean (original grids) [Watt m-2] |
Model Period Mean (intersection) [Watt m-2] |
Benchmark Period Mean (intersection) [Watt m-2] |
Model Period Mean (complement) [Watt m-2] |
Benchmark Period Mean (complement) [Watt m-2] |
Bias [Watt m-2] |
RMSE [Watt m-2] |
Phase Shift [months] |
Bias Score [1] |
RMSE Score [1] |
Seasonal Cycle Score [1] |
Spatial Distribution Score [1] |
Overall Score [1] |
|||
|---|---|---|---|---|---|---|---|---|---|---|---|---|---|---|---|---|
| Benchmark | [-] | 362. | ||||||||||||||
| I123 | [-] | 355. | 354. | 361. | 416. | -4.35 | 13.3 | 0.190 | 0.511 | 0.550 | 0.986 | 0.999 | 0.719 | |||
| post5.4 | [-] | 359. | 358. | 362. | 417. | -1.67 | 12.6 | 0.203 | 0.539 | 0.561 | 0.986 | 1.00 | 0.729 |
Download Data |
Period Mean (original grids) [Watt m-2] |
Model Period Mean (intersection) [Watt m-2] |
Benchmark Period Mean (intersection) [Watt m-2] |
Model Period Mean (complement) [Watt m-2] |
Benchmark Period Mean (complement) [Watt m-2] |
Bias [Watt m-2] |
RMSE [Watt m-2] |
Phase Shift [months] |
Bias Score [1] |
RMSE Score [1] |
Seasonal Cycle Score [1] |
Spatial Distribution Score [1] |
Overall Score [1] |
|||
|---|---|---|---|---|---|---|---|---|---|---|---|---|---|---|---|---|
| Benchmark | [-] | 450. | ||||||||||||||
| I123 | [-] | 450. | 451. | 450. | 462. | 3.56 | 16.1 | 0.686 | 0.445 | 0.413 | 0.944 | 0.983 | 0.640 | |||
| post5.4 | [-] | 453. | 453. | 449. | 462. | 7.30 | 16.9 | 0.555 | 0.336 | 0.472 | 0.953 | 0.971 | 0.641 |
Download Data |
Period Mean (original grids) [Watt m-2] |
Model Period Mean (intersection) [Watt m-2] |
Benchmark Period Mean (intersection) [Watt m-2] |
Model Period Mean (complement) [Watt m-2] |
Benchmark Period Mean (complement) [Watt m-2] |
Bias [Watt m-2] |
RMSE [Watt m-2] |
Phase Shift [months] |
Bias Score [1] |
RMSE Score [1] |
Seasonal Cycle Score [1] |
Spatial Distribution Score [1] |
Overall Score [1] |
|||
|---|---|---|---|---|---|---|---|---|---|---|---|---|---|---|---|---|
| Benchmark | [-] | 275. | ||||||||||||||
| I123 | [-] | 269. | 270. | 275. | 289. | -4.63 | 15.5 | 0.0568 | 0.605 | 0.273 | 0.996 | 0.996 | 0.628 | |||
| post5.4 | [-] | 273. | 274. | 275. | 289. | -0.707 | 12.9 | 0.0544 | 0.688 | 0.385 | 0.996 | 0.991 | 0.689 |
Download Data |
Period Mean (original grids) [Watt m-2] |
Model Period Mean (intersection) [Watt m-2] |
Benchmark Period Mean (intersection) [Watt m-2] |
Model Period Mean (complement) [Watt m-2] |
Benchmark Period Mean (complement) [Watt m-2] |
Bias [Watt m-2] |
RMSE [Watt m-2] |
Phase Shift [months] |
Bias Score [1] |
RMSE Score [1] |
Seasonal Cycle Score [1] |
Spatial Distribution Score [1] |
Overall Score [1] |
|||
|---|---|---|---|---|---|---|---|---|---|---|---|---|---|---|---|---|
| Benchmark | [-] | 448. | ||||||||||||||
| I123 | [-] | 438. | 438. | 448. | 437. | -12.5 | 18.2 | 0.422 | 0.352 | 0.601 | 0.963 | 0.979 | 0.699 | |||
| post5.4 | [-] | 441. | 441. | 447. | 437. | -8.78 | 15.6 | 0.406 | 0.443 | 0.630 | 0.966 | 0.989 | 0.732 |
Download Data |
Period Mean (original grids) [Watt m-2] |
Model Period Mean (intersection) [Watt m-2] |
Benchmark Period Mean (intersection) [Watt m-2] |
Model Period Mean (complement) [Watt m-2] |
Benchmark Period Mean (complement) [Watt m-2] |
Bias [Watt m-2] |
RMSE [Watt m-2] |
Phase Shift [months] |
Bias Score [1] |
RMSE Score [1] |
Seasonal Cycle Score [1] |
Spatial Distribution Score [1] |
Overall Score [1] |
|||
|---|---|---|---|---|---|---|---|---|---|---|---|---|---|---|---|---|
| Benchmark | [-] | 364. | ||||||||||||||
| I123 | [-] | 356. | 356. | 363. | 390. | -4.32 | 10.9 | 0.507 | 0.586 | 0.606 | 0.966 | 0.994 | 0.751 | |||
| post5.4 | [-] | 360. | 360. | 364. | 390. | -1.18 | 9.97 | 0.467 | 0.571 | 0.656 | 0.969 | 0.991 | 0.769 |
Download Data |
Period Mean (original grids) [Watt m-2] |
Model Period Mean (intersection) [Watt m-2] |
Benchmark Period Mean (intersection) [Watt m-2] |
Model Period Mean (complement) [Watt m-2] |
Benchmark Period Mean (complement) [Watt m-2] |
Bias [Watt m-2] |
RMSE [Watt m-2] |
Phase Shift [months] |
Bias Score [1] |
RMSE Score [1] |
Seasonal Cycle Score [1] |
Spatial Distribution Score [1] |
Overall Score [1] |
|||
|---|---|---|---|---|---|---|---|---|---|---|---|---|---|---|---|---|
| Benchmark | [-] | 378. | ||||||||||||||
| I123 | [-] | 369. | 369. | 378. | 426. | -5.79 | 15.1 | 0.631 | 0.455 | 0.518 | 0.928 | 0.999 | 0.684 | |||
| post5.4 | [-] | 373. | 373. | 378. | 426. | -2.08 | 14.0 | 0.606 | 0.488 | 0.549 | 0.933 | 0.999 | 0.704 |
Download Data |
Period Mean (original grids) [Watt m-2] |
Model Period Mean (intersection) [Watt m-2] |
Benchmark Period Mean (intersection) [Watt m-2] |
Model Period Mean (complement) [Watt m-2] |
Benchmark Period Mean (complement) [Watt m-2] |
Bias [Watt m-2] |
RMSE [Watt m-2] |
Phase Shift [months] |
Bias Score [1] |
RMSE Score [1] |
Seasonal Cycle Score [1] |
Spatial Distribution Score [1] |
Overall Score [1] |
|||
|---|---|---|---|---|---|---|---|---|---|---|---|---|---|---|---|---|
| Benchmark | [-] | 464. | ||||||||||||||
| I123 | [-] | 442. | 442. | 464. | 442. | -21.0 | 28.0 | 0.578 | 0.134 | 0.503 | 0.949 | 0.984 | 0.614 | |||
| post5.4 | [-] | 446. | 446. | 464. | 443. | -16.8 | 23.9 | 0.600 | 0.198 | 0.587 | 0.947 | 0.990 | 0.662 |
Download Data |
Period Mean (original grids) [Watt m-2] |
Model Period Mean (intersection) [Watt m-2] |
Benchmark Period Mean (intersection) [Watt m-2] |
Model Period Mean (complement) [Watt m-2] |
Benchmark Period Mean (complement) [Watt m-2] |
Bias [Watt m-2] |
RMSE [Watt m-2] |
Phase Shift [months] |
Bias Score [1] |
RMSE Score [1] |
Seasonal Cycle Score [1] |
Spatial Distribution Score [1] |
Overall Score [1] |
|||
|---|---|---|---|---|---|---|---|---|---|---|---|---|---|---|---|---|
| Benchmark | [-] | 278. | ||||||||||||||
| I123 | [-] | 273. | 273. | 278. | 280. | -5.98 | 15.4 | 0.0932 | 0.440 | 0.353 | 0.994 | 0.979 | 0.624 | |||
| post5.4 | [-] | 278. | 278. | 278. | 281. | -1.18 | 13.1 | 0.0747 | 0.596 | 0.419 | 0.995 | 0.980 | 0.682 |
Download Data |
Period Mean (original grids) [Watt m-2] |
Model Period Mean (intersection) [Watt m-2] |
Benchmark Period Mean (intersection) [Watt m-2] |
Model Period Mean (complement) [Watt m-2] |
Benchmark Period Mean (complement) [Watt m-2] |
Bias [Watt m-2] |
RMSE [Watt m-2] |
Phase Shift [months] |
Bias Score [1] |
RMSE Score [1] |
Seasonal Cycle Score [1] |
Spatial Distribution Score [1] |
Overall Score [1] |
|||
|---|---|---|---|---|---|---|---|---|---|---|---|---|---|---|---|---|
| Benchmark | [-] | 444. | ||||||||||||||
| I123 | [-] | 436. | 436. | 444. | 456. | -1.30 | 11.6 | 0.790 | 0.511 | 0.650 | 0.908 | 0.948 | 0.733 | |||
| post5.4 | [-] | 439. | 439. | 444. | 456. | 0.787 | 11.6 | 0.831 | 0.486 | 0.664 | 0.904 | 0.928 | 0.729 |
Download Data |
Period Mean (original grids) [Watt m-2] |
Model Period Mean (intersection) [Watt m-2] |
Benchmark Period Mean (intersection) [Watt m-2] |
Model Period Mean (complement) [Watt m-2] |
Benchmark Period Mean (complement) [Watt m-2] |
Bias [Watt m-2] |
RMSE [Watt m-2] |
Phase Shift [months] |
Bias Score [1] |
RMSE Score [1] |
Seasonal Cycle Score [1] |
Spatial Distribution Score [1] |
Overall Score [1] |
|||
|---|---|---|---|---|---|---|---|---|---|---|---|---|---|---|---|---|
| Benchmark | [-] | 386. | ||||||||||||||
| I123 | [-] | 380. | 380. | 385. | 440. | -1.76 | 7.90 | 0.232 | 0.706 | 0.677 | 0.984 | 1.00 | 0.809 | |||
| post5.4 | [-] | 385. | 385. | 385. | 440. | 2.75 | 8.10 | 0.469 | 0.620 | 0.706 | 0.968 | 0.998 | 0.800 |
Download Data |
Period Mean (original grids) [Watt m-2] |
Model Period Mean (intersection) [Watt m-2] |
Benchmark Period Mean (intersection) [Watt m-2] |
Model Period Mean (complement) [Watt m-2] |
Benchmark Period Mean (complement) [Watt m-2] |
Bias [Watt m-2] |
RMSE [Watt m-2] |
Phase Shift [months] |
Bias Score [1] |
RMSE Score [1] |
Seasonal Cycle Score [1] |
Spatial Distribution Score [1] |
Overall Score [1] |
|||
|---|---|---|---|---|---|---|---|---|---|---|---|---|---|---|---|---|
| Benchmark | [-] | 319. | ||||||||||||||
| I123 | [-] | 316. | 316. | 319. | 353. | -1.48 | 10.9 | 0.178 | 0.627 | 0.514 | 0.988 | 0.995 | 0.728 | |||
| post5.4 | [-] | 321. | 321. | 319. | 353. | 3.59 | 9.63 | 0.129 | 0.608 | 0.604 | 0.991 | 0.992 | 0.760 |
Download Data |
Period Mean (original grids) [Watt m-2] |
Model Period Mean (intersection) [Watt m-2] |
Benchmark Period Mean (intersection) [Watt m-2] |
Model Period Mean (complement) [Watt m-2] |
Benchmark Period Mean (complement) [Watt m-2] |
Bias [Watt m-2] |
RMSE [Watt m-2] |
Phase Shift [months] |
Bias Score [1] |
RMSE Score [1] |
Seasonal Cycle Score [1] |
Spatial Distribution Score [1] |
Overall Score [1] |
|||
|---|---|---|---|---|---|---|---|---|---|---|---|---|---|---|---|---|
| Benchmark | [-] | 376. | ||||||||||||||
| I123 | [-] | 366. | 367. | 376. | 381. | -8.57 | 14.5 | 0.192 | 0.442 | 0.534 | 0.987 | 0.985 | 0.696 | |||
| post5.4 | [-] | 371. | 372. | 377. | 381. | -4.30 | 12.8 | 0.158 | 0.521 | 0.560 | 0.989 | 0.972 | 0.721 |
Download Data |
Period Mean (original grids) [Watt m-2] |
Model Period Mean (intersection) [Watt m-2] |
Benchmark Period Mean (intersection) [Watt m-2] |
Model Period Mean (complement) [Watt m-2] |
Benchmark Period Mean (complement) [Watt m-2] |
Bias [Watt m-2] |
RMSE [Watt m-2] |
Phase Shift [months] |
Bias Score [1] |
RMSE Score [1] |
Seasonal Cycle Score [1] |
Spatial Distribution Score [1] |
Overall Score [1] |
|||
|---|---|---|---|---|---|---|---|---|---|---|---|---|---|---|---|---|
| Benchmark | [-] | 449. | ||||||||||||||
| I123 | [-] | 445. | 445. | 449. | 458. | -3.13 | 8.31 | 1.57 | 0.608 | 0.695 | 0.775 | 0.954 | 0.746 | |||
| post5.4 | [-] | 448. | 448. | 448. | 459. | 0.465 | 7.79 | 1.18 | 0.662 | 0.706 | 0.833 | 0.960 | 0.773 |
Download Data |
Period Mean (original grids) [Watt m-2] |
Model Period Mean (intersection) [Watt m-2] |
Benchmark Period Mean (intersection) [Watt m-2] |
Model Period Mean (complement) [Watt m-2] |
Benchmark Period Mean (complement) [Watt m-2] |
Bias [Watt m-2] |
RMSE [Watt m-2] |
Phase Shift [months] |
Bias Score [1] |
RMSE Score [1] |
Seasonal Cycle Score [1] |
Spatial Distribution Score [1] |
Overall Score [1] |
|||
|---|---|---|---|---|---|---|---|---|---|---|---|---|---|---|---|---|
| Benchmark | [-] | 440. | ||||||||||||||
| I123 | [-] | 436. | 436. | 440. | 430. | -4.74 | 10.7 | 0.946 | 0.519 | 0.603 | 0.885 | 1.00 | 0.722 | |||
| post5.4 | [-] | 438. | 438. | 441. | 430. | -2.76 | 9.87 | 0.811 | 0.581 | 0.609 | 0.906 | 0.998 | 0.741 |
Download Data |
Period Mean (original grids) [Watt m-2] |
Model Period Mean (intersection) [Watt m-2] |
Benchmark Period Mean (intersection) [Watt m-2] |
Model Period Mean (complement) [Watt m-2] |
Benchmark Period Mean (complement) [Watt m-2] |
Bias [Watt m-2] |
RMSE [Watt m-2] |
Phase Shift [months] |
Bias Score [1] |
RMSE Score [1] |
Seasonal Cycle Score [1] |
Spatial Distribution Score [1] |
Overall Score [1] |
|||
|---|---|---|---|---|---|---|---|---|---|---|---|---|---|---|---|---|
| Benchmark | [-] | 387. | ||||||||||||||
| I123 | [-] | 377. | 376. | 387. | 401. | -6.12 | 17.5 | 0.743 | 0.357 | 0.662 | 0.908 | 0.996 | 0.717 | |||
| post5.4 | [-] | 378. | 378. | 387. | 401. | -4.96 | 16.9 | 0.687 | 0.376 | 0.651 | 0.922 | 0.997 | 0.719 |
Temporally integrated period mean