Mean State
Download Data |
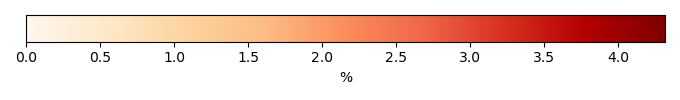
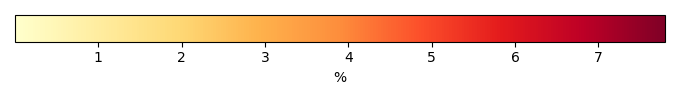
Period Mean (original grids) [%] |
Model Period Mean (intersection) [%] |
Benchmark Period Mean (intersection) [%] |
Model Period Mean (complement) [%] |
Benchmark Period Mean (complement) [%] |
Bias [%] |
RMSE [%] |
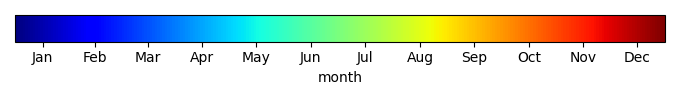
Phase Shift [months] |
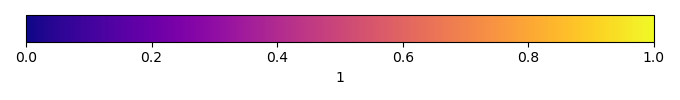
Bias Score [1] |
RMSE Score [1] |
Seasonal Cycle Score [1] |
Spatial Distribution Score [1] |
Overall Score [1] |
|||
|---|---|---|---|---|---|---|---|---|---|---|---|---|---|---|---|---|
| Benchmark | [-] | 0.444 | ||||||||||||||
| I123pd | [-] | 0.442 | 0.535 | 0.444 | 0.0393 | 0.0584 | 1.09 | 1.86 | 0.558 | 0.396 | 0.726 | 0.782 | 0.571 | |||
| post5.4 | [-] | 0.471 | 0.568 | 0.444 | 0.0400 | 0.0900 | 1.11 | 1.86 | 0.554 | 0.393 | 0.726 | 0.789 | 0.571 |
Download Data |
Period Mean (original grids) [%] |
Model Period Mean (intersection) [%] |
Benchmark Period Mean (intersection) [%] |
Model Period Mean (complement) [%] |
Benchmark Period Mean (complement) [%] |
Bias [%] |
RMSE [%] |
Phase Shift [months] |
Bias Score [1] |
RMSE Score [1] |
Seasonal Cycle Score [1] |
Spatial Distribution Score [1] |
Overall Score [1] |
|||
|---|---|---|---|---|---|---|---|---|---|---|---|---|---|---|---|---|
| Benchmark | [-] | 1.72 | ||||||||||||||
| I123pd | [-] | 1.91 | 1.94 | 1.72 | 0.124 | 0.000748 | 0.196 | 3.81 | 2.59 | 0.598 | 0.361 | 0.587 | 0.911 | 0.564 | ||
| post5.4 | [-] | 2.00 | 2.03 | 1.72 | 0.130 | 0.000748 | 0.293 | 3.86 | 2.59 | 0.591 | 0.356 | 0.587 | 0.915 | 0.561 |
Download Data |
Period Mean (original grids) [%] |
Model Period Mean (intersection) [%] |
Benchmark Period Mean (intersection) [%] |
Model Period Mean (complement) [%] |
Benchmark Period Mean (complement) [%] |
Bias [%] |
RMSE [%] |
Phase Shift [months] |
Bias Score [1] |
RMSE Score [1] |
Seasonal Cycle Score [1] |
Spatial Distribution Score [1] |
Overall Score [1] |
|||
|---|---|---|---|---|---|---|---|---|---|---|---|---|---|---|---|---|
| Benchmark | [-] | 1.53 | ||||||||||||||
| I123pd | [-] | 2.39 | 2.47 | 1.54 | 0.447 | 0.0213 | 0.837 | 3.04 | 1.70 | 0.562 | 0.426 | 0.768 | 0.844 | 0.605 | ||
| post5.4 | [-] | 2.45 | 2.52 | 1.54 | 0.458 | 0.0213 | 0.892 | 3.08 | 1.69 | 0.556 | 0.423 | 0.769 | 0.840 | 0.602 |
Download Data |
Period Mean (original grids) [%] |
Model Period Mean (intersection) [%] |
Benchmark Period Mean (intersection) [%] |
Model Period Mean (complement) [%] |
Benchmark Period Mean (complement) [%] |
Bias [%] |
RMSE [%] |
Phase Shift [months] |
Bias Score [1] |
RMSE Score [1] |
Seasonal Cycle Score [1] |
Spatial Distribution Score [1] |
Overall Score [1] |
|||
|---|---|---|---|---|---|---|---|---|---|---|---|---|---|---|---|---|
| Benchmark | [-] | 0.0178 | ||||||||||||||
| I123pd | [-] | 0.0121 | 0.0126 | 0.0178 | 0.00310 | -0.00632 | 0.0514 | 2.16 | 0.814 | 0.605 | 0.667 | 0.372 | 0.613 | |||
| post5.4 | [-] | 0.0137 | 0.0143 | 0.0178 | 0.00375 | -0.00473 | 0.0527 | 2.17 | 0.799 | 0.586 | 0.667 | 0.404 | 0.608 |
Download Data |
Period Mean (original grids) [%] |
Model Period Mean (intersection) [%] |
Benchmark Period Mean (intersection) [%] |
Model Period Mean (complement) [%] |
Benchmark Period Mean (complement) [%] |
Bias [%] |
RMSE [%] |
Phase Shift [months] |
Bias Score [1] |
RMSE Score [1] |
Seasonal Cycle Score [1] |
Spatial Distribution Score [1] |
Overall Score [1] |
|||
|---|---|---|---|---|---|---|---|---|---|---|---|---|---|---|---|---|
| Benchmark | [-] | 0.0591 | ||||||||||||||
| I123pd | [-] | 0.105 | 0.101 | 0.0594 | 0.133 | 0.00361 | 0.0564 | 0.267 | 1.71 | 0.593 | 0.434 | 0.763 | 0.490 | 0.543 | ||
| post5.4 | [-] | 0.106 | 0.102 | 0.0594 | 0.134 | 0.00361 | 0.0574 | 0.260 | 1.72 | 0.592 | 0.437 | 0.761 | 0.486 | 0.542 |
Download Data |
Period Mean (original grids) [%] |
Model Period Mean (intersection) [%] |
Benchmark Period Mean (intersection) [%] |
Model Period Mean (complement) [%] |
Benchmark Period Mean (complement) [%] |
Bias [%] |
RMSE [%] |
Phase Shift [months] |
Bias Score [1] |
RMSE Score [1] |
Seasonal Cycle Score [1] |
Spatial Distribution Score [1] |
Overall Score [1] |
|||
|---|---|---|---|---|---|---|---|---|---|---|---|---|---|---|---|---|
| Benchmark | [-] | 0.0771 | ||||||||||||||
| I123pd | [-] | 0.113 | 0.111 | 0.0771 | 0.0250 | 0.00240 | 0.0332 | 0.249 | 1.23 | 0.624 | 0.477 | 0.849 | 0.743 | 0.634 | ||
| post5.4 | [-] | 0.116 | 0.114 | 0.0771 | 0.0258 | 0.00240 | 0.0358 | 0.251 | 1.23 | 0.621 | 0.476 | 0.849 | 0.740 | 0.632 |
Download Data |
Period Mean (original grids) [%] |
Model Period Mean (intersection) [%] |
Benchmark Period Mean (intersection) [%] |
Model Period Mean (complement) [%] |
Benchmark Period Mean (complement) [%] |
Bias [%] |
RMSE [%] |
Phase Shift [months] |
Bias Score [1] |
RMSE Score [1] |
Seasonal Cycle Score [1] |
Spatial Distribution Score [1] |
Overall Score [1] |
|||
|---|---|---|---|---|---|---|---|---|---|---|---|---|---|---|---|---|
| Benchmark | [-] | 0.112 | ||||||||||||||
| I123pd | [-] | 0.191 | 0.218 | 0.112 | 0.0122 | 0.000108 | 0.0991 | 0.423 | 2.39 | 0.602 | 0.354 | 0.620 | 0.670 | 0.520 | ||
| post5.4 | [-] | 0.204 | 0.233 | 0.112 | 0.0128 | 0.000108 | 0.114 | 0.453 | 2.42 | 0.596 | 0.342 | 0.620 | 0.645 | 0.509 |
Download Data |
Period Mean (original grids) [%] |
Model Period Mean (intersection) [%] |
Benchmark Period Mean (intersection) [%] |
Model Period Mean (complement) [%] |
Benchmark Period Mean (complement) [%] |
Bias [%] |
RMSE [%] |
Phase Shift [months] |
Bias Score [1] |
RMSE Score [1] |
Seasonal Cycle Score [1] |
Spatial Distribution Score [1] |
Overall Score [1] |
|||
|---|---|---|---|---|---|---|---|---|---|---|---|---|---|---|---|---|
| Benchmark | [-] | 0.178 | ||||||||||||||
| I123pd | [-] | 0.242 | 0.255 | 0.178 | 0.0887 | 0.00952 | 0.0711 | 0.644 | 1.68 | 0.429 | 0.223 | 0.774 | 0.650 | 0.460 | ||
| post5.4 | [-] | 0.244 | 0.257 | 0.178 | 0.0909 | 0.00952 | 0.0731 | 0.647 | 1.69 | 0.427 | 0.222 | 0.772 | 0.651 | 0.459 |
Download Data |
Period Mean (original grids) [%] |
Model Period Mean (intersection) [%] |
Benchmark Period Mean (intersection) [%] |
Model Period Mean (complement) [%] |
Benchmark Period Mean (complement) [%] |
Bias [%] |
RMSE [%] |
Phase Shift [months] |
Bias Score [1] |
RMSE Score [1] |
Seasonal Cycle Score [1] |
Spatial Distribution Score [1] |
Overall Score [1] |
|||
|---|---|---|---|---|---|---|---|---|---|---|---|---|---|---|---|---|
| Benchmark | [-] | 0.00960 | ||||||||||||||
| I123pd | [-] | 0.00994 | 0.0111 | 0.00960 | 0.00123 | 0.000904 | 0.0357 | 2.96 | 0.847 | 0.574 | 0.512 | 0.563 | 0.614 | |||
| post5.4 | [-] | 0.0109 | 0.0121 | 0.00960 | 0.00149 | 0.00185 | 0.0381 | 2.98 | 0.842 | 0.568 | 0.511 | 0.590 | 0.616 |
Download Data |
Period Mean (original grids) [%] |
Model Period Mean (intersection) [%] |
Benchmark Period Mean (intersection) [%] |
Model Period Mean (complement) [%] |
Benchmark Period Mean (complement) [%] |
Bias [%] |
RMSE [%] |
Phase Shift [months] |
Bias Score [1] |
RMSE Score [1] |
Seasonal Cycle Score [1] |
Spatial Distribution Score [1] |
Overall Score [1] |
|||
|---|---|---|---|---|---|---|---|---|---|---|---|---|---|---|---|---|
| Benchmark | [-] | 0.523 | ||||||||||||||
| I123pd | [-] | 0.623 | 0.627 | 0.524 | 0.552 | 0.0578 | 0.120 | 1.04 | 1.63 | 0.625 | 0.528 | 0.782 | 0.807 | 0.654 | ||
| post5.4 | [-] | 0.655 | 0.659 | 0.524 | 0.565 | 0.0578 | 0.151 | 1.06 | 1.63 | 0.617 | 0.522 | 0.783 | 0.796 | 0.648 |
Download Data |
Period Mean (original grids) [%] |
Model Period Mean (intersection) [%] |
Benchmark Period Mean (intersection) [%] |
Model Period Mean (complement) [%] |
Benchmark Period Mean (complement) [%] |
Bias [%] |
RMSE [%] |
Phase Shift [months] |
Bias Score [1] |
RMSE Score [1] |
Seasonal Cycle Score [1] |
Spatial Distribution Score [1] |
Overall Score [1] |
|||
|---|---|---|---|---|---|---|---|---|---|---|---|---|---|---|---|---|
| Benchmark | [-] | 0.0208 | ||||||||||||||
| I123pd | [-] | 0.0925 | 0.0953 | 0.0208 | 0.0369 | 0.0291 | 0.0687 | 0.188 | 2.24 | 0.403 | 0.213 | 0.661 | 0.372 | 0.372 | ||
| post5.4 | [-] | 0.0971 | 0.0995 | 0.0208 | 0.0400 | 0.0291 | 0.0728 | 0.201 | 2.25 | 0.388 | 0.199 | 0.663 | 0.358 | 0.361 |
Download Data |
Period Mean (original grids) [%] |
Model Period Mean (intersection) [%] |
Benchmark Period Mean (intersection) [%] |
Model Period Mean (complement) [%] |
Benchmark Period Mean (complement) [%] |
Bias [%] |
RMSE [%] |
Phase Shift [months] |
Bias Score [1] |
RMSE Score [1] |
Seasonal Cycle Score [1] |
Spatial Distribution Score [1] |
Overall Score [1] |
|||
|---|---|---|---|---|---|---|---|---|---|---|---|---|---|---|---|---|
| Benchmark | [-] | 0.321 | ||||||||||||||
| I123pd | [-] | 0.430 | 0.501 | 0.321 | 0.0272 | 0.0122 | 0.159 | 0.787 | 2.01 | 0.580 | 0.397 | 0.699 | 0.836 | 0.582 | ||
| post5.4 | [-] | 0.445 | 0.519 | 0.321 | 0.0279 | 0.0122 | 0.175 | 0.800 | 2.02 | 0.574 | 0.392 | 0.698 | 0.828 | 0.577 |
Download Data |
Period Mean (original grids) [%] |
Model Period Mean (intersection) [%] |
Benchmark Period Mean (intersection) [%] |
Model Period Mean (complement) [%] |
Benchmark Period Mean (complement) [%] |
Bias [%] |
RMSE [%] |
Phase Shift [months] |
Bias Score [1] |
RMSE Score [1] |
Seasonal Cycle Score [1] |
Spatial Distribution Score [1] |
Overall Score [1] |
|||
|---|---|---|---|---|---|---|---|---|---|---|---|---|---|---|---|---|
| Benchmark | [-] | 0.0190 | ||||||||||||||
| I123pd | [-] | 0.0317 | 0.0867 | 0.0190 | 0.00344 | 0.00167 | 0.0705 | 0.194 | 2.61 | 0.559 | 0.416 | 0.585 | 0.382 | 0.472 | ||
| post5.4 | [-] | 0.0315 | 0.0863 | 0.0190 | 0.00347 | 0.00167 | 0.0704 | 0.193 | 2.59 | 0.562 | 0.419 | 0.588 | 0.371 | 0.471 |
Download Data |
Period Mean (original grids) [%] |
Model Period Mean (intersection) [%] |
Benchmark Period Mean (intersection) [%] |
Model Period Mean (complement) [%] |
Benchmark Period Mean (complement) [%] |
Bias [%] |
RMSE [%] |
Phase Shift [months] |
Bias Score [1] |
RMSE Score [1] |
Seasonal Cycle Score [1] |
Spatial Distribution Score [1] |
Overall Score [1] |
|||
|---|---|---|---|---|---|---|---|---|---|---|---|---|---|---|---|---|
| Benchmark | [-] | 0.0144 | ||||||||||||||
| I123pd | [-] | 0.0110 | 0.0126 | 0.0144 | 0.00104 | -0.00304 | 0.0422 | 3.50 | 0.901 | 0.642 | 0.407 | 0.548 | 0.628 | |||
| post5.4 | [-] | 0.0135 | 0.0154 | 0.0144 | 0.00142 | -0.000445 | 0.0444 | 3.51 | 0.893 | 0.626 | 0.406 | 0.647 | 0.640 |
Download Data |
Period Mean (original grids) [%] |
Model Period Mean (intersection) [%] |
Benchmark Period Mean (intersection) [%] |
Model Period Mean (complement) [%] |
Benchmark Period Mean (complement) [%] |
Bias [%] |
RMSE [%] |
Phase Shift [months] |
Bias Score [1] |
RMSE Score [1] |
Seasonal Cycle Score [1] |
Spatial Distribution Score [1] |
Overall Score [1] |
|||
|---|---|---|---|---|---|---|---|---|---|---|---|---|---|---|---|---|
| Benchmark | [-] | 0.0897 | ||||||||||||||
| I123pd | [-] | 0.592 | 0.632 | 0.0901 | 0.266 | 0.0100 | 0.465 | 0.733 | 1.70 | 0.343 | 0.228 | 0.770 | 0.0915 | 0.332 | ||
| post5.4 | [-] | 0.605 | 0.646 | 0.0901 | 0.271 | 0.0100 | 0.477 | 0.745 | 1.70 | 0.340 | 0.227 | 0.769 | 0.0887 | 0.330 |
Download Data |
Period Mean (original grids) [%] |
Model Period Mean (intersection) [%] |
Benchmark Period Mean (intersection) [%] |
Model Period Mean (complement) [%] |
Benchmark Period Mean (complement) [%] |
Bias [%] |
RMSE [%] |
Phase Shift [months] |
Bias Score [1] |
RMSE Score [1] |
Seasonal Cycle Score [1] |
Spatial Distribution Score [1] |
Overall Score [1] |
|||
|---|---|---|---|---|---|---|---|---|---|---|---|---|---|---|---|---|
| Benchmark | [-] | 0.0299 | ||||||||||||||
| I123pd | [-] | 0.0333 | 0.0326 | 0.0299 | 0.0238 | 0.00173 | 0.00237 | 0.0831 | 2.35 | 0.519 | 0.343 | 0.641 | 0.395 | 0.448 | ||
| post5.4 | [-] | 0.0351 | 0.0342 | 0.0299 | 0.0257 | 0.00173 | 0.00384 | 0.0848 | 2.37 | 0.512 | 0.336 | 0.638 | 0.432 | 0.451 |
Download Data |
Period Mean (original grids) [%] |
Model Period Mean (intersection) [%] |
Benchmark Period Mean (intersection) [%] |
Model Period Mean (complement) [%] |
Benchmark Period Mean (complement) [%] |
Bias [%] |
RMSE [%] |
Phase Shift [months] |
Bias Score [1] |
RMSE Score [1] |
Seasonal Cycle Score [1] |
Spatial Distribution Score [1] |
Overall Score [1] |
|||
|---|---|---|---|---|---|---|---|---|---|---|---|---|---|---|---|---|
| Benchmark | [-] | 0.0269 | ||||||||||||||
| I123pd | [-] | 0.0352 | 0.0358 | 0.0269 | 0.0107 | 0.00812 | 0.0923 | 2.26 | 0.628 | 0.445 | 0.653 | 0.665 | 0.567 | |||
| post5.4 | [-] | 0.0372 | 0.0377 | 0.0269 | 0.0131 | 0.0100 | 0.0941 | 2.26 | 0.620 | 0.435 | 0.653 | 0.687 | 0.566 |
Download Data |
Period Mean (original grids) [%] |
Model Period Mean (intersection) [%] |
Benchmark Period Mean (intersection) [%] |
Model Period Mean (complement) [%] |
Benchmark Period Mean (complement) [%] |
Bias [%] |
RMSE [%] |
Phase Shift [months] |
Bias Score [1] |
RMSE Score [1] |
Seasonal Cycle Score [1] |
Spatial Distribution Score [1] |
Overall Score [1] |
|||
|---|---|---|---|---|---|---|---|---|---|---|---|---|---|---|---|---|
| Benchmark | [-] | 0.0292 | ||||||||||||||
| I123pd | [-] | 0.0696 | 0.0728 | 0.0292 | 0.0157 | 0.0445 | 0.117 | 1.93 | 0.529 | 0.463 | 0.709 | 0.494 | 0.532 | |||
| post5.4 | [-] | 0.0746 | 0.0781 | 0.0292 | 0.0158 | 0.0499 | 0.122 | 1.93 | 0.519 | 0.455 | 0.709 | 0.443 | 0.516 |
Download Data |
Period Mean (original grids) [%] |
Model Period Mean (intersection) [%] |
Benchmark Period Mean (intersection) [%] |
Model Period Mean (complement) [%] |
Benchmark Period Mean (complement) [%] |
Bias [%] |
RMSE [%] |
Phase Shift [months] |
Bias Score [1] |
RMSE Score [1] |
Seasonal Cycle Score [1] |
Spatial Distribution Score [1] |
Overall Score [1] |
|||
|---|---|---|---|---|---|---|---|---|---|---|---|---|---|---|---|---|
| Benchmark | [-] | 0.130 | ||||||||||||||
| I123pd | [-] | 0.133 | 0.131 | 0.130 | 0.119 | 0.00169 | 0.00332 | 0.272 | 1.24 | 0.573 | 0.439 | 0.837 | 0.677 | 0.593 | ||
| post5.4 | [-] | 0.134 | 0.132 | 0.130 | 0.123 | 0.00169 | 0.00470 | 0.274 | 1.24 | 0.571 | 0.438 | 0.836 | 0.669 | 0.591 |
Download Data |
Period Mean (original grids) [%] |
Model Period Mean (intersection) [%] |
Benchmark Period Mean (intersection) [%] |
Model Period Mean (complement) [%] |
Benchmark Period Mean (complement) [%] |
Bias [%] |
RMSE [%] |
Phase Shift [months] |
Bias Score [1] |
RMSE Score [1] |
Seasonal Cycle Score [1] |
Spatial Distribution Score [1] |
Overall Score [1] |
|||
|---|---|---|---|---|---|---|---|---|---|---|---|---|---|---|---|---|
| Benchmark | [-] | 0.220 | ||||||||||||||
| I123pd | [-] | 0.795 | 0.801 | 0.220 | 0.0893 | 0.00831 | 0.556 | 0.939 | 1.23 | 0.357 | 0.278 | 0.842 | 0.351 | 0.421 | ||
| post5.4 | [-] | 0.803 | 0.809 | 0.220 | 0.0822 | 0.00831 | 0.564 | 0.942 | 1.25 | 0.360 | 0.283 | 0.839 | 0.341 | 0.421 |
Download Data |
Period Mean (original grids) [%] |
Model Period Mean (intersection) [%] |
Benchmark Period Mean (intersection) [%] |
Model Period Mean (complement) [%] |
Benchmark Period Mean (complement) [%] |
Bias [%] |
RMSE [%] |
Phase Shift [months] |
Bias Score [1] |
RMSE Score [1] |
Seasonal Cycle Score [1] |
Spatial Distribution Score [1] |
Overall Score [1] |
|||
|---|---|---|---|---|---|---|---|---|---|---|---|---|---|---|---|---|
| Benchmark | [-] | 0.0284 | ||||||||||||||
| I123pd | [-] | 0.212 | 0.213 | 0.0284 | 0.0445 | 0.00383 | 0.178 | 0.265 | 1.64 | 0.516 | 0.374 | 0.766 | 0.0917 | 0.424 | ||
| post5.4 | [-] | 0.217 | 0.218 | 0.0284 | 0.0452 | 0.00383 | 0.183 | 0.270 | 1.65 | 0.514 | 0.373 | 0.765 | 0.0864 | 0.422 |
Temporally integrated period mean