Mean State
Download Data |
Period Mean (original grids) [Pg yr-1] |
Model Period Mean (intersection) [Pg yr-1] |
Benchmark Period Mean (intersection) [Pg yr-1] |
Model Period Mean (complement) [Pg yr-1] |
Benchmark Period Mean (complement) [Pg yr-1] |
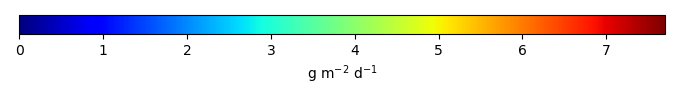
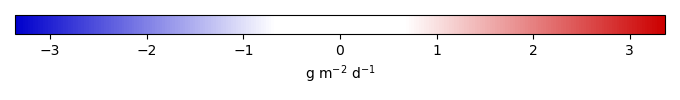
Bias [g m-2 d-1] |
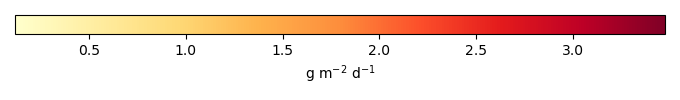
RMSE [g m-2 d-1] |
Phase Shift [months] |
Bias Score [1] |
RMSE Score [1] |
Seasonal Cycle Score [1] |
Spatial Distribution Score [1] |
Overall Score [1] |
|||
|---|---|---|---|---|---|---|---|---|---|---|---|---|---|---|---|---|
| Benchmark | [-] | 6.57 | ||||||||||||||
| I123pd | [-] | 7.50 | 7.51 | 6.57 | 0.268 | 0.770 | 1.36 | 2.08 | 0.475 | 0.768 | 0.661 | 0.909 | 0.716 | |||
| post5.4 | [-] | 7.65 | 7.66 | 6.57 | 0.274 | 0.870 | 1.44 | 2.09 | 0.451 | 0.763 | 0.657 | 0.898 | 0.706 |
Download Data |
Period Mean (original grids) [Pg yr-1] |
Model Period Mean (intersection) [Pg yr-1] |
Benchmark Period Mean (intersection) [Pg yr-1] |
Model Period Mean (complement) [Pg yr-1] |
Benchmark Period Mean (complement) [Pg yr-1] |
Bias [g m-2 d-1] |
RMSE [g m-2 d-1] |
Phase Shift [months] |
Bias Score [1] |
RMSE Score [1] |
Seasonal Cycle Score [1] |
Spatial Distribution Score [1] |
Overall Score [1] |
|||
|---|---|---|---|---|---|---|---|---|---|---|---|---|---|---|---|---|
| Benchmark | [-] | 5.94 | ||||||||||||||
| I123pd | [-] | 5.30 | 4.93 | 5.94 | 0.0509 | -0.363 | 1.17 | 0.998 | 0.601 | 0.474 | 0.890 | 0.967 | 0.681 | |||
| post5.4 | [-] | 5.54 | 5.16 | 5.94 | 0.0524 | -0.270 | 1.16 | 1.03 | 0.613 | 0.465 | 0.884 | 0.971 | 0.680 |
Download Data |
Period Mean (original grids) [Pg yr-1] |
Model Period Mean (intersection) [Pg yr-1] |
Benchmark Period Mean (intersection) [Pg yr-1] |
Model Period Mean (complement) [Pg yr-1] |
Benchmark Period Mean (complement) [Pg yr-1] |
Bias [g m-2 d-1] |
RMSE [g m-2 d-1] |
Phase Shift [months] |
Bias Score [1] |
RMSE Score [1] |
Seasonal Cycle Score [1] |
Spatial Distribution Score [1] |
Overall Score [1] |
|||
|---|---|---|---|---|---|---|---|---|---|---|---|---|---|---|---|---|
| Benchmark | [-] | 7.90 | ||||||||||||||
| I123pd | [-] | 7.11 | 6.64 | 7.90 | 0.391 | 0.000665 | -0.248 | 1.17 | 1.05 | 0.570 | 0.651 | 0.875 | 0.810 | 0.712 | ||
| post5.4 | [-] | 7.36 | 6.87 | 7.90 | 0.406 | 0.000665 | -0.172 | 1.17 | 1.05 | 0.575 | 0.655 | 0.876 | 0.790 | 0.710 |
Download Data |
Period Mean (original grids) [Pg yr-1] |
Model Period Mean (intersection) [Pg yr-1] |
Benchmark Period Mean (intersection) [Pg yr-1] |
Model Period Mean (complement) [Pg yr-1] |
Benchmark Period Mean (complement) [Pg yr-1] |
Bias [g m-2 d-1] |
RMSE [g m-2 d-1] |
Phase Shift [months] |
Bias Score [1] |
RMSE Score [1] |
Seasonal Cycle Score [1] |
Spatial Distribution Score [1] |
Overall Score [1] |
|||
|---|---|---|---|---|---|---|---|---|---|---|---|---|---|---|---|---|
| Benchmark | [-] | 0.726 | ||||||||||||||
| I123pd | [-] | 1.03 | 0.975 | 0.726 | 0.0656 | 0.305 | 0.983 | 0.0197 | 0.346 | 0.299 | 0.998 | 0.429 | 0.474 | |||
| post5.4 | [-] | 1.13 | 1.07 | 0.726 | 0.0710 | 0.396 | 1.11 | 0.0133 | 0.308 | 0.265 | 0.999 | 0.396 | 0.446 |
Download Data |
Period Mean (original grids) [Pg yr-1] |
Model Period Mean (intersection) [Pg yr-1] |
Benchmark Period Mean (intersection) [Pg yr-1] |
Model Period Mean (complement) [Pg yr-1] |
Benchmark Period Mean (complement) [Pg yr-1] |
Bias [g m-2 d-1] |
RMSE [g m-2 d-1] |
Phase Shift [months] |
Bias Score [1] |
RMSE Score [1] |
Seasonal Cycle Score [1] |
Spatial Distribution Score [1] |
Overall Score [1] |
|||
|---|---|---|---|---|---|---|---|---|---|---|---|---|---|---|---|---|
| Benchmark | [-] | 5.62 | ||||||||||||||
| I123pd | [-] | 6.49 | 5.11 | 5.61 | 1.33 | 0.00684 | 1.24 | 1.77 | 2.14 | 0.510 | 0.887 | 0.678 | 0.894 | 0.771 | ||
| post5.4 | [-] | 6.57 | 5.18 | 5.61 | 1.35 | 0.00684 | 1.34 | 1.84 | 2.06 | 0.488 | 0.896 | 0.700 | 0.875 | 0.771 |
Download Data |
Period Mean (original grids) [Pg yr-1] |
Model Period Mean (intersection) [Pg yr-1] |
Benchmark Period Mean (intersection) [Pg yr-1] |
Model Period Mean (complement) [Pg yr-1] |
Benchmark Period Mean (complement) [Pg yr-1] |
Bias [g m-2 d-1] |
RMSE [g m-2 d-1] |
Phase Shift [months] |
Bias Score [1] |
RMSE Score [1] |
Seasonal Cycle Score [1] |
Spatial Distribution Score [1] |
Overall Score [1] |
|||
|---|---|---|---|---|---|---|---|---|---|---|---|---|---|---|---|---|
| Benchmark | [-] | 5.00 | ||||||||||||||
| I123pd | [-] | 5.68 | 5.43 | 5.00 | 0.0860 | 4.17e-06 | 0.160 | 0.956 | 0.125 | 0.394 | 0.410 | 0.992 | 0.803 | 0.602 | ||
| post5.4 | [-] | 5.84 | 5.59 | 5.00 | 0.0886 | 4.17e-06 | 0.211 | 0.981 | 0.128 | 0.382 | 0.405 | 0.992 | 0.792 | 0.595 |
Download Data |
Period Mean (original grids) [Pg yr-1] |
Model Period Mean (intersection) [Pg yr-1] |
Benchmark Period Mean (intersection) [Pg yr-1] |
Model Period Mean (complement) [Pg yr-1] |
Benchmark Period Mean (complement) [Pg yr-1] |
Bias [g m-2 d-1] |
RMSE [g m-2 d-1] |
Phase Shift [months] |
Bias Score [1] |
RMSE Score [1] |
Seasonal Cycle Score [1] |
Spatial Distribution Score [1] |
Overall Score [1] |
|||
|---|---|---|---|---|---|---|---|---|---|---|---|---|---|---|---|---|
| Benchmark | [-] | 8.08 | ||||||||||||||
| I123pd | [-] | 9.27 | 8.96 | 8.08 | 0.440 | 0.239 | 0.800 | 0.462 | 0.562 | 0.577 | 0.963 | 0.946 | 0.725 | |||
| post5.4 | [-] | 9.23 | 8.91 | 8.08 | 0.447 | 0.232 | 0.779 | 0.462 | 0.572 | 0.588 | 0.963 | 0.942 | 0.730 |
Download Data |
Period Mean (original grids) [Pg yr-1] |
Model Period Mean (intersection) [Pg yr-1] |
Benchmark Period Mean (intersection) [Pg yr-1] |
Model Period Mean (complement) [Pg yr-1] |
Benchmark Period Mean (complement) [Pg yr-1] |
Bias [g m-2 d-1] |
RMSE [g m-2 d-1] |
Phase Shift [months] |
Bias Score [1] |
RMSE Score [1] |
Seasonal Cycle Score [1] |
Spatial Distribution Score [1] |
Overall Score [1] |
|||
|---|---|---|---|---|---|---|---|---|---|---|---|---|---|---|---|---|
| Benchmark | [-] | 7.56 | ||||||||||||||
| I123pd | [-] | 7.46 | 6.71 | 7.56 | 0.664 | 0.00210 | 0.0324 | 0.984 | 0.885 | 0.649 | 0.720 | 0.899 | 0.928 | 0.783 | ||
| post5.4 | [-] | 7.58 | 6.81 | 7.56 | 0.676 | 0.00210 | 0.0849 | 0.990 | 0.861 | 0.638 | 0.733 | 0.905 | 0.912 | 0.784 |
Download Data |
Period Mean (original grids) [Pg yr-1] |
Model Period Mean (intersection) [Pg yr-1] |
Benchmark Period Mean (intersection) [Pg yr-1] |
Model Period Mean (complement) [Pg yr-1] |
Benchmark Period Mean (complement) [Pg yr-1] |
Bias [g m-2 d-1] |
RMSE [g m-2 d-1] |
Phase Shift [months] |
Bias Score [1] |
RMSE Score [1] |
Seasonal Cycle Score [1] |
Spatial Distribution Score [1] |
Overall Score [1] |
|||
|---|---|---|---|---|---|---|---|---|---|---|---|---|---|---|---|---|
| Benchmark | [-] | 0.836 | ||||||||||||||
| I123pd | [-] | 1.45 | 1.44 | 0.836 | 0.0501 | 0.545 | 1.34 | 0.208 | 0.259 | 0.135 | 0.982 | 0.540 | 0.410 | |||
| post5.4 | [-] | 1.58 | 1.56 | 0.836 | 0.0545 | 0.651 | 1.52 | 0.183 | 0.189 | 0.107 | 0.984 | 0.544 | 0.386 |
Download Data |
Period Mean (original grids) [Pg yr-1] |
Model Period Mean (intersection) [Pg yr-1] |
Benchmark Period Mean (intersection) [Pg yr-1] |
Model Period Mean (complement) [Pg yr-1] |
Benchmark Period Mean (complement) [Pg yr-1] |
Bias [g m-2 d-1] |
RMSE [g m-2 d-1] |
Phase Shift [months] |
Bias Score [1] |
RMSE Score [1] |
Seasonal Cycle Score [1] |
Spatial Distribution Score [1] |
Overall Score [1] |
|||
|---|---|---|---|---|---|---|---|---|---|---|---|---|---|---|---|---|
| Benchmark | [-] | 3.99 | ||||||||||||||
| I123pd | [-] | 3.71 | 3.36 | 3.99 | 0.341 | 0.00574 | -0.0302 | 0.501 | 1.15 | 0.724 | 0.796 | 0.854 | 0.932 | 0.820 | ||
| post5.4 | [-] | 3.85 | 3.47 | 3.99 | 0.358 | 0.00574 | 0.0176 | 0.508 | 1.11 | 0.723 | 0.793 | 0.859 | 0.911 | 0.815 |
Download Data |
Period Mean (original grids) [Pg yr-1] |
Model Period Mean (intersection) [Pg yr-1] |
Benchmark Period Mean (intersection) [Pg yr-1] |
Model Period Mean (complement) [Pg yr-1] |
Benchmark Period Mean (complement) [Pg yr-1] |
Bias [g m-2 d-1] |
RMSE [g m-2 d-1] |
Phase Shift [months] |
Bias Score [1] |
RMSE Score [1] |
Seasonal Cycle Score [1] |
Spatial Distribution Score [1] |
Overall Score [1] |
|||
|---|---|---|---|---|---|---|---|---|---|---|---|---|---|---|---|---|
| Benchmark | [-] | 3.77 | ||||||||||||||
| I123pd | [-] | 3.71 | 3.31 | 3.77 | 0.321 | 0.00430 | 0.0220 | 0.940 | 0.300 | 0.524 | 0.563 | 0.980 | 0.958 | 0.717 | ||
| post5.4 | [-] | 3.81 | 3.39 | 3.77 | 0.333 | 0.00430 | 0.0776 | 0.937 | 0.280 | 0.516 | 0.571 | 0.981 | 0.961 | 0.720 |
Download Data |
Period Mean (original grids) [Pg yr-1] |
Model Period Mean (intersection) [Pg yr-1] |
Benchmark Period Mean (intersection) [Pg yr-1] |
Model Period Mean (complement) [Pg yr-1] |
Benchmark Period Mean (complement) [Pg yr-1] |
Bias [g m-2 d-1] |
RMSE [g m-2 d-1] |
Phase Shift [months] |
Bias Score [1] |
RMSE Score [1] |
Seasonal Cycle Score [1] |
Spatial Distribution Score [1] |
Overall Score [1] |
|||
|---|---|---|---|---|---|---|---|---|---|---|---|---|---|---|---|---|
| Benchmark | [-] | 96.0 | ||||||||||||||
| I123pd | [-] | 108. | 102. | 95.9 | 6.28 | 0.0299 | 0.308 | 1.02 | 0.824 | 0.529 | 0.618 | 0.900 | 0.929 | 0.719 | ||
| post5.4 | [-] | 111. | 104. | 95.9 | 6.45 | 0.0299 | 0.372 | 1.06 | 0.833 | 0.517 | 0.617 | 0.900 | 0.919 | 0.714 |
Download Data |
Period Mean (original grids) [Pg yr-1] |
Model Period Mean (intersection) [Pg yr-1] |
Benchmark Period Mean (intersection) [Pg yr-1] |
Model Period Mean (complement) [Pg yr-1] |
Benchmark Period Mean (complement) [Pg yr-1] |
Bias [g m-2 d-1] |
RMSE [g m-2 d-1] |
Phase Shift [months] |
Bias Score [1] |
RMSE Score [1] |
Seasonal Cycle Score [1] |
Spatial Distribution Score [1] |
Overall Score [1] |
|||
|---|---|---|---|---|---|---|---|---|---|---|---|---|---|---|---|---|
| Benchmark | [-] | 1.81 | ||||||||||||||
| I123pd | [-] | 1.63 | 1.40 | 1.81 | 0.257 | -0.126 | 0.630 | 1.08 | 0.618 | 0.629 | 0.869 | 0.860 | 0.721 | |||
| post5.4 | [-] | 1.66 | 1.42 | 1.81 | 0.260 | -0.111 | 0.627 | 1.07 | 0.609 | 0.637 | 0.871 | 0.843 | 0.719 |
Download Data |
Period Mean (original grids) [Pg yr-1] |
Model Period Mean (intersection) [Pg yr-1] |
Benchmark Period Mean (intersection) [Pg yr-1] |
Model Period Mean (complement) [Pg yr-1] |
Benchmark Period Mean (complement) [Pg yr-1] |
Bias [g m-2 d-1] |
RMSE [g m-2 d-1] |
Phase Shift [months] |
Bias Score [1] |
RMSE Score [1] |
Seasonal Cycle Score [1] |
Spatial Distribution Score [1] |
Overall Score [1] |
|||
|---|---|---|---|---|---|---|---|---|---|---|---|---|---|---|---|---|
| Benchmark | [-] | 1.22 | ||||||||||||||
| I123pd | [-] | 2.27 | 2.08 | 1.22 | 0.150 | 0.502 | 1.16 | 0.315 | 0.332 | 0.325 | 0.976 | 0.457 | 0.483 | |||
| post5.4 | [-] | 2.41 | 2.22 | 1.22 | 0.161 | 0.573 | 1.26 | 0.316 | 0.306 | 0.305 | 0.976 | 0.422 | 0.463 |
Download Data |
Period Mean (original grids) [Pg yr-1] |
Model Period Mean (intersection) [Pg yr-1] |
Benchmark Period Mean (intersection) [Pg yr-1] |
Model Period Mean (complement) [Pg yr-1] |
Benchmark Period Mean (complement) [Pg yr-1] |
Bias [g m-2 d-1] |
RMSE [g m-2 d-1] |
Phase Shift [months] |
Bias Score [1] |
RMSE Score [1] |
Seasonal Cycle Score [1] |
Spatial Distribution Score [1] |
Overall Score [1] |
|||
|---|---|---|---|---|---|---|---|---|---|---|---|---|---|---|---|---|
| Benchmark | [-] | 3.14 | ||||||||||||||
| I123pd | [-] | 3.28 | 2.61 | 3.14 | 0.563 | 0.00891 | 0.328 | 0.984 | 0.902 | 0.605 | 0.754 | 0.900 | 0.919 | 0.786 | ||
| post5.4 | [-] | 3.38 | 2.70 | 3.14 | 0.583 | 0.00891 | 0.437 | 1.06 | 0.890 | 0.581 | 0.747 | 0.902 | 0.900 | 0.775 |
Download Data |
Period Mean (original grids) [Pg yr-1] |
Model Period Mean (intersection) [Pg yr-1] |
Benchmark Period Mean (intersection) [Pg yr-1] |
Model Period Mean (complement) [Pg yr-1] |
Benchmark Period Mean (complement) [Pg yr-1] |
Bias [g m-2 d-1] |
RMSE [g m-2 d-1] |
Phase Shift [months] |
Bias Score [1] |
RMSE Score [1] |
Seasonal Cycle Score [1] |
Spatial Distribution Score [1] |
Overall Score [1] |
|||
|---|---|---|---|---|---|---|---|---|---|---|---|---|---|---|---|---|
| Benchmark | [-] | 3.54 | ||||||||||||||
| I123pd | [-] | 4.28 | 4.00 | 3.54 | 0.204 | 0.469 | 0.823 | 0.476 | 0.592 | 0.701 | 0.968 | 0.831 | 0.759 | |||
| post5.4 | [-] | 4.28 | 4.00 | 3.54 | 0.209 | 0.474 | 0.908 | 0.655 | 0.549 | 0.679 | 0.956 | 0.729 | 0.719 |
Download Data |
Period Mean (original grids) [Pg yr-1] |
Model Period Mean (intersection) [Pg yr-1] |
Benchmark Period Mean (intersection) [Pg yr-1] |
Model Period Mean (complement) [Pg yr-1] |
Benchmark Period Mean (complement) [Pg yr-1] |
Bias [g m-2 d-1] |
RMSE [g m-2 d-1] |
Phase Shift [months] |
Bias Score [1] |
RMSE Score [1] |
Seasonal Cycle Score [1] |
Spatial Distribution Score [1] |
Overall Score [1] |
|||
|---|---|---|---|---|---|---|---|---|---|---|---|---|---|---|---|---|
| Benchmark | [-] | 2.86 | ||||||||||||||
| I123pd | [-] | 3.41 | 3.27 | 2.86 | 0.186 | 0.301 | 0.823 | 0.116 | 0.498 | 0.562 | 0.992 | 0.915 | 0.706 | |||
| post5.4 | [-] | 3.40 | 3.25 | 2.86 | 0.190 | 0.295 | 0.799 | 0.250 | 0.515 | 0.580 | 0.983 | 0.885 | 0.709 |
Download Data |
Period Mean (original grids) [Pg yr-1] |
Model Period Mean (intersection) [Pg yr-1] |
Benchmark Period Mean (intersection) [Pg yr-1] |
Model Period Mean (complement) [Pg yr-1] |
Benchmark Period Mean (complement) [Pg yr-1] |
Bias [g m-2 d-1] |
RMSE [g m-2 d-1] |
Phase Shift [months] |
Bias Score [1] |
RMSE Score [1] |
Seasonal Cycle Score [1] |
Spatial Distribution Score [1] |
Overall Score [1] |
|||
|---|---|---|---|---|---|---|---|---|---|---|---|---|---|---|---|---|
| Benchmark | [-] | 1.48 | ||||||||||||||
| I123pd | [-] | 1.60 | 1.64 | 1.48 | 0.0426 | 0.163 | 0.561 | 0.599 | 0.624 | 0.728 | 0.949 | 0.867 | 0.779 | |||
| post5.4 | [-] | 1.61 | 1.65 | 1.48 | 0.0439 | 0.171 | 0.553 | 0.664 | 0.622 | 0.739 | 0.942 | 0.849 | 0.778 |
Download Data |
Period Mean (original grids) [Pg yr-1] |
Model Period Mean (intersection) [Pg yr-1] |
Benchmark Period Mean (intersection) [Pg yr-1] |
Model Period Mean (complement) [Pg yr-1] |
Benchmark Period Mean (complement) [Pg yr-1] |
Bias [g m-2 d-1] |
RMSE [g m-2 d-1] |
Phase Shift [months] |
Bias Score [1] |
RMSE Score [1] |
Seasonal Cycle Score [1] |
Spatial Distribution Score [1] |
Overall Score [1] |
|||
|---|---|---|---|---|---|---|---|---|---|---|---|---|---|---|---|---|
| Benchmark | [-] | 17.1 | ||||||||||||||
| I123pd | [-] | 22.1 | 21.5 | 17.1 | 0.489 | 1.59 | 1.79 | 2.03 | 0.438 | 0.874 | 0.696 | 0.917 | 0.760 | |||
| post5.4 | [-] | 22.6 | 22.0 | 17.1 | 0.502 | 1.76 | 1.95 | 2.01 | 0.399 | 0.870 | 0.700 | 0.922 | 0.752 |
Download Data |
Period Mean (original grids) [Pg yr-1] |
Model Period Mean (intersection) [Pg yr-1] |
Benchmark Period Mean (intersection) [Pg yr-1] |
Model Period Mean (complement) [Pg yr-1] |
Benchmark Period Mean (complement) [Pg yr-1] |
Bias [g m-2 d-1] |
RMSE [g m-2 d-1] |
Phase Shift [months] |
Bias Score [1] |
RMSE Score [1] |
Seasonal Cycle Score [1] |
Spatial Distribution Score [1] |
Overall Score [1] |
|||
|---|---|---|---|---|---|---|---|---|---|---|---|---|---|---|---|---|
| Benchmark | [-] | 7.61 | ||||||||||||||
| I123pd | [-] | 9.37 | 9.29 | 7.61 | 0.237 | 0.00136 | 0.811 | 1.32 | 0.860 | 0.522 | 0.754 | 0.917 | 0.716 | 0.732 | ||
| post5.4 | [-] | 9.81 | 9.73 | 7.61 | 0.246 | 0.00136 | 0.998 | 1.46 | 0.882 | 0.478 | 0.746 | 0.914 | 0.683 | 0.713 |
Download Data |
Period Mean (original grids) [Pg yr-1] |
Model Period Mean (intersection) [Pg yr-1] |
Benchmark Period Mean (intersection) [Pg yr-1] |
Model Period Mean (complement) [Pg yr-1] |
Benchmark Period Mean (complement) [Pg yr-1] |
Bias [g m-2 d-1] |
RMSE [g m-2 d-1] |
Phase Shift [months] |
Bias Score [1] |
RMSE Score [1] |
Seasonal Cycle Score [1] |
Spatial Distribution Score [1] |
Overall Score [1] |
|||
|---|---|---|---|---|---|---|---|---|---|---|---|---|---|---|---|---|
| Benchmark | [-] | 1.21 | ||||||||||||||
| I123pd | [-] | 1.51 | 1.33 | 1.21 | 0.123 | 0.285 | 0.769 | 1.10 | 0.538 | 0.726 | 0.874 | 0.898 | 0.752 | |||
| post5.4 | [-] | 1.55 | 1.37 | 1.21 | 0.126 | 0.332 | 0.794 | 1.13 | 0.524 | 0.720 | 0.867 | 0.887 | 0.744 |
Temporally integrated period mean