Mean State
Download Data |
Period Mean (original grids) [Pg yr-1] |
Model Period Mean (intersection) [Pg yr-1] |
Benchmark Period Mean (intersection) [Pg yr-1] |
Model Period Mean (complement) [Pg yr-1] |
Benchmark Period Mean (complement) [Pg yr-1] |
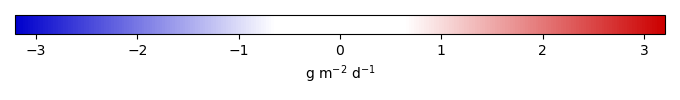
Bias [g m-2 d-1] |
RMSE [g m-2 d-1] |
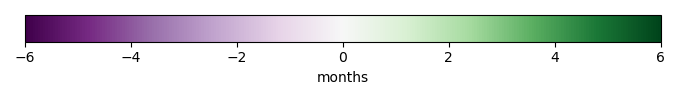
Phase Shift [months] |
Bias Score [1] |
RMSE Score [1] |
Seasonal Cycle Score [1] |
Spatial Distribution Score [1] |
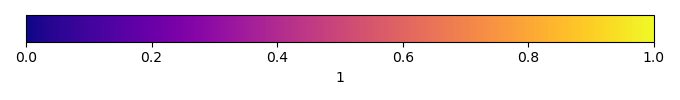
Overall Score [1] |
|||
|---|---|---|---|---|---|---|---|---|---|---|---|---|---|---|---|---|
| Benchmark | [-] | 7.00 | ||||||||||||||
| I123pd | [-] | 8.20 | 8.26 | 7.00 | 0.258 | 0.959 | 1.90 | 2.91 | 0.374 | 0.447 | 0.517 | 0.903 | 0.538 | |||
| post5.4 | [-] | 8.33 | 8.40 | 7.00 | 0.262 | 1.05 | 1.96 | 2.89 | 0.364 | 0.447 | 0.518 | 0.894 | 0.534 |
Download Data |
Period Mean (original grids) [Pg yr-1] |
Model Period Mean (intersection) [Pg yr-1] |
Benchmark Period Mean (intersection) [Pg yr-1] |
Model Period Mean (complement) [Pg yr-1] |
Benchmark Period Mean (complement) [Pg yr-1] |
Bias [g m-2 d-1] |
RMSE [g m-2 d-1] |
Phase Shift [months] |
Bias Score [1] |
RMSE Score [1] |
Seasonal Cycle Score [1] |
Spatial Distribution Score [1] |
Overall Score [1] |
|||
|---|---|---|---|---|---|---|---|---|---|---|---|---|---|---|---|---|
| Benchmark | [-] | 6.99 | ||||||||||||||
| I123pd | [-] | 6.27 | 5.92 | 6.99 | 0.0395 | -0.350 | 1.92 | 1.29 | 0.584 | 0.443 | 0.829 | 0.790 | 0.618 | |||
| post5.4 | [-] | 6.49 | 6.14 | 6.99 | 0.0402 | -0.262 | 1.89 | 1.29 | 0.591 | 0.443 | 0.829 | 0.817 | 0.625 |
Download Data |
Period Mean (original grids) [Pg yr-1] |
Model Period Mean (intersection) [Pg yr-1] |
Benchmark Period Mean (intersection) [Pg yr-1] |
Model Period Mean (complement) [Pg yr-1] |
Benchmark Period Mean (complement) [Pg yr-1] |
Bias [g m-2 d-1] |
RMSE [g m-2 d-1] |
Phase Shift [months] |
Bias Score [1] |
RMSE Score [1] |
Seasonal Cycle Score [1] |
Spatial Distribution Score [1] |
Overall Score [1] |
|||
|---|---|---|---|---|---|---|---|---|---|---|---|---|---|---|---|---|
| Benchmark | [-] | 10.0 | ||||||||||||||
| I123pd | [-] | 8.45 | 7.84 | 10.0 | 0.528 | 0.00214 | -0.508 | 1.77 | 1.41 | 0.531 | 0.491 | 0.811 | 0.816 | 0.628 | ||
| post5.4 | [-] | 8.74 | 8.10 | 10.0 | 0.549 | 0.00214 | -0.418 | 1.77 | 1.44 | 0.534 | 0.495 | 0.808 | 0.792 | 0.625 |
Download Data |
Period Mean (original grids) [Pg yr-1] |
Model Period Mean (intersection) [Pg yr-1] |
Benchmark Period Mean (intersection) [Pg yr-1] |
Model Period Mean (complement) [Pg yr-1] |
Benchmark Period Mean (complement) [Pg yr-1] |
Bias [g m-2 d-1] |
RMSE [g m-2 d-1] |
Phase Shift [months] |
Bias Score [1] |
RMSE Score [1] |
Seasonal Cycle Score [1] |
Spatial Distribution Score [1] |
Overall Score [1] |
|||
|---|---|---|---|---|---|---|---|---|---|---|---|---|---|---|---|---|
| Benchmark | [-] | 1.17 | ||||||||||||||
| I123pd | [-] | 1.15 | 1.07 | 1.17 | 0.0869 | 0.0208 | 1.13 | 0.102 | 0.684 | 0.460 | 0.987 | 0.512 | 0.621 | |||
| post5.4 | [-] | 1.28 | 1.20 | 1.17 | 0.0963 | 0.141 | 1.27 | 0.0929 | 0.655 | 0.425 | 0.990 | 0.473 | 0.594 |
Download Data |
Period Mean (original grids) [Pg yr-1] |
Model Period Mean (intersection) [Pg yr-1] |
Benchmark Period Mean (intersection) [Pg yr-1] |
Model Period Mean (complement) [Pg yr-1] |
Benchmark Period Mean (complement) [Pg yr-1] |
Bias [g m-2 d-1] |
RMSE [g m-2 d-1] |
Phase Shift [months] |
Bias Score [1] |
RMSE Score [1] |
Seasonal Cycle Score [1] |
Spatial Distribution Score [1] |
Overall Score [1] |
|||
|---|---|---|---|---|---|---|---|---|---|---|---|---|---|---|---|---|
| Benchmark | [-] | 5.36 | ||||||||||||||
| I123pd | [-] | 6.91 | 5.08 | 5.36 | 1.79 | 1.35 | 2.12 | 2.72 | 0.223 | 0.454 | 0.568 | 0.970 | 0.534 | |||
| post5.4 | [-] | 6.95 | 5.10 | 5.36 | 1.80 | 1.39 | 2.15 | 2.86 | 0.209 | 0.478 | 0.544 | 0.977 | 0.537 |
Download Data |
Period Mean (original grids) [Pg yr-1] |
Model Period Mean (intersection) [Pg yr-1] |
Benchmark Period Mean (intersection) [Pg yr-1] |
Model Period Mean (complement) [Pg yr-1] |
Benchmark Period Mean (complement) [Pg yr-1] |
Bias [g m-2 d-1] |
RMSE [g m-2 d-1] |
Phase Shift [months] |
Bias Score [1] |
RMSE Score [1] |
Seasonal Cycle Score [1] |
Spatial Distribution Score [1] |
Overall Score [1] |
|||
|---|---|---|---|---|---|---|---|---|---|---|---|---|---|---|---|---|
| Benchmark | [-] | 5.72 | ||||||||||||||
| I123pd | [-] | 6.36 | 6.07 | 5.72 | 0.101 | 0.146 | 1.00 | 0.580 | 0.784 | 0.672 | 0.961 | 0.689 | 0.756 | |||
| post5.4 | [-] | 6.68 | 6.39 | 5.72 | 0.106 | 0.247 | 1.11 | 0.626 | 0.767 | 0.647 | 0.958 | 0.664 | 0.736 |
Download Data |
Period Mean (original grids) [Pg yr-1] |
Model Period Mean (intersection) [Pg yr-1] |
Benchmark Period Mean (intersection) [Pg yr-1] |
Model Period Mean (complement) [Pg yr-1] |
Benchmark Period Mean (complement) [Pg yr-1] |
Bias [g m-2 d-1] |
RMSE [g m-2 d-1] |
Phase Shift [months] |
Bias Score [1] |
RMSE Score [1] |
Seasonal Cycle Score [1] |
Spatial Distribution Score [1] |
Overall Score [1] |
|||
|---|---|---|---|---|---|---|---|---|---|---|---|---|---|---|---|---|
| Benchmark | [-] | 11.3 | ||||||||||||||
| I123pd | [-] | 10.4 | 10.0 | 11.3 | 0.562 | -0.113 | 0.960 | 0.978 | 0.670 | 0.550 | 0.891 | 0.969 | 0.726 | |||
| post5.4 | [-] | 10.3 | 9.86 | 11.3 | 0.564 | -0.135 | 0.989 | 0.979 | 0.667 | 0.543 | 0.896 | 0.969 | 0.723 |
Download Data |
Period Mean (original grids) [Pg yr-1] |
Model Period Mean (intersection) [Pg yr-1] |
Benchmark Period Mean (intersection) [Pg yr-1] |
Model Period Mean (complement) [Pg yr-1] |
Benchmark Period Mean (complement) [Pg yr-1] |
Bias [g m-2 d-1] |
RMSE [g m-2 d-1] |
Phase Shift [months] |
Bias Score [1] |
RMSE Score [1] |
Seasonal Cycle Score [1] |
Spatial Distribution Score [1] |
Overall Score [1] |
|||
|---|---|---|---|---|---|---|---|---|---|---|---|---|---|---|---|---|
| Benchmark | [-] | 8.23 | ||||||||||||||
| I123pd | [-] | 8.68 | 7.71 | 8.23 | 0.879 | 0.190 | 1.54 | 2.29 | 0.620 | 0.452 | 0.657 | 0.951 | 0.626 | |||
| post5.4 | [-] | 8.64 | 7.67 | 8.23 | 0.885 | 0.178 | 1.53 | 2.25 | 0.607 | 0.461 | 0.664 | 0.939 | 0.627 |
Download Data |
Period Mean (original grids) [Pg yr-1] |
Model Period Mean (intersection) [Pg yr-1] |
Benchmark Period Mean (intersection) [Pg yr-1] |
Model Period Mean (complement) [Pg yr-1] |
Benchmark Period Mean (complement) [Pg yr-1] |
Bias [g m-2 d-1] |
RMSE [g m-2 d-1] |
Phase Shift [months] |
Bias Score [1] |
RMSE Score [1] |
Seasonal Cycle Score [1] |
Spatial Distribution Score [1] |
Overall Score [1] |
|||
|---|---|---|---|---|---|---|---|---|---|---|---|---|---|---|---|---|
| Benchmark | [-] | 1.24 | ||||||||||||||
| I123pd | [-] | 1.62 | 1.57 | 1.24 | 0.0768 | 0.303 | 1.48 | 0.144 | 0.681 | 0.345 | 0.983 | 0.449 | 0.561 | |||
| post5.4 | [-] | 1.77 | 1.72 | 1.24 | 0.0861 | 0.435 | 1.69 | 0.164 | 0.637 | 0.300 | 0.982 | 0.433 | 0.530 |
Download Data |
Period Mean (original grids) [Pg yr-1] |
Model Period Mean (intersection) [Pg yr-1] |
Benchmark Period Mean (intersection) [Pg yr-1] |
Model Period Mean (complement) [Pg yr-1] |
Benchmark Period Mean (complement) [Pg yr-1] |
Bias [g m-2 d-1] |
RMSE [g m-2 d-1] |
Phase Shift [months] |
Bias Score [1] |
RMSE Score [1] |
Seasonal Cycle Score [1] |
Spatial Distribution Score [1] |
Overall Score [1] |
|||
|---|---|---|---|---|---|---|---|---|---|---|---|---|---|---|---|---|
| Benchmark | [-] | 3.83 | ||||||||||||||
| I123pd | [-] | 3.98 | 3.44 | 3.83 | 0.525 | 0.00383 | 0.713 | 2.16 | 0.580 | 0.489 | 0.663 | 0.909 | 0.626 | |||
| post5.4 | [-] | 4.12 | 3.55 | 3.83 | 0.554 | 0.0509 | 0.733 | 2.15 | 0.574 | 0.480 | 0.666 | 0.880 | 0.616 |
Download Data |
Period Mean (original grids) [Pg yr-1] |
Model Period Mean (intersection) [Pg yr-1] |
Benchmark Period Mean (intersection) [Pg yr-1] |
Model Period Mean (complement) [Pg yr-1] |
Benchmark Period Mean (complement) [Pg yr-1] |
Bias [g m-2 d-1] |
RMSE [g m-2 d-1] |
Phase Shift [months] |
Bias Score [1] |
RMSE Score [1] |
Seasonal Cycle Score [1] |
Spatial Distribution Score [1] |
Overall Score [1] |
|||
|---|---|---|---|---|---|---|---|---|---|---|---|---|---|---|---|---|
| Benchmark | [-] | 4.65 | ||||||||||||||
| I123pd | [-] | 4.58 | 4.03 | 4.64 | 0.488 | 0.0102 | -0.0297 | 1.42 | 0.390 | 0.744 | 0.534 | 0.971 | 0.928 | 0.742 | ||
| post5.4 | [-] | 4.61 | 4.06 | 4.64 | 0.496 | 0.0102 | -0.00740 | 1.46 | 0.409 | 0.735 | 0.527 | 0.970 | 0.929 | 0.737 |
Download Data |
Period Mean (original grids) [Pg yr-1] |
Model Period Mean (intersection) [Pg yr-1] |
Benchmark Period Mean (intersection) [Pg yr-1] |
Model Period Mean (complement) [Pg yr-1] |
Benchmark Period Mean (complement) [Pg yr-1] |
Bias [g m-2 d-1] |
RMSE [g m-2 d-1] |
Phase Shift [months] |
Bias Score [1] |
RMSE Score [1] |
Seasonal Cycle Score [1] |
Spatial Distribution Score [1] |
Overall Score [1] |
|||
|---|---|---|---|---|---|---|---|---|---|---|---|---|---|---|---|---|
| Benchmark | [-] | 115. | ||||||||||||||
| I123pd | [-] | 120. | 111. | 115. | 8.21 | 0.0125 | 0.0774 | 1.23 | 1.40 | 0.563 | 0.509 | 0.807 | 0.938 | 0.666 | ||
| post5.4 | [-] | 123. | 114. | 115. | 8.41 | 0.0125 | 0.130 | 1.28 | 1.41 | 0.553 | 0.502 | 0.806 | 0.930 | 0.659 |
Download Data |
Period Mean (original grids) [Pg yr-1] |
Model Period Mean (intersection) [Pg yr-1] |
Benchmark Period Mean (intersection) [Pg yr-1] |
Model Period Mean (complement) [Pg yr-1] |
Benchmark Period Mean (complement) [Pg yr-1] |
Bias [g m-2 d-1] |
RMSE [g m-2 d-1] |
Phase Shift [months] |
Bias Score [1] |
RMSE Score [1] |
Seasonal Cycle Score [1] |
Spatial Distribution Score [1] |
Overall Score [1] |
|||
|---|---|---|---|---|---|---|---|---|---|---|---|---|---|---|---|---|
| Benchmark | [-] | 3.67 | ||||||||||||||
| I123pd | [-] | 1.87 | 1.72 | 3.67 | 0.179 | 2.58e-05 | -0.288 | 0.539 | 2.04 | 0.309 | 0.441 | 0.700 | 0.881 | 0.554 | ||
| post5.4 | [-] | 1.86 | 1.71 | 3.67 | 0.179 | 2.58e-05 | -0.290 | 0.541 | 2.09 | 0.308 | 0.441 | 0.689 | 0.879 | 0.551 |
Download Data |
Period Mean (original grids) [Pg yr-1] |
Model Period Mean (intersection) [Pg yr-1] |
Benchmark Period Mean (intersection) [Pg yr-1] |
Model Period Mean (complement) [Pg yr-1] |
Benchmark Period Mean (complement) [Pg yr-1] |
Bias [g m-2 d-1] |
RMSE [g m-2 d-1] |
Phase Shift [months] |
Bias Score [1] |
RMSE Score [1] |
Seasonal Cycle Score [1] |
Spatial Distribution Score [1] |
Overall Score [1] |
|||
|---|---|---|---|---|---|---|---|---|---|---|---|---|---|---|---|---|
| Benchmark | [-] | 2.02 | ||||||||||||||
| I123pd | [-] | 2.43 | 2.17 | 2.02 | 0.232 | 0.138 | 1.27 | 0.746 | 0.532 | 0.368 | 0.903 | 0.328 | 0.500 | |||
| post5.4 | [-] | 2.63 | 2.34 | 2.02 | 0.252 | 0.229 | 1.40 | 0.682 | 0.513 | 0.340 | 0.916 | 0.295 | 0.481 |
Download Data |
Period Mean (original grids) [Pg yr-1] |
Model Period Mean (intersection) [Pg yr-1] |
Benchmark Period Mean (intersection) [Pg yr-1] |
Model Period Mean (complement) [Pg yr-1] |
Benchmark Period Mean (complement) [Pg yr-1] |
Bias [g m-2 d-1] |
RMSE [g m-2 d-1] |
Phase Shift [months] |
Bias Score [1] |
RMSE Score [1] |
Seasonal Cycle Score [1] |
Spatial Distribution Score [1] |
Overall Score [1] |
|||
|---|---|---|---|---|---|---|---|---|---|---|---|---|---|---|---|---|
| Benchmark | [-] | 3.26 | ||||||||||||||
| I123pd | [-] | 3.70 | 2.82 | 3.26 | 0.770 | 0.334 | 1.57 | 1.84 | 0.544 | 0.475 | 0.739 | 0.860 | 0.619 | |||
| post5.4 | [-] | 3.80 | 2.90 | 3.26 | 0.795 | 0.445 | 1.64 | 1.82 | 0.534 | 0.465 | 0.744 | 0.839 | 0.609 |
Download Data |
Period Mean (original grids) [Pg yr-1] |
Model Period Mean (intersection) [Pg yr-1] |
Benchmark Period Mean (intersection) [Pg yr-1] |
Model Period Mean (complement) [Pg yr-1] |
Benchmark Period Mean (complement) [Pg yr-1] |
Bias [g m-2 d-1] |
RMSE [g m-2 d-1] |
Phase Shift [months] |
Bias Score [1] |
RMSE Score [1] |
Seasonal Cycle Score [1] |
Spatial Distribution Score [1] |
Overall Score [1] |
|||
|---|---|---|---|---|---|---|---|---|---|---|---|---|---|---|---|---|
| Benchmark | [-] | 5.12 | ||||||||||||||
| I123pd | [-] | 4.96 | 4.61 | 5.12 | 0.259 | -0.232 | 1.54 | 1.14 | 0.825 | 0.567 | 0.874 | 0.961 | 0.759 | |||
| post5.4 | [-] | 4.91 | 4.55 | 5.12 | 0.265 | -0.264 | 1.63 | 1.18 | 0.800 | 0.551 | 0.870 | 0.866 | 0.728 |
Download Data |
Period Mean (original grids) [Pg yr-1] |
Model Period Mean (intersection) [Pg yr-1] |
Benchmark Period Mean (intersection) [Pg yr-1] |
Model Period Mean (complement) [Pg yr-1] |
Benchmark Period Mean (complement) [Pg yr-1] |
Bias [g m-2 d-1] |
RMSE [g m-2 d-1] |
Phase Shift [months] |
Bias Score [1] |
RMSE Score [1] |
Seasonal Cycle Score [1] |
Spatial Distribution Score [1] |
Overall Score [1] |
|||
|---|---|---|---|---|---|---|---|---|---|---|---|---|---|---|---|---|
| Benchmark | [-] | 3.22 | ||||||||||||||
| I123pd | [-] | 3.81 | 3.60 | 3.22 | 0.250 | 0.275 | 1.08 | 0.715 | 0.744 | 0.616 | 0.943 | 0.809 | 0.746 | |||
| post5.4 | [-] | 3.86 | 3.64 | 3.22 | 0.258 | 0.299 | 1.17 | 0.801 | 0.712 | 0.600 | 0.937 | 0.775 | 0.725 |
Download Data |
Period Mean (original grids) [Pg yr-1] |
Model Period Mean (intersection) [Pg yr-1] |
Benchmark Period Mean (intersection) [Pg yr-1] |
Model Period Mean (complement) [Pg yr-1] |
Benchmark Period Mean (complement) [Pg yr-1] |
Bias [g m-2 d-1] |
RMSE [g m-2 d-1] |
Phase Shift [months] |
Bias Score [1] |
RMSE Score [1] |
Seasonal Cycle Score [1] |
Spatial Distribution Score [1] |
Overall Score [1] |
|||
|---|---|---|---|---|---|---|---|---|---|---|---|---|---|---|---|---|
| Benchmark | [-] | 2.11 | ||||||||||||||
| I123pd | [-] | 1.81 | 1.85 | 2.11 | 0.0571 | -0.138 | 0.810 | 0.735 | 0.666 | 0.592 | 0.922 | 0.809 | 0.716 | |||
| post5.4 | [-] | 1.80 | 1.84 | 2.11 | 0.0583 | -0.145 | 0.835 | 0.753 | 0.661 | 0.586 | 0.918 | 0.801 | 0.710 |
Download Data |
Period Mean (original grids) [Pg yr-1] |
Model Period Mean (intersection) [Pg yr-1] |
Benchmark Period Mean (intersection) [Pg yr-1] |
Model Period Mean (complement) [Pg yr-1] |
Benchmark Period Mean (complement) [Pg yr-1] |
Bias [g m-2 d-1] |
RMSE [g m-2 d-1] |
Phase Shift [months] |
Bias Score [1] |
RMSE Score [1] |
Seasonal Cycle Score [1] |
Spatial Distribution Score [1] |
Overall Score [1] |
|||
|---|---|---|---|---|---|---|---|---|---|---|---|---|---|---|---|---|
| Benchmark | [-] | 18.8 | ||||||||||||||
| I123pd | [-] | 23.1 | 22.4 | 18.8 | 0.587 | 1.35 | 1.60 | 2.21 | 0.316 | 0.584 | 0.662 | 0.991 | 0.627 | |||
| post5.4 | [-] | 23.6 | 22.9 | 18.8 | 0.602 | 1.50 | 1.73 | 2.20 | 0.280 | 0.582 | 0.664 | 0.989 | 0.620 |
Download Data |
Period Mean (original grids) [Pg yr-1] |
Model Period Mean (intersection) [Pg yr-1] |
Benchmark Period Mean (intersection) [Pg yr-1] |
Model Period Mean (complement) [Pg yr-1] |
Benchmark Period Mean (complement) [Pg yr-1] |
Bias [g m-2 d-1] |
RMSE [g m-2 d-1] |
Phase Shift [months] |
Bias Score [1] |
RMSE Score [1] |
Seasonal Cycle Score [1] |
Spatial Distribution Score [1] |
Overall Score [1] |
|||
|---|---|---|---|---|---|---|---|---|---|---|---|---|---|---|---|---|
| Benchmark | [-] | 10.1 | ||||||||||||||
| I123pd | [-] | 10.0 | 9.87 | 10.1 | 0.325 | -0.0102 | 1.55 | 1.33 | 0.624 | 0.589 | 0.839 | 0.804 | 0.689 | |||
| post5.4 | [-] | 10.5 | 10.3 | 10.1 | 0.335 | 0.171 | 1.59 | 1.32 | 0.618 | 0.585 | 0.841 | 0.778 | 0.681 |
Download Data |
Period Mean (original grids) [Pg yr-1] |
Model Period Mean (intersection) [Pg yr-1] |
Benchmark Period Mean (intersection) [Pg yr-1] |
Model Period Mean (complement) [Pg yr-1] |
Benchmark Period Mean (complement) [Pg yr-1] |
Bias [g m-2 d-1] |
RMSE [g m-2 d-1] |
Phase Shift [months] |
Bias Score [1] |
RMSE Score [1] |
Seasonal Cycle Score [1] |
Spatial Distribution Score [1] |
Overall Score [1] |
|||
|---|---|---|---|---|---|---|---|---|---|---|---|---|---|---|---|---|
| Benchmark | [-] | 1.46 | ||||||||||||||
| I123pd | [-] | 1.60 | 1.36 | 1.46 | 0.181 | 6.40e-05 | 0.0647 | 1.13 | 1.45 | 0.395 | 0.443 | 0.801 | 0.645 | 0.545 | ||
| post5.4 | [-] | 1.65 | 1.40 | 1.46 | 0.189 | 6.40e-05 | 0.106 | 1.16 | 1.49 | 0.393 | 0.437 | 0.794 | 0.619 | 0.536 |
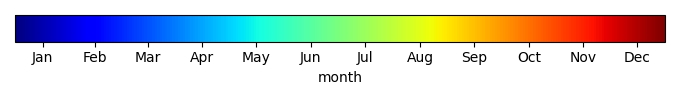
Temporally integrated period mean