Mean State
Download Data |
Period Mean (original grids) [1] |
Model Period Mean (intersection) [1] |
Benchmark Period Mean (intersection) [1] |
Model Period Mean (complement) [1] |
Benchmark Period Mean (complement) [1] |
Bias [1] |
RMSE [1] |
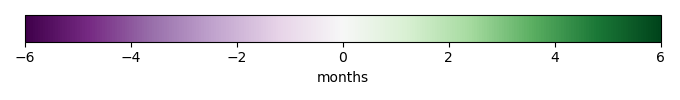
Phase Shift [months] |
Bias Score [1] |
RMSE Score [1] |
Seasonal Cycle Score [1] |
Spatial Distribution Score [1] |
Overall Score [1] |
|||
|---|---|---|---|---|---|---|---|---|---|---|---|---|---|---|---|---|
| Benchmark | [-] | 2.79 | ||||||||||||||
| I123pd | [-] | 3.55 | 3.53 | 2.79 | 2.56 | 0.690 | 1.19 | 2.70 | 0.213 | 0.444 | 0.554 | 0.934 | 0.518 | |||
| post5.4 | [-] | 3.68 | 3.66 | 2.79 | 2.66 | 0.825 | 1.31 | 2.75 | 0.191 | 0.445 | 0.549 | 0.917 | 0.509 |
Download Data |
Period Mean (original grids) [1] |
Model Period Mean (intersection) [1] |
Benchmark Period Mean (intersection) [1] |
Model Period Mean (complement) [1] |
Benchmark Period Mean (complement) [1] |
Bias [1] |
RMSE [1] |
Phase Shift [months] |
Bias Score [1] |
RMSE Score [1] |
Seasonal Cycle Score [1] |
Spatial Distribution Score [1] |
Overall Score [1] |
|||
|---|---|---|---|---|---|---|---|---|---|---|---|---|---|---|---|---|
| Benchmark | [-] | 0.915 | ||||||||||||||
| I123pd | [-] | 0.775 | 0.744 | 0.915 | 1.06 | 1.14 | -0.170 | 0.682 | 1.47 | 0.429 | 0.359 | 0.803 | 0.917 | 0.574 | ||
| post5.4 | [-] | 0.804 | 0.772 | 0.915 | 1.14 | 1.14 | -0.142 | 0.686 | 1.46 | 0.433 | 0.359 | 0.805 | 0.920 | 0.575 |
Download Data |
Period Mean (original grids) [1] |
Model Period Mean (intersection) [1] |
Benchmark Period Mean (intersection) [1] |
Model Period Mean (complement) [1] |
Benchmark Period Mean (complement) [1] |
Bias [1] |
RMSE [1] |
Phase Shift [months] |
Bias Score [1] |
RMSE Score [1] |
Seasonal Cycle Score [1] |
Spatial Distribution Score [1] |
Overall Score [1] |
|||
|---|---|---|---|---|---|---|---|---|---|---|---|---|---|---|---|---|
| Benchmark | [-] | 1.29 | ||||||||||||||
| I123pd | [-] | 1.21 | 1.20 | 1.28 | 1.36 | 1.62 | -0.0707 | 0.748 | 2.06 | 0.436 | 0.428 | 0.689 | 0.835 | 0.563 | ||
| post5.4 | [-] | 1.26 | 1.24 | 1.28 | 1.43 | 1.62 | -0.0248 | 0.768 | 2.05 | 0.436 | 0.429 | 0.688 | 0.799 | 0.556 |
Download Data |
Period Mean (original grids) [1] |
Model Period Mean (intersection) [1] |
Benchmark Period Mean (intersection) [1] |
Model Period Mean (complement) [1] |
Benchmark Period Mean (complement) [1] |
Bias [1] |
RMSE [1] |
Phase Shift [months] |
Bias Score [1] |
RMSE Score [1] |
Seasonal Cycle Score [1] |
Spatial Distribution Score [1] |
Overall Score [1] |
|||
|---|---|---|---|---|---|---|---|---|---|---|---|---|---|---|---|---|
| Benchmark | [-] | 0.679 | ||||||||||||||
| I123pd | [-] | 0.398 | 0.398 | 0.679 | 0.467 | -0.276 | 0.462 | 0.642 | 0.598 | 0.509 | 0.945 | 0.929 | 0.698 | |||
| post5.4 | [-] | 0.450 | 0.450 | 0.679 | 0.520 | -0.224 | 0.510 | 0.595 | 0.630 | 0.474 | 0.951 | 0.912 | 0.688 |
Download Data |
Period Mean (original grids) [1] |
Model Period Mean (intersection) [1] |
Benchmark Period Mean (intersection) [1] |
Model Period Mean (complement) [1] |
Benchmark Period Mean (complement) [1] |
Bias [1] |
RMSE [1] |
Phase Shift [months] |
Bias Score [1] |
RMSE Score [1] |
Seasonal Cycle Score [1] |
Spatial Distribution Score [1] |
Overall Score [1] |
|||
|---|---|---|---|---|---|---|---|---|---|---|---|---|---|---|---|---|
| Benchmark | [-] | 3.99 | ||||||||||||||
| I123pd | [-] | 5.59 | 5.62 | 3.99 | 5.27 | 4.11 | 1.46 | 1.65 | 3.04 | 0.200 | 0.665 | 0.511 | 0.957 | 0.600 | ||
| post5.4 | [-] | 5.83 | 5.86 | 3.99 | 5.50 | 4.11 | 1.69 | 1.86 | 3.00 | 0.169 | 0.674 | 0.518 | 0.937 | 0.595 |
Download Data |
Period Mean (original grids) [1] |
Model Period Mean (intersection) [1] |
Benchmark Period Mean (intersection) [1] |
Model Period Mean (complement) [1] |
Benchmark Period Mean (complement) [1] |
Bias [1] |
RMSE [1] |
Phase Shift [months] |
Bias Score [1] |
RMSE Score [1] |
Seasonal Cycle Score [1] |
Spatial Distribution Score [1] |
Overall Score [1] |
|||
|---|---|---|---|---|---|---|---|---|---|---|---|---|---|---|---|---|
| Benchmark | [-] | 1.20 | ||||||||||||||
| I123pd | [-] | 1.56 | 1.56 | 1.20 | 1.61 | 1.38 | 0.365 | 1.00 | 0.604 | 0.583 | 0.541 | 0.944 | 0.262 | 0.574 | ||
| post5.4 | [-] | 1.67 | 1.67 | 1.20 | 1.71 | 1.38 | 0.476 | 1.10 | 0.646 | 0.574 | 0.521 | 0.939 | 0.229 | 0.557 |
Download Data |
Period Mean (original grids) [1] |
Model Period Mean (intersection) [1] |
Benchmark Period Mean (intersection) [1] |
Model Period Mean (complement) [1] |
Benchmark Period Mean (complement) [1] |
Bias [1] |
RMSE [1] |
Phase Shift [months] |
Bias Score [1] |
RMSE Score [1] |
Seasonal Cycle Score [1] |
Spatial Distribution Score [1] |
Overall Score [1] |
|||
|---|---|---|---|---|---|---|---|---|---|---|---|---|---|---|---|---|
| Benchmark | [-] | 0.671 | ||||||||||||||
| I123pd | [-] | 1.20 | 1.20 | 0.671 | 1.70 | 1.49 | 0.616 | 0.888 | 1.22 | 0.359 | 0.358 | 0.852 | 0.414 | 0.468 | ||
| post5.4 | [-] | 1.20 | 1.21 | 0.671 | 1.78 | 1.49 | 0.626 | 0.894 | 1.22 | 0.374 | 0.368 | 0.850 | 0.379 | 0.468 |
Download Data |
Period Mean (original grids) [1] |
Model Period Mean (intersection) [1] |
Benchmark Period Mean (intersection) [1] |
Model Period Mean (complement) [1] |
Benchmark Period Mean (complement) [1] |
Bias [1] |
RMSE [1] |
Phase Shift [months] |
Bias Score [1] |
RMSE Score [1] |
Seasonal Cycle Score [1] |
Spatial Distribution Score [1] |
Overall Score [1] |
|||
|---|---|---|---|---|---|---|---|---|---|---|---|---|---|---|---|---|
| Benchmark | [-] | 1.38 | ||||||||||||||
| I123pd | [-] | 2.08 | 2.04 | 1.38 | 3.14 | 3.01 | 0.809 | 1.04 | 1.95 | 0.306 | 0.411 | 0.717 | 0.862 | 0.541 | ||
| post5.4 | [-] | 2.15 | 2.11 | 1.38 | 3.29 | 3.01 | 0.888 | 1.09 | 1.94 | 0.292 | 0.419 | 0.719 | 0.832 | 0.536 |
Download Data |
Period Mean (original grids) [1] |
Model Period Mean (intersection) [1] |
Benchmark Period Mean (intersection) [1] |
Model Period Mean (complement) [1] |
Benchmark Period Mean (complement) [1] |
Bias [1] |
RMSE [1] |
Phase Shift [months] |
Bias Score [1] |
RMSE Score [1] |
Seasonal Cycle Score [1] |
Spatial Distribution Score [1] |
Overall Score [1] |
|||
|---|---|---|---|---|---|---|---|---|---|---|---|---|---|---|---|---|
| Benchmark | [-] | 0.648 | ||||||||||||||
| I123pd | [-] | 0.531 | 0.540 | 0.648 | 0.415 | 0.619 | -0.127 | 0.553 | 0.843 | 0.635 | 0.424 | 0.916 | 0.782 | 0.636 | ||
| post5.4 | [-] | 0.594 | 0.605 | 0.648 | 0.463 | 0.619 | -0.0641 | 0.654 | 0.815 | 0.663 | 0.366 | 0.920 | 0.760 | 0.615 |
Download Data |
Period Mean (original grids) [1] |
Model Period Mean (intersection) [1] |
Benchmark Period Mean (intersection) [1] |
Model Period Mean (complement) [1] |
Benchmark Period Mean (complement) [1] |
Bias [1] |
RMSE [1] |
Phase Shift [months] |
Bias Score [1] |
RMSE Score [1] |
Seasonal Cycle Score [1] |
Spatial Distribution Score [1] |
Overall Score [1] |
|||
|---|---|---|---|---|---|---|---|---|---|---|---|---|---|---|---|---|
| Benchmark | [-] | 0.795 | ||||||||||||||
| I123pd | [-] | 0.666 | 0.633 | 0.790 | 1.75 | 2.28 | -0.0481 | 0.413 | 2.02 | 0.463 | 0.422 | 0.698 | 0.917 | 0.585 | ||
| post5.4 | [-] | 0.703 | 0.666 | 0.790 | 1.89 | 2.28 | -0.00401 | 0.423 | 2.01 | 0.459 | 0.412 | 0.698 | 0.919 | 0.580 |
Download Data |
Period Mean (original grids) [1] |
Model Period Mean (intersection) [1] |
Benchmark Period Mean (intersection) [1] |
Model Period Mean (complement) [1] |
Benchmark Period Mean (complement) [1] |
Bias [1] |
RMSE [1] |
Phase Shift [months] |
Bias Score [1] |
RMSE Score [1] |
Seasonal Cycle Score [1] |
Spatial Distribution Score [1] |
Overall Score [1] |
|||
|---|---|---|---|---|---|---|---|---|---|---|---|---|---|---|---|---|
| Benchmark | [-] | 1.13 | ||||||||||||||
| I123pd | [-] | 1.98 | 1.96 | 1.13 | 2.20 | 0.655 | 0.854 | 1.21 | 0.567 | 0.357 | 0.385 | 0.950 | 0.436 | 0.503 | ||
| post5.4 | [-] | 2.01 | 1.99 | 1.13 | 2.27 | 0.655 | 0.891 | 1.22 | 0.699 | 0.347 | 0.414 | 0.930 | 0.387 | 0.498 |
Download Data |
Period Mean (original grids) [1] |
Model Period Mean (intersection) [1] |
Benchmark Period Mean (intersection) [1] |
Model Period Mean (complement) [1] |
Benchmark Period Mean (complement) [1] |
Bias [1] |
RMSE [1] |
Phase Shift [months] |
Bias Score [1] |
RMSE Score [1] |
Seasonal Cycle Score [1] |
Spatial Distribution Score [1] |
Overall Score [1] |
|||
|---|---|---|---|---|---|---|---|---|---|---|---|---|---|---|---|---|
| Benchmark | [-] | 1.25 | ||||||||||||||
| I123pd | [-] | 1.44 | 1.58 | 1.25 | 0.331 | 2.46 | 0.390 | 0.819 | 1.72 | 0.378 | 0.446 | 0.753 | 0.861 | 0.577 | ||
| post5.4 | [-] | 1.50 | 1.64 | 1.25 | 0.348 | 2.46 | 0.457 | 0.871 | 1.74 | 0.373 | 0.444 | 0.749 | 0.832 | 0.568 |
Download Data |
Period Mean (original grids) [1] |
Model Period Mean (intersection) [1] |
Benchmark Period Mean (intersection) [1] |
Model Period Mean (complement) [1] |
Benchmark Period Mean (complement) [1] |
Bias [1] |
RMSE [1] |
Phase Shift [months] |
Bias Score [1] |
RMSE Score [1] |
Seasonal Cycle Score [1] |
Spatial Distribution Score [1] |
Overall Score [1] |
|||
|---|---|---|---|---|---|---|---|---|---|---|---|---|---|---|---|---|
| Benchmark | [-] | 0.178 | ||||||||||||||
| I123pd | [-] | 0.222 | 0.220 | 0.178 | 0.556 | 0.645 | 0.0659 | 0.283 | 2.39 | 0.196 | 0.443 | 0.626 | 0.495 | 0.441 | ||
| post5.4 | [-] | 0.220 | 0.217 | 0.178 | 0.553 | 0.645 | 0.0639 | 0.276 | 2.38 | 0.198 | 0.450 | 0.627 | 0.485 | 0.442 |
Download Data |
Period Mean (original grids) [1] |
Model Period Mean (intersection) [1] |
Benchmark Period Mean (intersection) [1] |
Model Period Mean (complement) [1] |
Benchmark Period Mean (complement) [1] |
Bias [1] |
RMSE [1] |
Phase Shift [months] |
Bias Score [1] |
RMSE Score [1] |
Seasonal Cycle Score [1] |
Spatial Distribution Score [1] |
Overall Score [1] |
|||
|---|---|---|---|---|---|---|---|---|---|---|---|---|---|---|---|---|
| Benchmark | [-] | 0.544 | ||||||||||||||
| I123pd | [-] | 0.571 | 0.564 | 0.544 | 0.434 | 0.161 | -0.00446 | 0.520 | 1.30 | 0.523 | 0.431 | 0.828 | 0.694 | 0.581 | ||
| post5.4 | [-] | 0.627 | 0.620 | 0.544 | 0.476 | 0.161 | 0.0490 | 0.598 | 1.26 | 0.510 | 0.396 | 0.833 | 0.637 | 0.554 |
Download Data |
Period Mean (original grids) [1] |
Model Period Mean (intersection) [1] |
Benchmark Period Mean (intersection) [1] |
Model Period Mean (complement) [1] |
Benchmark Period Mean (complement) [1] |
Bias [1] |
RMSE [1] |
Phase Shift [months] |
Bias Score [1] |
RMSE Score [1] |
Seasonal Cycle Score [1] |
Spatial Distribution Score [1] |
Overall Score [1] |
|||
|---|---|---|---|---|---|---|---|---|---|---|---|---|---|---|---|---|
| Benchmark | [-] | 1.78 | ||||||||||||||
| I123pd | [-] | 2.14 | 2.09 | 1.76 | 2.92 | 4.03 | 0.547 | 0.874 | 1.92 | 0.348 | 0.458 | 0.715 | 0.900 | 0.576 | ||
| post5.4 | [-] | 2.25 | 2.19 | 1.76 | 3.11 | 4.03 | 0.672 | 0.975 | 1.88 | 0.323 | 0.448 | 0.726 | 0.866 | 0.562 |
Download Data |
Period Mean (original grids) [1] |
Model Period Mean (intersection) [1] |
Benchmark Period Mean (intersection) [1] |
Model Period Mean (complement) [1] |
Benchmark Period Mean (complement) [1] |
Bias [1] |
RMSE [1] |
Phase Shift [months] |
Bias Score [1] |
RMSE Score [1] |
Seasonal Cycle Score [1] |
Spatial Distribution Score [1] |
Overall Score [1] |
|||
|---|---|---|---|---|---|---|---|---|---|---|---|---|---|---|---|---|
| Benchmark | [-] | 1.58 | ||||||||||||||
| I123pd | [-] | 2.30 | 2.34 | 1.58 | 2.03 | 0.895 | 0.818 | 1.22 | 1.14 | 0.496 | 0.524 | 0.872 | 0.586 | 0.600 | ||
| post5.4 | [-] | 2.33 | 2.37 | 1.58 | 2.11 | 0.895 | 0.856 | 1.27 | 1.44 | 0.488 | 0.521 | 0.832 | 0.523 | 0.577 |
Download Data |
Period Mean (original grids) [1] |
Model Period Mean (intersection) [1] |
Benchmark Period Mean (intersection) [1] |
Model Period Mean (complement) [1] |
Benchmark Period Mean (complement) [1] |
Bias [1] |
RMSE [1] |
Phase Shift [months] |
Bias Score [1] |
RMSE Score [1] |
Seasonal Cycle Score [1] |
Spatial Distribution Score [1] |
Overall Score [1] |
|||
|---|---|---|---|---|---|---|---|---|---|---|---|---|---|---|---|---|
| Benchmark | [-] | 1.20 | ||||||||||||||
| I123pd | [-] | 2.10 | 2.10 | 1.20 | 2.16 | 0.942 | 1.35 | 0.924 | 0.428 | 0.478 | 0.905 | 0.351 | 0.528 | |||
| post5.4 | [-] | 2.19 | 2.19 | 1.20 | 2.28 | 1.03 | 1.43 | 1.26 | 0.431 | 0.494 | 0.870 | 0.290 | 0.516 |
Download Data |
Period Mean (original grids) [1] |
Model Period Mean (intersection) [1] |
Benchmark Period Mean (intersection) [1] |
Model Period Mean (complement) [1] |
Benchmark Period Mean (complement) [1] |
Bias [1] |
RMSE [1] |
Phase Shift [months] |
Bias Score [1] |
RMSE Score [1] |
Seasonal Cycle Score [1] |
Spatial Distribution Score [1] |
Overall Score [1] |
|||
|---|---|---|---|---|---|---|---|---|---|---|---|---|---|---|---|---|
| Benchmark | [-] | 0.609 | ||||||||||||||
| I123pd | [-] | 1.07 | 1.05 | 0.609 | 4.29 | 0.510 | 0.727 | 1.09 | 0.360 | 0.354 | 0.870 | 0.348 | 0.457 | |||
| post5.4 | [-] | 1.08 | 1.06 | 0.609 | 4.66 | 0.528 | 0.737 | 1.14 | 0.376 | 0.376 | 0.846 | 0.294 | 0.454 |
Download Data |
Period Mean (original grids) [1] |
Model Period Mean (intersection) [1] |
Benchmark Period Mean (intersection) [1] |
Model Period Mean (complement) [1] |
Benchmark Period Mean (complement) [1] |
Bias [1] |
RMSE [1] |
Phase Shift [months] |
Bias Score [1] |
RMSE Score [1] |
Seasonal Cycle Score [1] |
Spatial Distribution Score [1] |
Overall Score [1] |
|||
|---|---|---|---|---|---|---|---|---|---|---|---|---|---|---|---|---|
| Benchmark | [-] | 4.44 | ||||||||||||||
| I123pd | [-] | 5.46 | 5.48 | 4.44 | 4.74 | 1.61 | 1.00 | 1.21 | 3.11 | 0.184 | 0.636 | 0.488 | 0.980 | 0.585 | ||
| post5.4 | [-] | 5.69 | 5.71 | 4.44 | 5.00 | 1.61 | 1.23 | 1.40 | 3.14 | 0.141 | 0.630 | 0.481 | 0.979 | 0.572 |
Download Data |
Period Mean (original grids) [1] |
Model Period Mean (intersection) [1] |
Benchmark Period Mean (intersection) [1] |
Model Period Mean (complement) [1] |
Benchmark Period Mean (complement) [1] |
Bias [1] |
RMSE [1] |
Phase Shift [months] |
Bias Score [1] |
RMSE Score [1] |
Seasonal Cycle Score [1] |
Spatial Distribution Score [1] |
Overall Score [1] |
|||
|---|---|---|---|---|---|---|---|---|---|---|---|---|---|---|---|---|
| Benchmark | [-] | 1.85 | ||||||||||||||
| I123pd | [-] | 2.12 | 2.10 | 1.85 | 2.65 | 1.04 | 0.247 | 0.910 | 2.07 | 0.405 | 0.495 | 0.700 | 0.921 | 0.603 | ||
| post5.4 | [-] | 2.26 | 2.25 | 1.85 | 2.84 | 1.04 | 0.392 | 1.00 | 2.06 | 0.382 | 0.482 | 0.702 | 0.888 | 0.587 |
Download Data |
Period Mean (original grids) [1] |
Model Period Mean (intersection) [1] |
Benchmark Period Mean (intersection) [1] |
Model Period Mean (complement) [1] |
Benchmark Period Mean (complement) [1] |
Bias [1] |
RMSE [1] |
Phase Shift [months] |
Bias Score [1] |
RMSE Score [1] |
Seasonal Cycle Score [1] |
Spatial Distribution Score [1] |
Overall Score [1] |
|||
|---|---|---|---|---|---|---|---|---|---|---|---|---|---|---|---|---|
| Benchmark | [-] | 0.633 | ||||||||||||||
| I123pd | [-] | 1.13 | 1.14 | 0.633 | 1.21 | 1.43 | 0.571 | 0.863 | 1.80 | 0.231 | 0.306 | 0.732 | 0.676 | 0.450 | ||
| post5.4 | [-] | 1.20 | 1.21 | 0.633 | 1.31 | 1.43 | 0.649 | 0.938 | 1.81 | 0.216 | 0.294 | 0.731 | 0.621 | 0.431 |
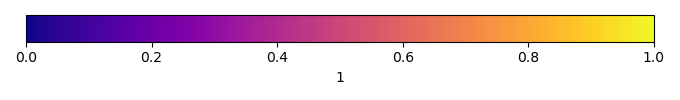
Temporally integrated period mean