Mean State
Download Data |
Period Mean (original grids) [Pg] |
Model Period Mean (intersection) [Pg] |
Benchmark Period Mean (intersection) [Pg] |
Model Period Mean (complement) [Pg] |
Benchmark Period Mean (complement) [Pg] |
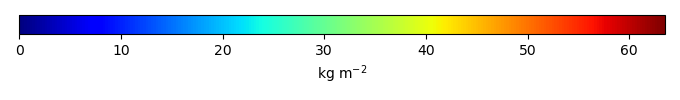
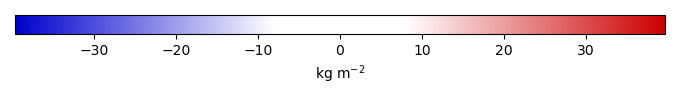
Bias [kg m-2] |
Bias Score [1] |
Spatial Distribution Score [1] |
Overall Score [1] |
|||
|---|---|---|---|---|---|---|---|---|---|---|---|---|
| Benchmark | [-] | 34.1 | ||||||||||
| I123pd | [-] | 56.1 | 57.2 | 34.1 | 0.572 | 0.00195 | 5.79 | 0.438 | 0.657 | 0.548 | ||
| post5.4 | [-] | 55.7 | 56.9 | 34.1 | 0.568 | 0.00195 | 5.71 | 0.441 | 0.663 | 0.552 |
Download Data |
Period Mean (original grids) [Pg] |
Model Period Mean (intersection) [Pg] |
Benchmark Period Mean (intersection) [Pg] |
Model Period Mean (complement) [Pg] |
Benchmark Period Mean (complement) [Pg] |
Bias [kg m-2] |
Bias Score [1] |
Spatial Distribution Score [1] |
Overall Score [1] |
|||
|---|---|---|---|---|---|---|---|---|---|---|---|---|
| Benchmark | [-] | 44.8 | ||||||||||
| I123pd | [-] | 30.1 | 28.1 | 44.8 | 0.0800 | 0.0633 | -2.34 | 0.613 | 0.867 | 0.740 | ||
| post5.4 | [-] | 29.9 | 27.9 | 44.8 | 0.0793 | 0.0633 | -2.37 | 0.612 | 0.869 | 0.741 |
Download Data |
Period Mean (original grids) [Pg] |
Model Period Mean (intersection) [Pg] |
Benchmark Period Mean (intersection) [Pg] |
Model Period Mean (complement) [Pg] |
Benchmark Period Mean (complement) [Pg] |
Bias [kg m-2] |
Bias Score [1] |
Spatial Distribution Score [1] |
Overall Score [1] |
|||
|---|---|---|---|---|---|---|---|---|---|---|---|---|
| Benchmark | [-] | 60.1 | ||||||||||
| I123pd | [-] | 54.2 | 52.4 | 60.0 | 1.31 | 0.0611 | -0.163 | 0.595 | 0.644 | 0.619 | ||
| post5.4 | [-] | 53.8 | 52.0 | 60.0 | 1.31 | 0.0611 | -0.208 | 0.595 | 0.649 | 0.622 |
Download Data |
Period Mean (original grids) [Pg] |
Model Period Mean (intersection) [Pg] |
Benchmark Period Mean (intersection) [Pg] |
Model Period Mean (complement) [Pg] |
Benchmark Period Mean (complement) [Pg] |
Bias [kg m-2] |
Bias Score [1] |
Spatial Distribution Score [1] |
Overall Score [1] |
|||
|---|---|---|---|---|---|---|---|---|---|---|---|---|
| Benchmark | [-] | 11.1 | ||||||||||
| I123pd | [-] | 97.7 | 6.30 | 11.1 | 91.8 | 2.11 | 0.437 | 0.533 | 0.485 | |||
| post5.4 | [-] | 97.5 | 6.29 | 11.1 | 91.7 | 2.07 | 0.437 | 0.532 | 0.485 |
Download Data |
Period Mean (original grids) [Pg] |
Model Period Mean (intersection) [Pg] |
Benchmark Period Mean (intersection) [Pg] |
Model Period Mean (complement) [Pg] |
Benchmark Period Mean (complement) [Pg] |
Bias [kg m-2] |
Bias Score [1] |
Spatial Distribution Score [1] |
Overall Score [1] |
|||
|---|---|---|---|---|---|---|---|---|---|---|---|---|
| Benchmark | [-] | 55.7 | ||||||||||
| I123pd | [-] | 36.8 | 33.8 | 55.5 | 2.73 | 0.256 | -0.0935 | 0.684 | 0.699 | 0.691 | ||
| post5.4 | [-] | 36.3 | 33.4 | 55.5 | 2.69 | 0.256 | -0.271 | 0.688 | 0.698 | 0.693 |
Download Data |
Period Mean (original grids) [Pg] |
Model Period Mean (intersection) [Pg] |
Benchmark Period Mean (intersection) [Pg] |
Model Period Mean (complement) [Pg] |
Benchmark Period Mean (complement) [Pg] |
Bias [kg m-2] |
Bias Score [1] |
Spatial Distribution Score [1] |
Overall Score [1] |
|||
|---|---|---|---|---|---|---|---|---|---|---|---|---|
| Benchmark | [-] | 65.6 | ||||||||||
| I123pd | [-] | 184. | 63.7 | 65.6 | 116. | 0.0110 | 0.294 | 0.602 | 0.904 | 0.753 | ||
| post5.4 | [-] | 183. | 63.5 | 65.6 | 115. | 0.0110 | 0.250 | 0.603 | 0.904 | 0.753 |
Download Data |
Period Mean (original grids) [Pg] |
Model Period Mean (intersection) [Pg] |
Benchmark Period Mean (intersection) [Pg] |
Model Period Mean (complement) [Pg] |
Benchmark Period Mean (complement) [Pg] |
Bias [kg m-2] |
Bias Score [1] |
Spatial Distribution Score [1] |
Overall Score [1] |
|||
|---|---|---|---|---|---|---|---|---|---|---|---|---|
| Benchmark | [-] | 143. | ||||||||||
| I123pd | [-] | 227. | 206. | 143. | 26.0 | 0.0553 | 4.20 | 0.558 | 0.121 | 0.340 | ||
| post5.4 | [-] | 227. | 206. | 143. | 26.0 | 0.0553 | 4.18 | 0.559 | 0.121 | 0.340 |
Download Data |
Period Mean (original grids) [Pg] |
Model Period Mean (intersection) [Pg] |
Benchmark Period Mean (intersection) [Pg] |
Model Period Mean (complement) [Pg] |
Benchmark Period Mean (complement) [Pg] |
Bias [kg m-2] |
Bias Score [1] |
Spatial Distribution Score [1] |
Overall Score [1] |
|||
|---|---|---|---|---|---|---|---|---|---|---|---|---|
| Benchmark | [-] | 58.4 | ||||||||||
| I123pd | [-] | 70.3 | 66.3 | 58.3 | 1.72 | 0.112 | 2.83 | 0.615 | 0.423 | 0.519 | ||
| post5.4 | [-] | 69.9 | 65.9 | 58.3 | 1.71 | 0.112 | 2.76 | 0.617 | 0.425 | 0.521 |
Download Data |
Period Mean (original grids) [Pg] |
Model Period Mean (intersection) [Pg] |
Benchmark Period Mean (intersection) [Pg] |
Model Period Mean (complement) [Pg] |
Benchmark Period Mean (complement) [Pg] |
Bias [kg m-2] |
Bias Score [1] |
Spatial Distribution Score [1] |
Overall Score [1] |
|||
|---|---|---|---|---|---|---|---|---|---|---|---|---|
| Benchmark | [-] | 7.78 | ||||||||||
| I123pd | [-] | 168. | 11.3 | 7.77 | 158. | 0.00477 | 22.2 | 0.324 | 0.252 | 0.288 | ||
| post5.4 | [-] | 167. | 11.3 | 7.77 | 157. | 0.00477 | 22.1 | 0.325 | 0.253 | 0.289 |
Download Data |
Period Mean (original grids) [Pg] |
Model Period Mean (intersection) [Pg] |
Benchmark Period Mean (intersection) [Pg] |
Model Period Mean (complement) [Pg] |
Benchmark Period Mean (complement) [Pg] |
Bias [kg m-2] |
Bias Score [1] |
Spatial Distribution Score [1] |
Overall Score [1] |
|||
|---|---|---|---|---|---|---|---|---|---|---|---|---|
| Benchmark | [-] | 58.9 | ||||||||||
| I123pd | [-] | 50.9 | 49.1 | 58.6 | 1.59 | 0.283 | -0.0726 | 0.689 | 0.582 | 0.635 | ||
| post5.4 | [-] | 50.7 | 48.9 | 58.6 | 1.59 | 0.283 | -0.101 | 0.689 | 0.585 | 0.637 |
Download Data |
Period Mean (original grids) [Pg] |
Model Period Mean (intersection) [Pg] |
Benchmark Period Mean (intersection) [Pg] |
Model Period Mean (complement) [Pg] |
Benchmark Period Mean (complement) [Pg] |
Bias [kg m-2] |
Bias Score [1] |
Spatial Distribution Score [1] |
Overall Score [1] |
|||
|---|---|---|---|---|---|---|---|---|---|---|---|---|
| Benchmark | [-] | 61.8 | ||||||||||
| I123pd | [-] | 56.7 | 49.9 | 61.6 | 5.34 | 0.148 | 0.133 | 0.623 | 0.880 | 0.752 | ||
| post5.4 | [-] | 56.8 | 49.9 | 61.6 | 5.32 | 0.148 | 0.140 | 0.623 | 0.880 | 0.751 |
Download Data |
Period Mean (original grids) [Pg] |
Model Period Mean (intersection) [Pg] |
Benchmark Period Mean (intersection) [Pg] |
Model Period Mean (complement) [Pg] |
Benchmark Period Mean (complement) [Pg] |
Bias [kg m-2] |
Bias Score [1] |
Spatial Distribution Score [1] |
Overall Score [1] |
|||
|---|---|---|---|---|---|---|---|---|---|---|---|---|
| Benchmark | [-] | 1.05e+03 | ||||||||||
| I123pd | [-] | 1.66e+03 | 1.06e+03 | 1.05e+03 | 596. | 1.60 | 1.31 | 0.568 | 0.588 | 0.578 | ||
| post5.4 | [-] | 1.65e+03 | 1.05e+03 | 1.05e+03 | 595. | 1.60 | 1.26 | 0.569 | 0.589 | 0.579 |
Download Data |
Period Mean (original grids) [Pg] |
Model Period Mean (intersection) [Pg] |
Benchmark Period Mean (intersection) [Pg] |
Model Period Mean (complement) [Pg] |
Benchmark Period Mean (complement) [Pg] |
Bias [kg m-2] |
Bias Score [1] |
Spatial Distribution Score [1] |
Overall Score [1] |
|||
|---|---|---|---|---|---|---|---|---|---|---|---|---|
| Benchmark | [-] | 64.3 | ||||||||||
| I123pd | [-] | 34.5 | 33.9 | 64.3 | 0.959 | 0.0301 | -1.47 | 0.444 | 0.346 | 0.395 | ||
| post5.4 | [-] | 34.4 | 33.8 | 64.3 | 0.956 | 0.0301 | -1.47 | 0.444 | 0.346 | 0.395 |
Download Data |
Period Mean (original grids) [Pg] |
Model Period Mean (intersection) [Pg] |
Benchmark Period Mean (intersection) [Pg] |
Model Period Mean (complement) [Pg] |
Benchmark Period Mean (complement) [Pg] |
Bias [kg m-2] |
Bias Score [1] |
Spatial Distribution Score [1] |
Overall Score [1] |
|||
|---|---|---|---|---|---|---|---|---|---|---|---|---|
| Benchmark | [-] | 13.3 | ||||||||||
| I123pd | [-] | 158. | 8.06 | 13.3 | 148. | 0.0146 | 1.92 | 0.423 | 0.631 | 0.527 | ||
| post5.4 | [-] | 158. | 8.04 | 13.3 | 147. | 0.0146 | 1.89 | 0.423 | 0.632 | 0.528 |
Download Data |
Period Mean (original grids) [Pg] |
Model Period Mean (intersection) [Pg] |
Benchmark Period Mean (intersection) [Pg] |
Model Period Mean (complement) [Pg] |
Benchmark Period Mean (complement) [Pg] |
Bias [kg m-2] |
Bias Score [1] |
Spatial Distribution Score [1] |
Overall Score [1] |
|||
|---|---|---|---|---|---|---|---|---|---|---|---|---|
| Benchmark | [-] | 42.5 | ||||||||||
| I123pd | [-] | 31.7 | 28.5 | 42.1 | 2.16 | 0.391 | 0.505 | 0.532 | 0.837 | 0.685 | ||
| post5.4 | [-] | 31.5 | 28.4 | 42.1 | 2.15 | 0.391 | 0.431 | 0.533 | 0.839 | 0.686 |
Download Data |
Period Mean (original grids) [Pg] |
Model Period Mean (intersection) [Pg] |
Benchmark Period Mean (intersection) [Pg] |
Model Period Mean (complement) [Pg] |
Benchmark Period Mean (complement) [Pg] |
Bias [kg m-2] |
Bias Score [1] |
Spatial Distribution Score [1] |
Overall Score [1] |
|||
|---|---|---|---|---|---|---|---|---|---|---|---|---|
| Benchmark | [-] | 45.3 | ||||||||||
| I123pd | [-] | 51.6 | 49.9 | 45.3 | 0.726 | 0.00775 | 1.72 | 0.650 | 0.815 | 0.733 | ||
| post5.4 | [-] | 50.9 | 49.2 | 45.3 | 0.719 | 0.00775 | 1.55 | 0.658 | 0.811 | 0.734 |
Download Data |
Period Mean (original grids) [Pg] |
Model Period Mean (intersection) [Pg] |
Benchmark Period Mean (intersection) [Pg] |
Model Period Mean (complement) [Pg] |
Benchmark Period Mean (complement) [Pg] |
Bias [kg m-2] |
Bias Score [1] |
Spatial Distribution Score [1] |
Overall Score [1] |
|||
|---|---|---|---|---|---|---|---|---|---|---|---|---|
| Benchmark | [-] | 51.3 | ||||||||||
| I123pd | [-] | 76.3 | 42.5 | 51.3 | 36.2 | -1.77 | 0.660 | 0.885 | 0.772 | |||
| post5.4 | [-] | 75.9 | 42.2 | 51.3 | 36.0 | -1.86 | 0.660 | 0.884 | 0.772 |
Download Data |
Period Mean (original grids) [Pg] |
Model Period Mean (intersection) [Pg] |
Benchmark Period Mean (intersection) [Pg] |
Model Period Mean (complement) [Pg] |
Benchmark Period Mean (complement) [Pg] |
Bias [kg m-2] |
Bias Score [1] |
Spatial Distribution Score [1] |
Overall Score [1] |
|||
|---|---|---|---|---|---|---|---|---|---|---|---|---|
| Benchmark | [-] | 34.3 | ||||||||||
| I123pd | [-] | 25.4 | 25.5 | 34.2 | 0.918 | 0.00992 | -1.54 | 0.609 | 0.540 | 0.575 | ||
| post5.4 | [-] | 25.2 | 25.3 | 34.2 | 0.915 | 0.00992 | -1.59 | 0.609 | 0.540 | 0.575 |
Download Data |
Period Mean (original grids) [Pg] |
Model Period Mean (intersection) [Pg] |
Benchmark Period Mean (intersection) [Pg] |
Model Period Mean (complement) [Pg] |
Benchmark Period Mean (complement) [Pg] |
Bias [kg m-2] |
Bias Score [1] |
Spatial Distribution Score [1] |
Overall Score [1] |
|||
|---|---|---|---|---|---|---|---|---|---|---|---|---|
| Benchmark | [-] | 101. | ||||||||||
| I123pd | [-] | 125. | 124. | 101. | 0.941 | 0.0749 | 3.43 | 0.603 | 0.680 | 0.642 | ||
| post5.4 | [-] | 124. | 123. | 101. | 0.935 | 0.0749 | 3.28 | 0.610 | 0.683 | 0.646 |
Download Data |
Period Mean (original grids) [Pg] |
Model Period Mean (intersection) [Pg] |
Benchmark Period Mean (intersection) [Pg] |
Model Period Mean (complement) [Pg] |
Benchmark Period Mean (complement) [Pg] |
Bias [kg m-2] |
Bias Score [1] |
Spatial Distribution Score [1] |
Overall Score [1] |
|||
|---|---|---|---|---|---|---|---|---|---|---|---|---|
| Benchmark | [-] | 60.7 | ||||||||||
| I123pd | [-] | 87.4 | 87.9 | 60.7 | 0.822 | 0.0488 | 4.58 | 0.541 | 0.791 | 0.666 | ||
| post5.4 | [-] | 87.0 | 87.5 | 60.7 | 0.819 | 0.0488 | 4.52 | 0.542 | 0.792 | 0.667 |
Download Data |
Period Mean (original grids) [Pg] |
Model Period Mean (intersection) [Pg] |
Benchmark Period Mean (intersection) [Pg] |
Model Period Mean (complement) [Pg] |
Benchmark Period Mean (complement) [Pg] |
Bias [kg m-2] |
Bias Score [1] |
Spatial Distribution Score [1] |
Overall Score [1] |
|||
|---|---|---|---|---|---|---|---|---|---|---|---|---|
| Benchmark | [-] | 29.6 | ||||||||||
| I123pd | [-] | 33.5 | 31.7 | 29.6 | 0.771 | 0.0296 | 2.25 | 0.440 | 0.863 | 0.652 | ||
| post5.4 | [-] | 33.4 | 31.6 | 29.6 | 0.768 | 0.0296 | 2.21 | 0.440 | 0.862 | 0.651 |
Temporally integrated period mean