Mean State
Download Data |
Period Mean (original grids) [Pg] |
Model Period Mean (intersection) [Pg] |
Benchmark Period Mean (intersection) [Pg] |
Model Period Mean (complement) [Pg] |
Benchmark Period Mean (complement) [Pg] |
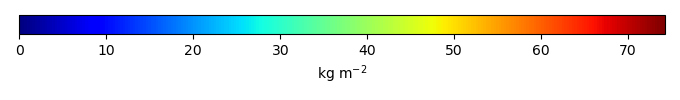
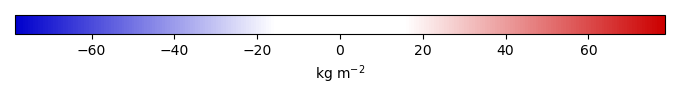
Bias [kg m-2] |
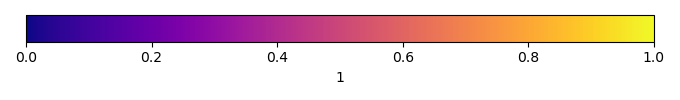
Bias Score [1] |
Spatial Distribution Score [1] |
Overall Score [1] |
|||
|---|---|---|---|---|---|---|---|---|---|---|---|---|
| Benchmark | [-] | 76.5 | ||||||||||
| I123pd | [-] | 97.7 | 90.3 | 76.4 | 7.74 | 0.0272 | 6.67 | 0.520 | 0.528 | 0.524 | ||
| post5.4 | [-] | 97.5 | 90.2 | 76.4 | 7.73 | 0.0272 | 6.63 | 0.520 | 0.529 | 0.524 |
Download Data |
Period Mean (original grids) [Pg] |
Model Period Mean (intersection) [Pg] |
Benchmark Period Mean (intersection) [Pg] |
Model Period Mean (complement) [Pg] |
Benchmark Period Mean (complement) [Pg] |
Bias [kg m-2] |
Bias Score [1] |
Spatial Distribution Score [1] |
Overall Score [1] |
|||
|---|---|---|---|---|---|---|---|---|---|---|---|---|
| Benchmark | [-] | 113. | ||||||||||
| I123pd | [-] | 184. | 115. | 113. | 64.2 | 0.562 | 0.626 | 0.859 | 0.742 | |||
| post5.4 | [-] | 183. | 115. | 113. | 64.0 | 0.479 | 0.626 | 0.859 | 0.742 |
Download Data |
Period Mean (original grids) [Pg] |
Model Period Mean (intersection) [Pg] |
Benchmark Period Mean (intersection) [Pg] |
Model Period Mean (complement) [Pg] |
Benchmark Period Mean (complement) [Pg] |
Bias [kg m-2] |
Bias Score [1] |
Spatial Distribution Score [1] |
Overall Score [1] |
|||
|---|---|---|---|---|---|---|---|---|---|---|---|---|
| Benchmark | [-] | 12.2 | ||||||||||
| I123pd | [-] | 227. | 24.6 | 12.2 | 207. | 12.2 | 0.500 | 0.212 | 0.356 | |||
| post5.4 | [-] | 227. | 24.6 | 12.2 | 207. | 12.2 | 0.499 | 0.212 | 0.355 |
Download Data |
Period Mean (original grids) [Pg] |
Model Period Mean (intersection) [Pg] |
Benchmark Period Mean (intersection) [Pg] |
Model Period Mean (complement) [Pg] |
Benchmark Period Mean (complement) [Pg] |
Bias [kg m-2] |
Bias Score [1] |
Spatial Distribution Score [1] |
Overall Score [1] |
|||
|---|---|---|---|---|---|---|---|---|---|---|---|---|
| Benchmark | [-] | 97.3 | ||||||||||
| I123pd | [-] | 168. | 156. | 97.3 | 12.9 | 20.2 | 0.481 | 0.466 | 0.473 | |||
| post5.4 | [-] | 167. | 156. | 97.3 | 12.9 | 20.1 | 0.481 | 0.466 | 0.474 |
Download Data |
Period Mean (original grids) [Pg] |
Model Period Mean (intersection) [Pg] |
Benchmark Period Mean (intersection) [Pg] |
Model Period Mean (complement) [Pg] |
Benchmark Period Mean (complement) [Pg] |
Bias [kg m-2] |
Bias Score [1] |
Spatial Distribution Score [1] |
Overall Score [1] |
|||
|---|---|---|---|---|---|---|---|---|---|---|---|---|
| Benchmark | [-] | 5.12 | ||||||||||
| I123pd | [-] | 56.7 | 4.02 | 5.12 | 51.2 | -3.95 | 0.611 | 0.792 | 0.702 | |||
| post5.4 | [-] | 56.8 | 4.00 | 5.12 | 51.3 | -4.03 | 0.610 | 0.788 | 0.699 |
Download Data |
Period Mean (original grids) [Pg] |
Model Period Mean (intersection) [Pg] |
Benchmark Period Mean (intersection) [Pg] |
Model Period Mean (complement) [Pg] |
Benchmark Period Mean (complement) [Pg] |
Bias [kg m-2] |
Bias Score [1] |
Spatial Distribution Score [1] |
Overall Score [1] |
|||
|---|---|---|---|---|---|---|---|---|---|---|---|---|
| Benchmark | [-] | 473. | ||||||||||
| I123pd | [-] | 1.66e+03 | 573. | 473. | 1.08e+03 | 0.0272 | 5.42 | 0.541 | 0.661 | 0.601 | ||
| post5.4 | [-] | 1.65e+03 | 572. | 473. | 1.07e+03 | 0.0272 | 5.37 | 0.541 | 0.661 | 0.601 |
Download Data |
Period Mean (original grids) [Pg] |
Model Period Mean (intersection) [Pg] |
Benchmark Period Mean (intersection) [Pg] |
Model Period Mean (complement) [Pg] |
Benchmark Period Mean (complement) [Pg] |
Bias [kg m-2] |
Bias Score [1] |
Spatial Distribution Score [1] |
Overall Score [1] |
|||
|---|---|---|---|---|---|---|---|---|---|---|---|---|
| Benchmark | [-] | 116. | ||||||||||
| I123pd | [-] | 158. | 146. | 116. | 9.54 | 6.69 | 0.416 | 0.614 | 0.515 | |||
| post5.4 | [-] | 158. | 146. | 116. | 9.52 | 6.64 | 0.416 | 0.615 | 0.515 |
Download Data |
Period Mean (original grids) [Pg] |
Model Period Mean (intersection) [Pg] |
Benchmark Period Mean (intersection) [Pg] |
Model Period Mean (complement) [Pg] |
Benchmark Period Mean (complement) [Pg] |
Bias [kg m-2] |
Bias Score [1] |
Spatial Distribution Score [1] |
Overall Score [1] |
|||
|---|---|---|---|---|---|---|---|---|---|---|---|---|
| Benchmark | [-] | 0.0131 | ||||||||||
| I123pd | [-] | 51.6 | 0.0258 | 0.0131 | 50.6 | 6.00 | 0.362 | 9.65e-23 | 0.181 | |||
| post5.4 | [-] | 50.9 | 0.0258 | 0.0131 | 49.9 | 5.99 | 0.363 | 8.27e-23 | 0.181 |
Download Data |
Period Mean (original grids) [Pg] |
Model Period Mean (intersection) [Pg] |
Benchmark Period Mean (intersection) [Pg] |
Model Period Mean (complement) [Pg] |
Benchmark Period Mean (complement) [Pg] |
Bias [kg m-2] |
Bias Score [1] |
Spatial Distribution Score [1] |
Overall Score [1] |
|||
|---|---|---|---|---|---|---|---|---|---|---|---|---|
| Benchmark | [-] | 46.1 | ||||||||||
| I123pd | [-] | 76.3 | 35.8 | 46.1 | 42.8 | -4.98 | 0.558 | 0.764 | 0.661 | |||
| post5.4 | [-] | 75.9 | 35.7 | 46.1 | 42.6 | -5.03 | 0.558 | 0.764 | 0.661 |
Download Data |
Period Mean (original grids) [Pg] |
Model Period Mean (intersection) [Pg] |
Benchmark Period Mean (intersection) [Pg] |
Model Period Mean (complement) [Pg] |
Benchmark Period Mean (complement) [Pg] |
Bias [kg m-2] |
Bias Score [1] |
Spatial Distribution Score [1] |
Overall Score [1] |
|||
|---|---|---|---|---|---|---|---|---|---|---|---|---|
| Benchmark | [-] | 0.232 | ||||||||||
| I123pd | [-] | 25.4 | 0.573 | 0.232 | 25.8 | 6.05 | 0.286 | 0.756 | 0.521 | |||
| post5.4 | [-] | 25.2 | 0.571 | 0.232 | 25.7 | 6.01 | 0.289 | 0.754 | 0.522 |
Temporally integrated period mean