Mean State
Download Data |
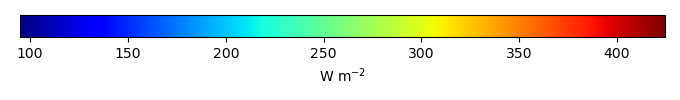
Period Mean (original grids) [W m-2] |
Model Period Mean (intersection) [W m-2] |
Benchmark Period Mean (intersection) [W m-2] |
Model Period Mean (complement) [W m-2] |
Benchmark Period Mean (complement) [W m-2] |
Bias [W m-2] |
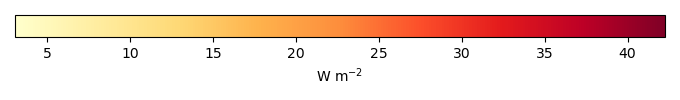
RMSE [W m-2] |
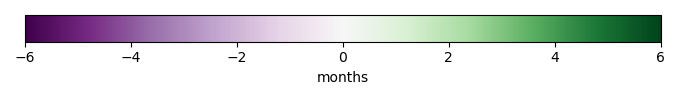
Phase Shift [months] |
Bias Score [1] |
RMSE Score [1] |
Seasonal Cycle Score [1] |
Spatial Distribution Score [1] |
Overall Score [1] |
|||
|---|---|---|---|---|---|---|---|---|---|---|---|---|---|---|---|---|
| Benchmark | [-] | 402. | ||||||||||||||
| I123pd | [-] | 391. | 391. | 402. | 419. | -10.1 | 11.9 | 1.67 | 0.344 | 0.537 | 0.754 | 0.988 | 0.632 | |||
| post5.4 | [-] | 391. | 391. | 402. | 419. | -10.1 | 11.9 | 1.67 | 0.344 | 0.537 | 0.754 | 0.988 | 0.632 |
Download Data |
Period Mean (original grids) [W m-2] |
Model Period Mean (intersection) [W m-2] |
Benchmark Period Mean (intersection) [W m-2] |
Model Period Mean (complement) [W m-2] |
Benchmark Period Mean (complement) [W m-2] |
Bias [W m-2] |
RMSE [W m-2] |
Phase Shift [months] |
Bias Score [1] |
RMSE Score [1] |
Seasonal Cycle Score [1] |
Spatial Distribution Score [1] |
Overall Score [1] |
|||
|---|---|---|---|---|---|---|---|---|---|---|---|---|---|---|---|---|
| Benchmark | [-] | 389. | ||||||||||||||
| I123pd | [-] | 378. | 378. | 389. | 417. | -10.5 | 14.4 | 0.573 | 0.663 | 0.745 | 0.946 | 0.997 | 0.819 | |||
| post5.4 | [-] | 378. | 378. | 389. | 417. | -10.5 | 14.4 | 0.573 | 0.663 | 0.745 | 0.946 | 0.997 | 0.819 |
Download Data |
Period Mean (original grids) [W m-2] |
Model Period Mean (intersection) [W m-2] |
Benchmark Period Mean (intersection) [W m-2] |
Model Period Mean (complement) [W m-2] |
Benchmark Period Mean (complement) [W m-2] |
Bias [W m-2] |
RMSE [W m-2] |
Phase Shift [months] |
Bias Score [1] |
RMSE Score [1] |
Seasonal Cycle Score [1] |
Spatial Distribution Score [1] |
Overall Score [1] |
|||
|---|---|---|---|---|---|---|---|---|---|---|---|---|---|---|---|---|
| Benchmark | [-] | 365. | ||||||||||||||
| I123pd | [-] | 355. | 355. | 365. | 385. | -7.07 | 12.0 | 1.06 | 0.659 | 0.768 | 0.864 | 0.981 | 0.808 | |||
| post5.4 | [-] | 355. | 355. | 365. | 385. | -7.07 | 12.0 | 1.06 | 0.659 | 0.768 | 0.864 | 0.981 | 0.808 |
Download Data |
Period Mean (original grids) [W m-2] |
Model Period Mean (intersection) [W m-2] |
Benchmark Period Mean (intersection) [W m-2] |
Model Period Mean (complement) [W m-2] |
Benchmark Period Mean (complement) [W m-2] |
Bias [W m-2] |
RMSE [W m-2] |
Phase Shift [months] |
Bias Score [1] |
RMSE Score [1] |
Seasonal Cycle Score [1] |
Spatial Distribution Score [1] |
Overall Score [1] |
|||
|---|---|---|---|---|---|---|---|---|---|---|---|---|---|---|---|---|
| Benchmark | [-] | 241. | ||||||||||||||
| I123pd | [-] | 229. | 229. | 241. | 257. | -8.82 | 11.7 | 0.114 | 0.849 | 0.886 | 0.992 | 0.994 | 0.921 | |||
| post5.4 | [-] | 229. | 229. | 241. | 257. | -8.82 | 11.7 | 0.114 | 0.849 | 0.886 | 0.992 | 0.994 | 0.921 |
Download Data |
Period Mean (original grids) [W m-2] |
Model Period Mean (intersection) [W m-2] |
Benchmark Period Mean (intersection) [W m-2] |
Model Period Mean (complement) [W m-2] |
Benchmark Period Mean (complement) [W m-2] |
Bias [W m-2] |
RMSE [W m-2] |
Phase Shift [months] |
Bias Score [1] |
RMSE Score [1] |
Seasonal Cycle Score [1] |
Spatial Distribution Score [1] |
Overall Score [1] |
|||
|---|---|---|---|---|---|---|---|---|---|---|---|---|---|---|---|---|
| Benchmark | [-] | 416. | ||||||||||||||
| I123pd | [-] | 408. | 408. | 415. | 423. | -6.16 | 9.34 | 1.31 | 0.271 | 0.657 | 0.792 | 0.939 | 0.663 | |||
| post5.4 | [-] | 408. | 408. | 415. | 423. | -6.16 | 9.34 | 1.31 | 0.271 | 0.657 | 0.792 | 0.939 | 0.663 |
Download Data |
Period Mean (original grids) [W m-2] |
Model Period Mean (intersection) [W m-2] |
Benchmark Period Mean (intersection) [W m-2] |
Model Period Mean (complement) [W m-2] |
Benchmark Period Mean (complement) [W m-2] |
Bias [W m-2] |
RMSE [W m-2] |
Phase Shift [months] |
Bias Score [1] |
RMSE Score [1] |
Seasonal Cycle Score [1] |
Spatial Distribution Score [1] |
Overall Score [1] |
|||
|---|---|---|---|---|---|---|---|---|---|---|---|---|---|---|---|---|
| Benchmark | [-] | 264. | ||||||||||||||
| I123pd | [-] | 257. | 257. | 264. | 285. | -6.48 | 10.2 | 0.0189 | 0.898 | 0.893 | 0.999 | 0.980 | 0.933 | |||
| post5.4 | [-] | 257. | 257. | 264. | 285. | -6.48 | 10.2 | 0.0189 | 0.898 | 0.893 | 0.999 | 0.980 | 0.933 |
Download Data |
Period Mean (original grids) [W m-2] |
Model Period Mean (intersection) [W m-2] |
Benchmark Period Mean (intersection) [W m-2] |
Model Period Mean (complement) [W m-2] |
Benchmark Period Mean (complement) [W m-2] |
Bias [W m-2] |
RMSE [W m-2] |
Phase Shift [months] |
Bias Score [1] |
RMSE Score [1] |
Seasonal Cycle Score [1] |
Spatial Distribution Score [1] |
Overall Score [1] |
|||
|---|---|---|---|---|---|---|---|---|---|---|---|---|---|---|---|---|
| Benchmark | [-] | 295. | ||||||||||||||
| I123pd | [-] | 282. | 282. | 295. | 368. | -9.62 | 14.5 | 0.108 | 0.795 | 0.862 | 0.992 | 0.996 | 0.902 | |||
| post5.4 | [-] | 282. | 282. | 295. | 368. | -9.62 | 14.5 | 0.108 | 0.795 | 0.862 | 0.992 | 0.996 | 0.902 |
Download Data |
Period Mean (original grids) [W m-2] |
Model Period Mean (intersection) [W m-2] |
Benchmark Period Mean (intersection) [W m-2] |
Model Period Mean (complement) [W m-2] |
Benchmark Period Mean (complement) [W m-2] |
Bias [W m-2] |
RMSE [W m-2] |
Phase Shift [months] |
Bias Score [1] |
RMSE Score [1] |
Seasonal Cycle Score [1] |
Spatial Distribution Score [1] |
Overall Score [1] |
|||
|---|---|---|---|---|---|---|---|---|---|---|---|---|---|---|---|---|
| Benchmark | [-] | 386. | ||||||||||||||
| I123pd | [-] | 371. | 372. | 386. | 416. | -7.35 | 13.1 | 0.384 | 0.712 | 0.810 | 0.969 | 0.988 | 0.858 | |||
| post5.4 | [-] | 371. | 372. | 386. | 416. | -7.35 | 13.1 | 0.384 | 0.712 | 0.810 | 0.969 | 0.988 | 0.858 |
Download Data |
Period Mean (original grids) [W m-2] |
Model Period Mean (intersection) [W m-2] |
Benchmark Period Mean (intersection) [W m-2] |
Model Period Mean (complement) [W m-2] |
Benchmark Period Mean (complement) [W m-2] |
Bias [W m-2] |
RMSE [W m-2] |
Phase Shift [months] |
Bias Score [1] |
RMSE Score [1] |
Seasonal Cycle Score [1] |
Spatial Distribution Score [1] |
Overall Score [1] |
|||
|---|---|---|---|---|---|---|---|---|---|---|---|---|---|---|---|---|
| Benchmark | [-] | 244. | ||||||||||||||
| I123pd | [-] | 236. | 236. | 244. | 265. | -6.76 | 9.59 | 0.0787 | 0.882 | 0.890 | 0.995 | 0.993 | 0.930 | |||
| post5.4 | [-] | 236. | 236. | 244. | 265. | -6.76 | 9.59 | 0.0787 | 0.882 | 0.890 | 0.995 | 0.993 | 0.930 |
Download Data |
Period Mean (original grids) [W m-2] |
Model Period Mean (intersection) [W m-2] |
Benchmark Period Mean (intersection) [W m-2] |
Model Period Mean (complement) [W m-2] |
Benchmark Period Mean (complement) [W m-2] |
Bias [W m-2] |
RMSE [W m-2] |
Phase Shift [months] |
Bias Score [1] |
RMSE Score [1] |
Seasonal Cycle Score [1] |
Spatial Distribution Score [1] |
Overall Score [1] |
|||
|---|---|---|---|---|---|---|---|---|---|---|---|---|---|---|---|---|
| Benchmark | [-] | 352. | ||||||||||||||
| I123pd | [-] | 345. | 345. | 351. | 376. | -5.05 | 8.43 | 0.179 | 0.823 | 0.839 | 0.988 | 0.999 | 0.897 | |||
| post5.4 | [-] | 345. | 345. | 351. | 376. | -5.05 | 8.43 | 0.179 | 0.823 | 0.839 | 0.988 | 0.999 | 0.897 |
Download Data |
Period Mean (original grids) [W m-2] |
Model Period Mean (intersection) [W m-2] |
Benchmark Period Mean (intersection) [W m-2] |
Model Period Mean (complement) [W m-2] |
Benchmark Period Mean (complement) [W m-2] |
Bias [W m-2] |
RMSE [W m-2] |
Phase Shift [months] |
Bias Score [1] |
RMSE Score [1] |
Seasonal Cycle Score [1] |
Spatial Distribution Score [1] |
Overall Score [1] |
|||
|---|---|---|---|---|---|---|---|---|---|---|---|---|---|---|---|---|
| Benchmark | [-] | 312. | ||||||||||||||
| I123pd | [-] | 302. | 302. | 312. | 331. | -7.71 | 10.6 | 0.222 | 0.756 | 0.847 | 0.985 | 0.987 | 0.884 | |||
| post5.4 | [-] | 302. | 302. | 312. | 331. | -7.71 | 10.6 | 0.222 | 0.756 | 0.847 | 0.985 | 0.987 | 0.884 |
Download Data |
Period Mean (original grids) [W m-2] |
Model Period Mean (intersection) [W m-2] |
Benchmark Period Mean (intersection) [W m-2] |
Model Period Mean (complement) [W m-2] |
Benchmark Period Mean (complement) [W m-2] |
Bias [W m-2] |
RMSE [W m-2] |
Phase Shift [months] |
Bias Score [1] |
RMSE Score [1] |
Seasonal Cycle Score [1] |
Spatial Distribution Score [1] |
Overall Score [1] |
|||
|---|---|---|---|---|---|---|---|---|---|---|---|---|---|---|---|---|
| Benchmark | [-] | 316. | ||||||||||||||
| I123pd | [-] | 304. | 304. | 315. | 376. | -7.46 | 12.0 | 0.529 | 0.712 | 0.787 | 0.931 | 0.999 | 0.843 | |||
| post5.4 | [-] | 304. | 304. | 315. | 376. | -7.46 | 12.0 | 0.529 | 0.712 | 0.787 | 0.931 | 0.999 | 0.843 |
Download Data |
Period Mean (original grids) [W m-2] |
Model Period Mean (intersection) [W m-2] |
Benchmark Period Mean (intersection) [W m-2] |
Model Period Mean (complement) [W m-2] |
Benchmark Period Mean (complement) [W m-2] |
Bias [W m-2] |
RMSE [W m-2] |
Phase Shift [months] |
Bias Score [1] |
RMSE Score [1] |
Seasonal Cycle Score [1] |
Spatial Distribution Score [1] |
Overall Score [1] |
|||
|---|---|---|---|---|---|---|---|---|---|---|---|---|---|---|---|---|
| Benchmark | [-] | 344. | ||||||||||||||
| I123pd | [-] | 337. | 337. | 344. | 373. | -5.62 | 11.9 | 0.228 | 0.808 | 0.811 | 0.982 | 0.998 | 0.882 | |||
| post5.4 | [-] | 337. | 337. | 344. | 373. | -5.62 | 11.9 | 0.228 | 0.808 | 0.811 | 0.982 | 0.998 | 0.882 |
Download Data |
Period Mean (original grids) [W m-2] |
Model Period Mean (intersection) [W m-2] |
Benchmark Period Mean (intersection) [W m-2] |
Model Period Mean (complement) [W m-2] |
Benchmark Period Mean (complement) [W m-2] |
Bias [W m-2] |
RMSE [W m-2] |
Phase Shift [months] |
Bias Score [1] |
RMSE Score [1] |
Seasonal Cycle Score [1] |
Spatial Distribution Score [1] |
Overall Score [1] |
|||
|---|---|---|---|---|---|---|---|---|---|---|---|---|---|---|---|---|
| Benchmark | [-] | 245. | ||||||||||||||
| I123pd | [-] | 237. | 236. | 245. | 254. | -9.78 | 13.4 | 0.120 | 0.819 | 0.854 | 0.992 | 0.961 | 0.896 | |||
| post5.4 | [-] | 237. | 236. | 245. | 254. | -9.78 | 13.4 | 0.120 | 0.819 | 0.854 | 0.992 | 0.961 | 0.896 |
Download Data |
Period Mean (original grids) [W m-2] |
Model Period Mean (intersection) [W m-2] |
Benchmark Period Mean (intersection) [W m-2] |
Model Period Mean (complement) [W m-2] |
Benchmark Period Mean (complement) [W m-2] |
Bias [W m-2] |
RMSE [W m-2] |
Phase Shift [months] |
Bias Score [1] |
RMSE Score [1] |
Seasonal Cycle Score [1] |
Spatial Distribution Score [1] |
Overall Score [1] |
|||
|---|---|---|---|---|---|---|---|---|---|---|---|---|---|---|---|---|
| Benchmark | [-] | 377. | ||||||||||||||
| I123pd | [-] | 358. | 358. | 376. | 407. | -7.69 | 13.7 | 0.793 | 0.568 | 0.771 | 0.900 | 0.990 | 0.800 | |||
| post5.4 | [-] | 358. | 358. | 376. | 407. | -7.69 | 13.7 | 0.793 | 0.568 | 0.771 | 0.900 | 0.990 | 0.800 |
Download Data |
Period Mean (original grids) [W m-2] |
Model Period Mean (intersection) [W m-2] |
Benchmark Period Mean (intersection) [W m-2] |
Model Period Mean (complement) [W m-2] |
Benchmark Period Mean (complement) [W m-2] |
Bias [W m-2] |
RMSE [W m-2] |
Phase Shift [months] |
Bias Score [1] |
RMSE Score [1] |
Seasonal Cycle Score [1] |
Spatial Distribution Score [1] |
Overall Score [1] |
|||
|---|---|---|---|---|---|---|---|---|---|---|---|---|---|---|---|---|
| Benchmark | [-] | 332. | ||||||||||||||
| I123pd | [-] | 323. | 323. | 332. | 383. | -5.08 | 8.57 | 0.0995 | 0.881 | 0.882 | 0.993 | 0.999 | 0.928 | |||
| post5.4 | [-] | 323. | 323. | 332. | 383. | -5.08 | 8.57 | 0.0995 | 0.881 | 0.882 | 0.993 | 0.999 | 0.928 |
Download Data |
Period Mean (original grids) [W m-2] |
Model Period Mean (intersection) [W m-2] |
Benchmark Period Mean (intersection) [W m-2] |
Model Period Mean (complement) [W m-2] |
Benchmark Period Mean (complement) [W m-2] |
Bias [W m-2] |
RMSE [W m-2] |
Phase Shift [months] |
Bias Score [1] |
RMSE Score [1] |
Seasonal Cycle Score [1] |
Spatial Distribution Score [1] |
Overall Score [1] |
|||
|---|---|---|---|---|---|---|---|---|---|---|---|---|---|---|---|---|
| Benchmark | [-] | 278. | ||||||||||||||
| I123pd | [-] | 269. | 269. | 278. | 310. | -7.10 | 9.58 | 0.0954 | 0.841 | 0.886 | 0.994 | 0.997 | 0.921 | |||
| post5.4 | [-] | 269. | 269. | 278. | 310. | -7.10 | 9.58 | 0.0954 | 0.841 | 0.886 | 0.994 | 0.997 | 0.921 |
Download Data |
Period Mean (original grids) [W m-2] |
Model Period Mean (intersection) [W m-2] |
Benchmark Period Mean (intersection) [W m-2] |
Model Period Mean (complement) [W m-2] |
Benchmark Period Mean (complement) [W m-2] |
Bias [W m-2] |
RMSE [W m-2] |
Phase Shift [months] |
Bias Score [1] |
RMSE Score [1] |
Seasonal Cycle Score [1] |
Spatial Distribution Score [1] |
Overall Score [1] |
|||
|---|---|---|---|---|---|---|---|---|---|---|---|---|---|---|---|---|
| Benchmark | [-] | 295. | ||||||||||||||
| I123pd | [-] | 287. | 289. | 295. | 327. | -5.71 | 10.9 | 0.0902 | 0.800 | 0.835 | 0.994 | 0.993 | 0.891 | |||
| post5.4 | [-] | 287. | 289. | 295. | 327. | -5.71 | 10.9 | 0.0902 | 0.800 | 0.835 | 0.994 | 0.993 | 0.891 |
Download Data |
Period Mean (original grids) [W m-2] |
Model Period Mean (intersection) [W m-2] |
Benchmark Period Mean (intersection) [W m-2] |
Model Period Mean (complement) [W m-2] |
Benchmark Period Mean (complement) [W m-2] |
Bias [W m-2] |
RMSE [W m-2] |
Phase Shift [months] |
Bias Score [1] |
RMSE Score [1] |
Seasonal Cycle Score [1] |
Spatial Distribution Score [1] |
Overall Score [1] |
|||
|---|---|---|---|---|---|---|---|---|---|---|---|---|---|---|---|---|
| Benchmark | [-] | 412. | ||||||||||||||
| I123pd | [-] | 404. | 404. | 412. | 417. | -7.09 | 9.61 | 2.65 | 0.438 | 0.591 | 0.573 | 0.982 | 0.635 | |||
| post5.4 | [-] | 404. | 404. | 412. | 417. | -7.09 | 9.61 | 2.65 | 0.438 | 0.591 | 0.573 | 0.982 | 0.635 |
Download Data |
Period Mean (original grids) [W m-2] |
Model Period Mean (intersection) [W m-2] |
Benchmark Period Mean (intersection) [W m-2] |
Model Period Mean (complement) [W m-2] |
Benchmark Period Mean (complement) [W m-2] |
Bias [W m-2] |
RMSE [W m-2] |
Phase Shift [months] |
Bias Score [1] |
RMSE Score [1] |
Seasonal Cycle Score [1] |
Spatial Distribution Score [1] |
Overall Score [1] |
|||
|---|---|---|---|---|---|---|---|---|---|---|---|---|---|---|---|---|
| Benchmark | [-] | 378. | ||||||||||||||
| I123pd | [-] | 372. | 371. | 378. | 374. | -6.51 | 9.39 | 1.29 | 0.712 | 0.801 | 0.796 | 1.00 | 0.822 | |||
| post5.4 | [-] | 372. | 371. | 378. | 374. | -6.51 | 9.39 | 1.29 | 0.712 | 0.801 | 0.796 | 1.00 | 0.822 |
Download Data |
Period Mean (original grids) [W m-2] |
Model Period Mean (intersection) [W m-2] |
Benchmark Period Mean (intersection) [W m-2] |
Model Period Mean (complement) [W m-2] |
Benchmark Period Mean (complement) [W m-2] |
Bias [W m-2] |
RMSE [W m-2] |
Phase Shift [months] |
Bias Score [1] |
RMSE Score [1] |
Seasonal Cycle Score [1] |
Spatial Distribution Score [1] |
Overall Score [1] |
|||
|---|---|---|---|---|---|---|---|---|---|---|---|---|---|---|---|---|
| Benchmark | [-] | 305. | ||||||||||||||
| I123pd | [-] | 287. | 287. | 304. | 350. | -7.84 | 17.3 | 0.499 | 0.510 | 0.686 | 0.960 | 0.998 | 0.768 | |||
| post5.4 | [-] | 287. | 287. | 304. | 350. | -7.84 | 17.3 | 0.499 | 0.510 | 0.686 | 0.960 | 0.998 | 0.768 |
Temporally integrated period mean