Mean State
Download Data |
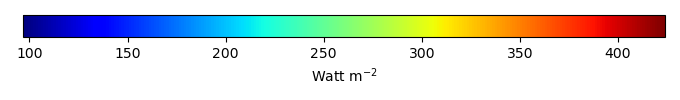
Period Mean (original grids) [Watt m-2] |
Model Period Mean (intersection) [Watt m-2] |
Benchmark Period Mean (intersection) [Watt m-2] |
Model Period Mean (complement) [Watt m-2] |
Benchmark Period Mean (complement) [Watt m-2] |
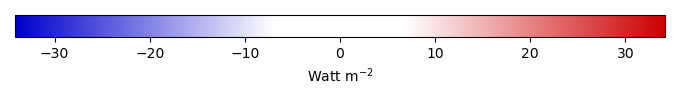
Bias [Watt m-2] |
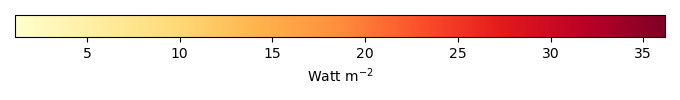
RMSE [Watt m-2] |
Phase Shift [months] |
Bias Score [1] |
RMSE Score [1] |
Seasonal Cycle Score [1] |
Spatial Distribution Score [1] |
Overall Score [1] |
|||
|---|---|---|---|---|---|---|---|---|---|---|---|---|---|---|---|---|
| Benchmark | [-] | 397. | ||||||||||||||
| I123pd | [-] | 390. | 390. | 397. | 411. | -5.12 | 8.28 | 0.555 | 0.514 | 0.644 | 0.935 | 0.887 | 0.725 | |||
| post5.4 | [-] | 390. | 390. | 397. | 411. | -5.12 | 8.28 | 0.555 | 0.514 | 0.644 | 0.935 | 0.887 | 0.725 |
Download Data |
Period Mean (original grids) [Watt m-2] |
Model Period Mean (intersection) [Watt m-2] |
Benchmark Period Mean (intersection) [Watt m-2] |
Model Period Mean (complement) [Watt m-2] |
Benchmark Period Mean (complement) [Watt m-2] |
Bias [Watt m-2] |
RMSE [Watt m-2] |
Phase Shift [months] |
Bias Score [1] |
RMSE Score [1] |
Seasonal Cycle Score [1] |
Spatial Distribution Score [1] |
Overall Score [1] |
|||
|---|---|---|---|---|---|---|---|---|---|---|---|---|---|---|---|---|
| Benchmark | [-] | 384. | ||||||||||||||
| I123pd | [-] | 376. | 376. | 384. | 410. | -7.79 | 12.1 | 1.13 | 0.716 | 0.742 | 0.866 | 0.970 | 0.807 | |||
| post5.4 | [-] | 376. | 376. | 384. | 410. | -7.79 | 12.1 | 1.13 | 0.716 | 0.742 | 0.866 | 0.970 | 0.807 |
Download Data |
Period Mean (original grids) [Watt m-2] |
Model Period Mean (intersection) [Watt m-2] |
Benchmark Period Mean (intersection) [Watt m-2] |
Model Period Mean (complement) [Watt m-2] |
Benchmark Period Mean (complement) [Watt m-2] |
Bias [Watt m-2] |
RMSE [Watt m-2] |
Phase Shift [months] |
Bias Score [1] |
RMSE Score [1] |
Seasonal Cycle Score [1] |
Spatial Distribution Score [1] |
Overall Score [1] |
|||
|---|---|---|---|---|---|---|---|---|---|---|---|---|---|---|---|---|
| Benchmark | [-] | 362. | ||||||||||||||
| I123pd | [-] | 354. | 353. | 361. | 381. | -5.05 | 10.1 | 0.876 | 0.747 | 0.765 | 0.890 | 1.00 | 0.834 | |||
| post5.4 | [-] | 354. | 353. | 361. | 381. | -5.04 | 10.1 | 0.876 | 0.747 | 0.765 | 0.890 | 1.00 | 0.834 |
Download Data |
Period Mean (original grids) [Watt m-2] |
Model Period Mean (intersection) [Watt m-2] |
Benchmark Period Mean (intersection) [Watt m-2] |
Model Period Mean (complement) [Watt m-2] |
Benchmark Period Mean (complement) [Watt m-2] |
Bias [Watt m-2] |
RMSE [Watt m-2] |
Phase Shift [months] |
Bias Score [1] |
RMSE Score [1] |
Seasonal Cycle Score [1] |
Spatial Distribution Score [1] |
Overall Score [1] |
|||
|---|---|---|---|---|---|---|---|---|---|---|---|---|---|---|---|---|
| Benchmark | [-] | 239. | ||||||||||||||
| I123pd | [-] | 225. | 225. | 239. | 248. | -11.0 | 17.2 | 0.0457 | 0.805 | 0.778 | 0.997 | 0.988 | 0.869 | |||
| post5.4 | [-] | 225. | 225. | 239. | 248. | -11.0 | 17.2 | 0.0457 | 0.805 | 0.778 | 0.997 | 0.988 | 0.869 |
Download Data |
Period Mean (original grids) [Watt m-2] |
Model Period Mean (intersection) [Watt m-2] |
Benchmark Period Mean (intersection) [Watt m-2] |
Model Period Mean (complement) [Watt m-2] |
Benchmark Period Mean (complement) [Watt m-2] |
Bias [Watt m-2] |
RMSE [Watt m-2] |
Phase Shift [months] |
Bias Score [1] |
RMSE Score [1] |
Seasonal Cycle Score [1] |
Spatial Distribution Score [1] |
Overall Score [1] |
|||
|---|---|---|---|---|---|---|---|---|---|---|---|---|---|---|---|---|
| Benchmark | [-] | 411. | ||||||||||||||
| I123pd | [-] | 406. | 406. | 411. | 416. | -3.33 | 5.98 | 1.88 | 0.481 | 0.654 | 0.704 | 0.956 | 0.690 | |||
| post5.4 | [-] | 406. | 406. | 411. | 416. | -3.33 | 5.98 | 1.88 | 0.481 | 0.654 | 0.704 | 0.956 | 0.690 |
Download Data |
Period Mean (original grids) [Watt m-2] |
Model Period Mean (intersection) [Watt m-2] |
Benchmark Period Mean (intersection) [Watt m-2] |
Model Period Mean (complement) [Watt m-2] |
Benchmark Period Mean (complement) [Watt m-2] |
Bias [Watt m-2] |
RMSE [Watt m-2] |
Phase Shift [months] |
Bias Score [1] |
RMSE Score [1] |
Seasonal Cycle Score [1] |
Spatial Distribution Score [1] |
Overall Score [1] |
|||
|---|---|---|---|---|---|---|---|---|---|---|---|---|---|---|---|---|
| Benchmark | [-] | 264. | ||||||||||||||
| I123pd | [-] | 256. | 255. | 264. | 279. | -8.50 | 12.3 | 0.0214 | 0.857 | 0.882 | 0.999 | 0.938 | 0.912 | |||
| post5.4 | [-] | 256. | 255. | 264. | 279. | -8.50 | 12.3 | 0.0214 | 0.857 | 0.882 | 0.999 | 0.938 | 0.912 |
Download Data |
Period Mean (original grids) [Watt m-2] |
Model Period Mean (intersection) [Watt m-2] |
Benchmark Period Mean (intersection) [Watt m-2] |
Model Period Mean (complement) [Watt m-2] |
Benchmark Period Mean (complement) [Watt m-2] |
Bias [Watt m-2] |
RMSE [Watt m-2] |
Phase Shift [months] |
Bias Score [1] |
RMSE Score [1] |
Seasonal Cycle Score [1] |
Spatial Distribution Score [1] |
Overall Score [1] |
|||
|---|---|---|---|---|---|---|---|---|---|---|---|---|---|---|---|---|
| Benchmark | [-] | 295. | ||||||||||||||
| I123pd | [-] | 280. | 280. | 295. | 363. | -11.1 | 15.7 | 0.0866 | 0.787 | 0.847 | 0.994 | 0.978 | 0.891 | |||
| post5.4 | [-] | 280. | 280. | 295. | 363. | -11.1 | 15.7 | 0.0866 | 0.787 | 0.847 | 0.994 | 0.978 | 0.891 |
Download Data |
Period Mean (original grids) [Watt m-2] |
Model Period Mean (intersection) [Watt m-2] |
Benchmark Period Mean (intersection) [Watt m-2] |
Model Period Mean (complement) [Watt m-2] |
Benchmark Period Mean (complement) [Watt m-2] |
Bias [Watt m-2] |
RMSE [Watt m-2] |
Phase Shift [months] |
Bias Score [1] |
RMSE Score [1] |
Seasonal Cycle Score [1] |
Spatial Distribution Score [1] |
Overall Score [1] |
|||
|---|---|---|---|---|---|---|---|---|---|---|---|---|---|---|---|---|
| Benchmark | [-] | 379. | ||||||||||||||
| I123pd | [-] | 369. | 370. | 379. | 409. | -2.11 | 10.8 | 0.302 | 0.773 | 0.797 | 0.972 | 0.973 | 0.863 | |||
| post5.4 | [-] | 369. | 370. | 379. | 409. | -2.11 | 10.8 | 0.302 | 0.773 | 0.797 | 0.972 | 0.973 | 0.863 |
Download Data |
Period Mean (original grids) [Watt m-2] |
Model Period Mean (intersection) [Watt m-2] |
Benchmark Period Mean (intersection) [Watt m-2] |
Model Period Mean (complement) [Watt m-2] |
Benchmark Period Mean (complement) [Watt m-2] |
Bias [Watt m-2] |
RMSE [Watt m-2] |
Phase Shift [months] |
Bias Score [1] |
RMSE Score [1] |
Seasonal Cycle Score [1] |
Spatial Distribution Score [1] |
Overall Score [1] |
|||
|---|---|---|---|---|---|---|---|---|---|---|---|---|---|---|---|---|
| Benchmark | [-] | 244. | ||||||||||||||
| I123pd | [-] | 231. | 232. | 244. | 253. | -11.0 | 16.1 | 0.0202 | 0.802 | 0.792 | 0.999 | 0.950 | 0.867 | |||
| post5.4 | [-] | 231. | 232. | 244. | 253. | -11.0 | 16.1 | 0.0202 | 0.802 | 0.792 | 0.999 | 0.950 | 0.867 |
Download Data |
Period Mean (original grids) [Watt m-2] |
Model Period Mean (intersection) [Watt m-2] |
Benchmark Period Mean (intersection) [Watt m-2] |
Model Period Mean (complement) [Watt m-2] |
Benchmark Period Mean (complement) [Watt m-2] |
Bias [Watt m-2] |
RMSE [Watt m-2] |
Phase Shift [months] |
Bias Score [1] |
RMSE Score [1] |
Seasonal Cycle Score [1] |
Spatial Distribution Score [1] |
Overall Score [1] |
|||
|---|---|---|---|---|---|---|---|---|---|---|---|---|---|---|---|---|
| Benchmark | [-] | 351. | ||||||||||||||
| I123pd | [-] | 344. | 344. | 351. | 371. | -6.33 | 9.31 | 0.444 | 0.789 | 0.834 | 0.967 | 0.990 | 0.883 | |||
| post5.4 | [-] | 344. | 344. | 351. | 371. | -6.33 | 9.31 | 0.446 | 0.789 | 0.834 | 0.966 | 0.990 | 0.883 |
Download Data |
Period Mean (original grids) [Watt m-2] |
Model Period Mean (intersection) [Watt m-2] |
Benchmark Period Mean (intersection) [Watt m-2] |
Model Period Mean (complement) [Watt m-2] |
Benchmark Period Mean (complement) [Watt m-2] |
Bias [Watt m-2] |
RMSE [Watt m-2] |
Phase Shift [months] |
Bias Score [1] |
RMSE Score [1] |
Seasonal Cycle Score [1] |
Spatial Distribution Score [1] |
Overall Score [1] |
|||
|---|---|---|---|---|---|---|---|---|---|---|---|---|---|---|---|---|
| Benchmark | [-] | 308. | ||||||||||||||
| I123pd | [-] | 299. | 299. | 308. | 328. | -6.68 | 10.4 | 0.191 | 0.794 | 0.820 | 0.987 | 0.987 | 0.882 | |||
| post5.4 | [-] | 299. | 299. | 308. | 328. | -6.68 | 10.4 | 0.191 | 0.794 | 0.820 | 0.987 | 0.987 | 0.882 |
Download Data |
Period Mean (original grids) [Watt m-2] |
Model Period Mean (intersection) [Watt m-2] |
Benchmark Period Mean (intersection) [Watt m-2] |
Model Period Mean (complement) [Watt m-2] |
Benchmark Period Mean (complement) [Watt m-2] |
Bias [Watt m-2] |
RMSE [Watt m-2] |
Phase Shift [months] |
Bias Score [1] |
RMSE Score [1] |
Seasonal Cycle Score [1] |
Spatial Distribution Score [1] |
Overall Score [1] |
|||
|---|---|---|---|---|---|---|---|---|---|---|---|---|---|---|---|---|
| Benchmark | [-] | 313. | ||||||||||||||
| I123pd | [-] | 302. | 302. | 313. | 371. | -6.92 | 11.2 | 0.487 | 0.752 | 0.806 | 0.936 | 1.00 | 0.860 | |||
| post5.4 | [-] | 302. | 302. | 313. | 371. | -6.92 | 11.2 | 0.487 | 0.752 | 0.806 | 0.936 | 1.00 | 0.860 |
Download Data |
Period Mean (original grids) [Watt m-2] |
Model Period Mean (intersection) [Watt m-2] |
Benchmark Period Mean (intersection) [Watt m-2] |
Model Period Mean (complement) [Watt m-2] |
Benchmark Period Mean (complement) [Watt m-2] |
Bias [Watt m-2] |
RMSE [Watt m-2] |
Phase Shift [months] |
Bias Score [1] |
RMSE Score [1] |
Seasonal Cycle Score [1] |
Spatial Distribution Score [1] |
Overall Score [1] |
|||
|---|---|---|---|---|---|---|---|---|---|---|---|---|---|---|---|---|
| Benchmark | [-] | 343. | ||||||||||||||
| I123pd | [-] | 334. | 333. | 343. | 366. | -7.55 | 12.1 | 0.317 | 0.777 | 0.796 | 0.968 | 1.00 | 0.867 | |||
| post5.4 | [-] | 334. | 333. | 343. | 366. | -7.55 | 12.1 | 0.317 | 0.777 | 0.796 | 0.968 | 1.00 | 0.867 |
Download Data |
Period Mean (original grids) [Watt m-2] |
Model Period Mean (intersection) [Watt m-2] |
Benchmark Period Mean (intersection) [Watt m-2] |
Model Period Mean (complement) [Watt m-2] |
Benchmark Period Mean (complement) [Watt m-2] |
Bias [Watt m-2] |
RMSE [Watt m-2] |
Phase Shift [months] |
Bias Score [1] |
RMSE Score [1] |
Seasonal Cycle Score [1] |
Spatial Distribution Score [1] |
Overall Score [1] |
|||
|---|---|---|---|---|---|---|---|---|---|---|---|---|---|---|---|---|
| Benchmark | [-] | 244. | ||||||||||||||
| I123pd | [-] | 234. | 234. | 244. | 248. | -11.3 | 17.1 | 0.0688 | 0.781 | 0.771 | 0.995 | 0.964 | 0.856 | |||
| post5.4 | [-] | 234. | 234. | 244. | 248. | -11.3 | 17.1 | 0.0688 | 0.781 | 0.771 | 0.995 | 0.964 | 0.856 |
Download Data |
Period Mean (original grids) [Watt m-2] |
Model Period Mean (intersection) [Watt m-2] |
Benchmark Period Mean (intersection) [Watt m-2] |
Model Period Mean (complement) [Watt m-2] |
Benchmark Period Mean (complement) [Watt m-2] |
Bias [Watt m-2] |
RMSE [Watt m-2] |
Phase Shift [months] |
Bias Score [1] |
RMSE Score [1] |
Seasonal Cycle Score [1] |
Spatial Distribution Score [1] |
Overall Score [1] |
|||
|---|---|---|---|---|---|---|---|---|---|---|---|---|---|---|---|---|
| Benchmark | [-] | 374. | ||||||||||||||
| I123pd | [-] | 356. | 356. | 372. | 402. | -5.61 | 9.89 | 0.617 | 0.680 | 0.819 | 0.919 | 0.996 | 0.846 | |||
| post5.4 | [-] | 356. | 356. | 372. | 402. | -5.61 | 9.89 | 0.617 | 0.680 | 0.819 | 0.919 | 0.996 | 0.846 |
Download Data |
Period Mean (original grids) [Watt m-2] |
Model Period Mean (intersection) [Watt m-2] |
Benchmark Period Mean (intersection) [Watt m-2] |
Model Period Mean (complement) [Watt m-2] |
Benchmark Period Mean (complement) [Watt m-2] |
Bias [Watt m-2] |
RMSE [Watt m-2] |
Phase Shift [months] |
Bias Score [1] |
RMSE Score [1] |
Seasonal Cycle Score [1] |
Spatial Distribution Score [1] |
Overall Score [1] |
|||
|---|---|---|---|---|---|---|---|---|---|---|---|---|---|---|---|---|
| Benchmark | [-] | 332. | ||||||||||||||
| I123pd | [-] | 322. | 322. | 332. | 381. | -6.95 | 7.89 | 0.0896 | 0.844 | 0.922 | 0.994 | 0.999 | 0.936 | |||
| post5.4 | [-] | 322. | 322. | 332. | 381. | -6.95 | 7.89 | 0.0896 | 0.844 | 0.922 | 0.994 | 0.999 | 0.936 |
Download Data |
Period Mean (original grids) [Watt m-2] |
Model Period Mean (intersection) [Watt m-2] |
Benchmark Period Mean (intersection) [Watt m-2] |
Model Period Mean (complement) [Watt m-2] |
Benchmark Period Mean (complement) [Watt m-2] |
Bias [Watt m-2] |
RMSE [Watt m-2] |
Phase Shift [months] |
Bias Score [1] |
RMSE Score [1] |
Seasonal Cycle Score [1] |
Spatial Distribution Score [1] |
Overall Score [1] |
|||
|---|---|---|---|---|---|---|---|---|---|---|---|---|---|---|---|---|
| Benchmark | [-] | 277. | ||||||||||||||
| I123pd | [-] | 267. | 267. | 277. | 308. | -7.31 | 9.89 | 0.0759 | 0.829 | 0.888 | 0.995 | 0.997 | 0.919 | |||
| post5.4 | [-] | 267. | 267. | 277. | 308. | -7.31 | 9.89 | 0.0759 | 0.829 | 0.888 | 0.995 | 0.997 | 0.919 |
Download Data |
Period Mean (original grids) [Watt m-2] |
Model Period Mean (intersection) [Watt m-2] |
Benchmark Period Mean (intersection) [Watt m-2] |
Model Period Mean (complement) [Watt m-2] |
Benchmark Period Mean (complement) [Watt m-2] |
Bias [Watt m-2] |
RMSE [Watt m-2] |
Phase Shift [months] |
Bias Score [1] |
RMSE Score [1] |
Seasonal Cycle Score [1] |
Spatial Distribution Score [1] |
Overall Score [1] |
|||
|---|---|---|---|---|---|---|---|---|---|---|---|---|---|---|---|---|
| Benchmark | [-] | 296. | ||||||||||||||
| I123pd | [-] | 287. | 288. | 296. | 325. | -6.92 | 10.2 | 0.0965 | 0.794 | 0.852 | 0.993 | 0.993 | 0.897 | |||
| post5.4 | [-] | 287. | 288. | 296. | 325. | -6.92 | 10.2 | 0.0965 | 0.794 | 0.852 | 0.993 | 0.993 | 0.897 |
Download Data |
Period Mean (original grids) [Watt m-2] |
Model Period Mean (intersection) [Watt m-2] |
Benchmark Period Mean (intersection) [Watt m-2] |
Model Period Mean (complement) [Watt m-2] |
Benchmark Period Mean (complement) [Watt m-2] |
Bias [Watt m-2] |
RMSE [Watt m-2] |
Phase Shift [months] |
Bias Score [1] |
RMSE Score [1] |
Seasonal Cycle Score [1] |
Spatial Distribution Score [1] |
Overall Score [1] |
|||
|---|---|---|---|---|---|---|---|---|---|---|---|---|---|---|---|---|
| Benchmark | [-] | 406. | ||||||||||||||
| I123pd | [-] | 403. | 403. | 405. | 411. | -2.26 | 5.80 | 2.48 | 0.671 | 0.684 | 0.587 | 0.959 | 0.717 | |||
| post5.4 | [-] | 403. | 403. | 405. | 411. | -2.26 | 5.80 | 2.48 | 0.671 | 0.684 | 0.587 | 0.959 | 0.717 |
Download Data |
Period Mean (original grids) [Watt m-2] |
Model Period Mean (intersection) [Watt m-2] |
Benchmark Period Mean (intersection) [Watt m-2] |
Model Period Mean (complement) [Watt m-2] |
Benchmark Period Mean (complement) [Watt m-2] |
Bias [Watt m-2] |
RMSE [Watt m-2] |
Phase Shift [months] |
Bias Score [1] |
RMSE Score [1] |
Seasonal Cycle Score [1] |
Spatial Distribution Score [1] |
Overall Score [1] |
|||
|---|---|---|---|---|---|---|---|---|---|---|---|---|---|---|---|---|
| Benchmark | [-] | 375. | ||||||||||||||
| I123pd | [-] | 371. | 370. | 376. | 372. | -5.23 | 8.23 | 1.06 | 0.762 | 0.799 | 0.837 | 0.983 | 0.836 | |||
| post5.4 | [-] | 371. | 370. | 376. | 372. | -5.23 | 8.23 | 1.06 | 0.762 | 0.799 | 0.837 | 0.983 | 0.836 |
Download Data |
Period Mean (original grids) [Watt m-2] |
Model Period Mean (intersection) [Watt m-2] |
Benchmark Period Mean (intersection) [Watt m-2] |
Model Period Mean (complement) [Watt m-2] |
Benchmark Period Mean (complement) [Watt m-2] |
Bias [Watt m-2] |
RMSE [Watt m-2] |
Phase Shift [months] |
Bias Score [1] |
RMSE Score [1] |
Seasonal Cycle Score [1] |
Spatial Distribution Score [1] |
Overall Score [1] |
|||
|---|---|---|---|---|---|---|---|---|---|---|---|---|---|---|---|---|
| Benchmark | [-] | 307. | ||||||||||||||
| I123pd | [-] | 287. | 286. | 306. | 347. | -11.3 | 19.3 | 0.553 | 0.460 | 0.727 | 0.949 | 0.954 | 0.763 | |||
| post5.4 | [-] | 287. | 286. | 306. | 347. | -11.3 | 19.3 | 0.553 | 0.460 | 0.727 | 0.949 | 0.954 | 0.763 |
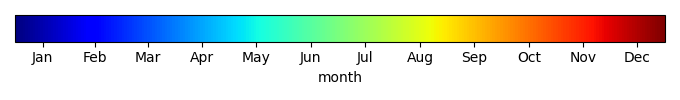
Temporally integrated period mean