Mean State
Download Data |
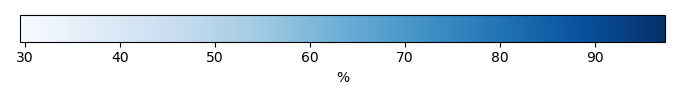
Period Mean (original grids) [%] |
Model Period Mean (intersection) [%] |
Benchmark Period Mean (intersection) [%] |
Model Period Mean (complement) [%] |
Benchmark Period Mean (complement) [%] |
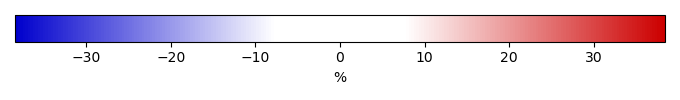
Bias [%] |
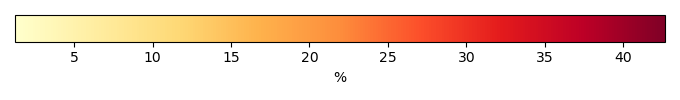
RMSE [%] |
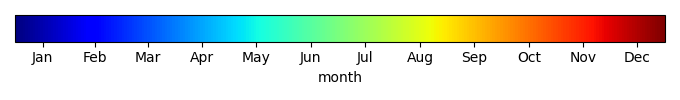
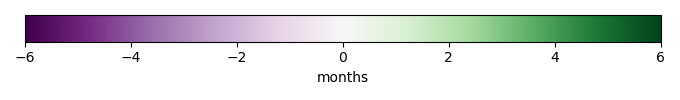
Phase Shift [months] |
Bias Score [1] |
RMSE Score [1] |
Seasonal Cycle Score [1] |
Spatial Distribution Score [1] |
Overall Score [1] |
|||
|---|---|---|---|---|---|---|---|---|---|---|---|---|---|---|---|---|
| Benchmark | [-] | 75.0 | ||||||||||||||
| I123pd | [-] | 76.2 | 76.2 | 74.6 | 94.4 | 2.07 | 6.34 | 1.40 | 0.346 | 0.611 | 0.797 | 0.988 | 0.671 | |||
| post5.4 | [-] | 76.3 | 76.3 | 74.6 | 94.4 | 2.17 | 6.41 | 1.42 | 0.342 | 0.611 | 0.796 | 0.987 | 0.669 |
Download Data |
Period Mean (original grids) [%] |
Model Period Mean (intersection) [%] |
Benchmark Period Mean (intersection) [%] |
Model Period Mean (complement) [%] |
Benchmark Period Mean (complement) [%] |
Bias [%] |
RMSE [%] |
Phase Shift [months] |
Bias Score [1] |
RMSE Score [1] |
Seasonal Cycle Score [1] |
Spatial Distribution Score [1] |
Overall Score [1] |
|||
|---|---|---|---|---|---|---|---|---|---|---|---|---|---|---|---|---|
| Benchmark | [-] | 53.3 | ||||||||||||||
| I123pd | [-] | 54.3 | 53.9 | 53.2 | 93.0 | 1.10 | 5.79 | 0.235 | 0.783 | 0.783 | 0.973 | 0.974 | 0.859 | |||
| post5.4 | [-] | 54.4 | 54.0 | 53.2 | 93.0 | 1.13 | 5.80 | 0.239 | 0.782 | 0.783 | 0.973 | 0.974 | 0.859 |
Download Data |
Period Mean (original grids) [%] |
Model Period Mean (intersection) [%] |
Benchmark Period Mean (intersection) [%] |
Model Period Mean (complement) [%] |
Benchmark Period Mean (complement) [%] |
Bias [%] |
RMSE [%] |
Phase Shift [months] |
Bias Score [1] |
RMSE Score [1] |
Seasonal Cycle Score [1] |
Spatial Distribution Score [1] |
Overall Score [1] |
|||
|---|---|---|---|---|---|---|---|---|---|---|---|---|---|---|---|---|
| Benchmark | [-] | 68.1 | ||||||||||||||
| I123pd | [-] | 63.6 | 63.6 | 67.8 | 94.3 | -2.88 | 6.49 | 1.05 | 0.545 | 0.678 | 0.860 | 0.936 | 0.739 | |||
| post5.4 | [-] | 63.8 | 63.7 | 67.8 | 94.3 | -2.77 | 6.49 | 1.08 | 0.545 | 0.677 | 0.855 | 0.937 | 0.738 |
Download Data |
Period Mean (original grids) [%] |
Model Period Mean (intersection) [%] |
Benchmark Period Mean (intersection) [%] |
Model Period Mean (complement) [%] |
Benchmark Period Mean (complement) [%] |
Bias [%] |
RMSE [%] |
Phase Shift [months] |
Bias Score [1] |
RMSE Score [1] |
Seasonal Cycle Score [1] |
Spatial Distribution Score [1] |
Overall Score [1] |
|||
|---|---|---|---|---|---|---|---|---|---|---|---|---|---|---|---|---|
| Benchmark | [-] | 73.8 | ||||||||||||||
| I123pd | [-] | 84.5 | 84.5 | 73.5 | 95.0 | 11.5 | 18.2 | 2.90 | 0.456 | 0.527 | 0.524 | 0.194 | 0.445 | |||
| post5.4 | [-] | 85.6 | 85.6 | 73.5 | 95.0 | 12.5 | 18.8 | 2.41 | 0.431 | 0.530 | 0.624 | 0.163 | 0.456 |
Download Data |
Period Mean (original grids) [%] |
Model Period Mean (intersection) [%] |
Benchmark Period Mean (intersection) [%] |
Model Period Mean (complement) [%] |
Benchmark Period Mean (complement) [%] |
Bias [%] |
RMSE [%] |
Phase Shift [months] |
Bias Score [1] |
RMSE Score [1] |
Seasonal Cycle Score [1] |
Spatial Distribution Score [1] |
Overall Score [1] |
|||
|---|---|---|---|---|---|---|---|---|---|---|---|---|---|---|---|---|
| Benchmark | [-] | 86.4 | ||||||||||||||
| I123pd | [-] | 85.6 | 85.6 | 85.9 | 94.2 | -1.33 | 6.61 | 2.26 | 0.239 | 0.563 | 0.644 | 0.709 | 0.544 | |||
| post5.4 | [-] | 85.6 | 85.7 | 85.9 | 94.2 | -1.24 | 6.61 | 2.25 | 0.237 | 0.566 | 0.646 | 0.704 | 0.544 |
Download Data |
Period Mean (original grids) [%] |
Model Period Mean (intersection) [%] |
Benchmark Period Mean (intersection) [%] |
Model Period Mean (complement) [%] |
Benchmark Period Mean (complement) [%] |
Bias [%] |
RMSE [%] |
Phase Shift [months] |
Bias Score [1] |
RMSE Score [1] |
Seasonal Cycle Score [1] |
Spatial Distribution Score [1] |
Overall Score [1] |
|||
|---|---|---|---|---|---|---|---|---|---|---|---|---|---|---|---|---|
| Benchmark | [-] | 73.4 | ||||||||||||||
| I123pd | [-] | 81.4 | 81.4 | 73.4 | 95.0 | 8.03 | 11.4 | 2.07 | 0.573 | 0.627 | 0.685 | 0.479 | 0.598 | |||
| post5.4 | [-] | 82.9 | 82.9 | 73.4 | 95.0 | 9.53 | 12.5 | 1.96 | 0.522 | 0.634 | 0.704 | 0.443 | 0.587 |
Download Data |
Period Mean (original grids) [%] |
Model Period Mean (intersection) [%] |
Benchmark Period Mean (intersection) [%] |
Model Period Mean (complement) [%] |
Benchmark Period Mean (complement) [%] |
Bias [%] |
RMSE [%] |
Phase Shift [months] |
Bias Score [1] |
RMSE Score [1] |
Seasonal Cycle Score [1] |
Spatial Distribution Score [1] |
Overall Score [1] |
|||
|---|---|---|---|---|---|---|---|---|---|---|---|---|---|---|---|---|
| Benchmark | [-] | 57.3 | ||||||||||||||
| I123pd | [-] | 65.3 | 65.4 | 57.2 | 94.5 | 8.91 | 12.9 | 1.34 | 0.542 | 0.656 | 0.806 | 0.634 | 0.659 | |||
| post5.4 | [-] | 65.4 | 65.5 | 57.2 | 94.5 | 9.03 | 13.0 | 1.36 | 0.538 | 0.655 | 0.802 | 0.640 | 0.658 |
Download Data |
Period Mean (original grids) [%] |
Model Period Mean (intersection) [%] |
Benchmark Period Mean (intersection) [%] |
Model Period Mean (complement) [%] |
Benchmark Period Mean (complement) [%] |
Bias [%] |
RMSE [%] |
Phase Shift [months] |
Bias Score [1] |
RMSE Score [1] |
Seasonal Cycle Score [1] |
Spatial Distribution Score [1] |
Overall Score [1] |
|||
|---|---|---|---|---|---|---|---|---|---|---|---|---|---|---|---|---|
| Benchmark | [-] | 66.8 | ||||||||||||||
| I123pd | [-] | 66.7 | 66.8 | 66.4 | 94.0 | 2.44 | 8.38 | 1.07 | 0.541 | 0.688 | 0.842 | 0.836 | 0.719 | |||
| post5.4 | [-] | 66.8 | 66.8 | 66.4 | 94.0 | 2.52 | 8.39 | 1.08 | 0.538 | 0.689 | 0.841 | 0.839 | 0.720 |
Download Data |
Period Mean (original grids) [%] |
Model Period Mean (intersection) [%] |
Benchmark Period Mean (intersection) [%] |
Model Period Mean (complement) [%] |
Benchmark Period Mean (complement) [%] |
Bias [%] |
RMSE [%] |
Phase Shift [months] |
Bias Score [1] |
RMSE Score [1] |
Seasonal Cycle Score [1] |
Spatial Distribution Score [1] |
Overall Score [1] |
|||
|---|---|---|---|---|---|---|---|---|---|---|---|---|---|---|---|---|
| Benchmark | [-] | 77.8 | ||||||||||||||
| I123pd | [-] | 87.3 | 87.2 | 77.7 | 94.8 | 9.89 | 13.7 | 2.79 | 0.499 | 0.598 | 0.525 | 0.251 | 0.494 | |||
| post5.4 | [-] | 88.1 | 88.0 | 77.7 | 94.8 | 10.6 | 14.3 | 2.62 | 0.476 | 0.604 | 0.565 | 0.172 | 0.484 |
Download Data |
Period Mean (original grids) [%] |
Model Period Mean (intersection) [%] |
Benchmark Period Mean (intersection) [%] |
Model Period Mean (complement) [%] |
Benchmark Period Mean (complement) [%] |
Bias [%] |
RMSE [%] |
Phase Shift [months] |
Bias Score [1] |
RMSE Score [1] |
Seasonal Cycle Score [1] |
Spatial Distribution Score [1] |
Overall Score [1] |
|||
|---|---|---|---|---|---|---|---|---|---|---|---|---|---|---|---|---|
| Benchmark | [-] | 54.9 | ||||||||||||||
| I123pd | [-] | 48.9 | 48.9 | 54.3 | 89.3 | -2.70 | 6.40 | 0.626 | 0.634 | 0.758 | 0.900 | 0.892 | 0.788 | |||
| post5.4 | [-] | 49.0 | 49.0 | 54.3 | 89.3 | -2.59 | 6.41 | 0.633 | 0.633 | 0.755 | 0.899 | 0.895 | 0.787 |
Download Data |
Period Mean (original grids) [%] |
Model Period Mean (intersection) [%] |
Benchmark Period Mean (intersection) [%] |
Model Period Mean (complement) [%] |
Benchmark Period Mean (complement) [%] |
Bias [%] |
RMSE [%] |
Phase Shift [months] |
Bias Score [1] |
RMSE Score [1] |
Seasonal Cycle Score [1] |
Spatial Distribution Score [1] |
Overall Score [1] |
|||
|---|---|---|---|---|---|---|---|---|---|---|---|---|---|---|---|---|
| Benchmark | [-] | 78.1 | ||||||||||||||
| I123pd | [-] | 78.7 | 78.7 | 77.9 | 90.6 | 0.711 | 6.27 | 0.615 | 0.595 | 0.753 | 0.935 | 0.774 | 0.762 | |||
| post5.4 | [-] | 78.8 | 78.8 | 77.9 | 90.6 | 0.850 | 6.29 | 0.622 | 0.588 | 0.759 | 0.935 | 0.774 | 0.763 |
Download Data |
Period Mean (original grids) [%] |
Model Period Mean (intersection) [%] |
Benchmark Period Mean (intersection) [%] |
Model Period Mean (complement) [%] |
Benchmark Period Mean (complement) [%] |
Bias [%] |
RMSE [%] |
Phase Shift [months] |
Bias Score [1] |
RMSE Score [1] |
Seasonal Cycle Score [1] |
Spatial Distribution Score [1] |
Overall Score [1] |
|||
|---|---|---|---|---|---|---|---|---|---|---|---|---|---|---|---|---|
| Benchmark | [-] | 69.0 | ||||||||||||||
| I123pd | [-] | 70.6 | 70.5 | 68.8 | 93.4 | 2.72 | 8.72 | 1.44 | 0.495 | 0.650 | 0.787 | 0.960 | 0.709 | |||
| post5.4 | [-] | 70.8 | 70.8 | 68.8 | 93.4 | 2.93 | 8.82 | 1.42 | 0.489 | 0.652 | 0.790 | 0.960 | 0.709 |
Download Data |
Period Mean (original grids) [%] |
Model Period Mean (intersection) [%] |
Benchmark Period Mean (intersection) [%] |
Model Period Mean (complement) [%] |
Benchmark Period Mean (complement) [%] |
Bias [%] |
RMSE [%] |
Phase Shift [months] |
Bias Score [1] |
RMSE Score [1] |
Seasonal Cycle Score [1] |
Spatial Distribution Score [1] |
Overall Score [1] |
|||
|---|---|---|---|---|---|---|---|---|---|---|---|---|---|---|---|---|
| Benchmark | [-] | 44.6 | ||||||||||||||
| I123pd | [-] | 48.5 | 48.5 | 44.3 | 92.9 | 5.80 | 11.3 | 0.756 | 0.398 | 0.604 | 0.900 | 0.833 | 0.668 | |||
| post5.4 | [-] | 48.5 | 48.6 | 44.3 | 92.9 | 5.81 | 11.3 | 0.756 | 0.397 | 0.605 | 0.900 | 0.834 | 0.668 |
Download Data |
Period Mean (original grids) [%] |
Model Period Mean (intersection) [%] |
Benchmark Period Mean (intersection) [%] |
Model Period Mean (complement) [%] |
Benchmark Period Mean (complement) [%] |
Bias [%] |
RMSE [%] |
Phase Shift [months] |
Bias Score [1] |
RMSE Score [1] |
Seasonal Cycle Score [1] |
Spatial Distribution Score [1] |
Overall Score [1] |
|||
|---|---|---|---|---|---|---|---|---|---|---|---|---|---|---|---|---|
| Benchmark | [-] | 83.8 | ||||||||||||||
| I123pd | [-] | 80.0 | 79.9 | 83.7 | 95.0 | -3.16 | 11.7 | 2.48 | 0.495 | 0.511 | 0.604 | 0.570 | 0.538 | |||
| post5.4 | [-] | 80.5 | 80.4 | 83.7 | 95.0 | -2.75 | 11.6 | 2.44 | 0.504 | 0.509 | 0.611 | 0.518 | 0.530 |
Download Data |
Period Mean (original grids) [%] |
Model Period Mean (intersection) [%] |
Benchmark Period Mean (intersection) [%] |
Model Period Mean (complement) [%] |
Benchmark Period Mean (complement) [%] |
Bias [%] |
RMSE [%] |
Phase Shift [months] |
Bias Score [1] |
RMSE Score [1] |
Seasonal Cycle Score [1] |
Spatial Distribution Score [1] |
Overall Score [1] |
|||
|---|---|---|---|---|---|---|---|---|---|---|---|---|---|---|---|---|
| Benchmark | [-] | 72.3 | ||||||||||||||
| I123pd | [-] | 66.3 | 66.2 | 71.5 | 92.9 | -1.67 | 8.32 | 1.44 | 0.411 | 0.645 | 0.778 | 0.880 | 0.672 | |||
| post5.4 | [-] | 66.5 | 66.4 | 71.5 | 92.9 | -1.47 | 8.34 | 1.42 | 0.406 | 0.645 | 0.781 | 0.882 | 0.672 |
Download Data |
Period Mean (original grids) [%] |
Model Period Mean (intersection) [%] |
Benchmark Period Mean (intersection) [%] |
Model Period Mean (complement) [%] |
Benchmark Period Mean (complement) [%] |
Bias [%] |
RMSE [%] |
Phase Shift [months] |
Bias Score [1] |
RMSE Score [1] |
Seasonal Cycle Score [1] |
Spatial Distribution Score [1] |
Overall Score [1] |
|||
|---|---|---|---|---|---|---|---|---|---|---|---|---|---|---|---|---|
| Benchmark | [-] | 73.1 | ||||||||||||||
| I123pd | [-] | 73.2 | 73.3 | 72.8 | 94.8 | 0.797 | 5.08 | 2.38 | 0.642 | 0.686 | 0.595 | 0.613 | 0.645 | |||
| post5.4 | [-] | 73.4 | 73.5 | 72.8 | 94.8 | 0.994 | 5.01 | 2.15 | 0.625 | 0.718 | 0.642 | 0.637 | 0.668 |
Download Data |
Period Mean (original grids) [%] |
Model Period Mean (intersection) [%] |
Benchmark Period Mean (intersection) [%] |
Model Period Mean (complement) [%] |
Benchmark Period Mean (complement) [%] |
Bias [%] |
RMSE [%] |
Phase Shift [months] |
Bias Score [1] |
RMSE Score [1] |
Seasonal Cycle Score [1] |
Spatial Distribution Score [1] |
Overall Score [1] |
|||
|---|---|---|---|---|---|---|---|---|---|---|---|---|---|---|---|---|
| Benchmark | [-] | 79.9 | ||||||||||||||
| I123pd | [-] | 77.5 | 77.6 | 79.9 | 95.0 | -2.00 | 7.49 | 1.15 | 0.731 | 0.571 | 0.863 | 0.853 | 0.718 | |||
| post5.4 | [-] | 77.7 | 77.8 | 79.9 | 95.0 | -1.79 | 7.32 | 1.10 | 0.735 | 0.580 | 0.872 | 0.882 | 0.730 |
Download Data |
Period Mean (original grids) [%] |
Model Period Mean (intersection) [%] |
Benchmark Period Mean (intersection) [%] |
Model Period Mean (complement) [%] |
Benchmark Period Mean (complement) [%] |
Bias [%] |
RMSE [%] |
Phase Shift [months] |
Bias Score [1] |
RMSE Score [1] |
Seasonal Cycle Score [1] |
Spatial Distribution Score [1] |
Overall Score [1] |
|||
|---|---|---|---|---|---|---|---|---|---|---|---|---|---|---|---|---|
| Benchmark | [-] | 56.5 | ||||||||||||||
| I123pd | [-] | 57.7 | 57.8 | 56.4 | 94.9 | 2.17 | 5.77 | 1.08 | 0.710 | 0.727 | 0.868 | 0.940 | 0.794 | |||
| post5.4 | [-] | 57.7 | 57.9 | 56.4 | 94.9 | 2.21 | 5.80 | 1.07 | 0.706 | 0.728 | 0.869 | 0.939 | 0.794 |
Download Data |
Period Mean (original grids) [%] |
Model Period Mean (intersection) [%] |
Benchmark Period Mean (intersection) [%] |
Model Period Mean (complement) [%] |
Benchmark Period Mean (complement) [%] |
Bias [%] |
RMSE [%] |
Phase Shift [months] |
Bias Score [1] |
RMSE Score [1] |
Seasonal Cycle Score [1] |
Spatial Distribution Score [1] |
Overall Score [1] |
|||
|---|---|---|---|---|---|---|---|---|---|---|---|---|---|---|---|---|
| Benchmark | [-] | 82.1 | ||||||||||||||
| I123pd | [-] | 86.4 | 86.5 | 82.0 | 93.2 | 4.24 | 6.12 | 0.965 | 0.301 | 0.665 | 0.872 | 0.996 | 0.700 | |||
| post5.4 | [-] | 86.6 | 86.6 | 82.0 | 93.2 | 4.38 | 6.22 | 0.937 | 0.294 | 0.663 | 0.877 | 0.995 | 0.698 |
Download Data |
Period Mean (original grids) [%] |
Model Period Mean (intersection) [%] |
Benchmark Period Mean (intersection) [%] |
Model Period Mean (complement) [%] |
Benchmark Period Mean (complement) [%] |
Bias [%] |
RMSE [%] |
Phase Shift [months] |
Bias Score [1] |
RMSE Score [1] |
Seasonal Cycle Score [1] |
Spatial Distribution Score [1] |
Overall Score [1] |
|||
|---|---|---|---|---|---|---|---|---|---|---|---|---|---|---|---|---|
| Benchmark | [-] | 72.6 | ||||||||||||||
| I123pd | [-] | 73.5 | 73.3 | 72.4 | 94.1 | 1.28 | 4.84 | 1.05 | 0.597 | 0.705 | 0.859 | 0.964 | 0.766 | |||
| post5.4 | [-] | 73.7 | 73.5 | 72.4 | 94.1 | 1.53 | 4.97 | 1.05 | 0.584 | 0.704 | 0.859 | 0.965 | 0.763 |
Download Data |
Period Mean (original grids) [%] |
Model Period Mean (intersection) [%] |
Benchmark Period Mean (intersection) [%] |
Model Period Mean (complement) [%] |
Benchmark Period Mean (complement) [%] |
Bias [%] |
RMSE [%] |
Phase Shift [months] |
Bias Score [1] |
RMSE Score [1] |
Seasonal Cycle Score [1] |
Spatial Distribution Score [1] |
Overall Score [1] |
|||
|---|---|---|---|---|---|---|---|---|---|---|---|---|---|---|---|---|
| Benchmark | [-] | 62.3 | ||||||||||||||
| I123pd | [-] | 59.5 | 59.6 | 61.8 | 94.7 | -0.0765 | 11.9 | 1.43 | 0.369 | 0.627 | 0.796 | 0.725 | 0.629 | |||
| post5.4 | [-] | 59.7 | 59.8 | 61.8 | 94.7 | 0.120 | 11.9 | 1.43 | 0.366 | 0.625 | 0.795 | 0.729 | 0.628 |
Temporally integrated period mean