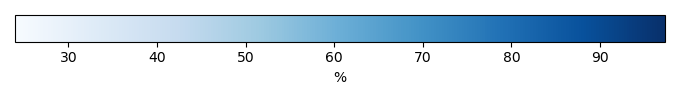
Mean State
Download Data |
Period Mean (original grids) [%] |
Model Period Mean (intersection) [%] |
Benchmark Period Mean (intersection) [%] |
Model Period Mean (complement) [%] |
Benchmark Period Mean (complement) [%] |
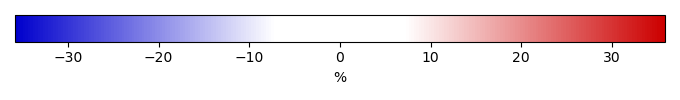
Bias [%] |
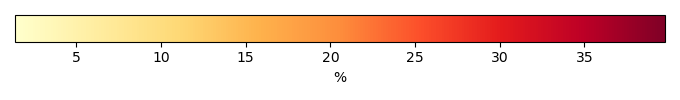
RMSE [%] |
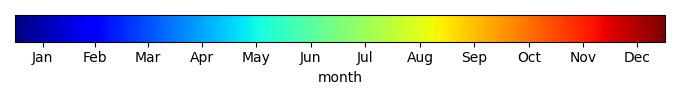
Phase Shift [months] |
Bias Score [1] |
RMSE Score [1] |
Seasonal Cycle Score [1] |
Spatial Distribution Score [1] |
Overall Score [1] |
|||
|---|---|---|---|---|---|---|---|---|---|---|---|---|---|---|---|---|
| Benchmark | [-] | 60.1 | ||||||||||||||
| I123pd | [-] | 76.2 | 76.2 | 59.5 | 93.5 | 17.2 | 19.0 | 1.55 | 0.0515 | 0.587 | 0.770 | 0.994 | 0.598 | |||
| post5.4 | [-] | 76.3 | 76.3 | 59.5 | 93.5 | 17.3 | 19.1 | 1.56 | 0.0513 | 0.588 | 0.769 | 0.994 | 0.598 |
Download Data |
Period Mean (original grids) [%] |
Model Period Mean (intersection) [%] |
Benchmark Period Mean (intersection) [%] |
Model Period Mean (complement) [%] |
Benchmark Period Mean (complement) [%] |
Bias [%] |
RMSE [%] |
Phase Shift [months] |
Bias Score [1] |
RMSE Score [1] |
Seasonal Cycle Score [1] |
Spatial Distribution Score [1] |
Overall Score [1] |
|||
|---|---|---|---|---|---|---|---|---|---|---|---|---|---|---|---|---|
| Benchmark | [-] | 41.5 | ||||||||||||||
| I123pd | [-] | 54.4 | 53.9 | 41.4 | 91.3 | 12.9 | 14.5 | 0.251 | 0.348 | 0.741 | 0.971 | 0.991 | 0.758 | |||
| post5.4 | [-] | 54.4 | 54.0 | 41.4 | 91.3 | 12.9 | 14.5 | 0.253 | 0.347 | 0.739 | 0.971 | 0.991 | 0.757 |
Download Data |
Period Mean (original grids) [%] |
Model Period Mean (intersection) [%] |
Benchmark Period Mean (intersection) [%] |
Model Period Mean (complement) [%] |
Benchmark Period Mean (complement) [%] |
Bias [%] |
RMSE [%] |
Phase Shift [months] |
Bias Score [1] |
RMSE Score [1] |
Seasonal Cycle Score [1] |
Spatial Distribution Score [1] |
Overall Score [1] |
|||
|---|---|---|---|---|---|---|---|---|---|---|---|---|---|---|---|---|
| Benchmark | [-] | 56.4 | ||||||||||||||
| I123pd | [-] | 63.6 | 63.5 | 55.9 | 93.7 | 8.97 | 12.2 | 1.14 | 0.211 | 0.702 | 0.848 | 0.907 | 0.674 | |||
| post5.4 | [-] | 63.7 | 63.6 | 55.9 | 93.7 | 9.07 | 12.3 | 1.16 | 0.209 | 0.701 | 0.843 | 0.909 | 0.673 |
Download Data |
Period Mean (original grids) [%] |
Model Period Mean (intersection) [%] |
Benchmark Period Mean (intersection) [%] |
Model Period Mean (complement) [%] |
Benchmark Period Mean (complement) [%] |
Bias [%] |
RMSE [%] |
Phase Shift [months] |
Bias Score [1] |
RMSE Score [1] |
Seasonal Cycle Score [1] |
Spatial Distribution Score [1] |
Overall Score [1] |
|||
|---|---|---|---|---|---|---|---|---|---|---|---|---|---|---|---|---|
| Benchmark | [-] | 75.8 | ||||||||||||||
| I123pd | [-] | 84.5 | 84.5 | 75.6 | 95.0 | 9.35 | 15.8 | 2.36 | 0.526 | 0.579 | 0.630 | 0.215 | 0.506 | |||
| post5.4 | [-] | 85.6 | 85.6 | 75.6 | 95.0 | 10.3 | 16.2 | 1.96 | 0.501 | 0.588 | 0.713 | 0.180 | 0.514 |
Download Data |
Period Mean (original grids) [%] |
Model Period Mean (intersection) [%] |
Benchmark Period Mean (intersection) [%] |
Model Period Mean (complement) [%] |
Benchmark Period Mean (complement) [%] |
Bias [%] |
RMSE [%] |
Phase Shift [months] |
Bias Score [1] |
RMSE Score [1] |
Seasonal Cycle Score [1] |
Spatial Distribution Score [1] |
Overall Score [1] |
|||
|---|---|---|---|---|---|---|---|---|---|---|---|---|---|---|---|---|
| Benchmark | [-] | 73.8 | ||||||||||||||
| I123pd | [-] | 85.5 | 85.6 | 72.7 | 92.9 | 12.0 | 18.4 | 2.23 | 0.00355 | 0.534 | 0.652 | 0.282 | 0.401 | |||
| post5.4 | [-] | 85.6 | 85.6 | 72.7 | 92.9 | 12.0 | 18.4 | 2.19 | 0.00346 | 0.539 | 0.657 | 0.279 | 0.403 |
Download Data |
Period Mean (original grids) [%] |
Model Period Mean (intersection) [%] |
Benchmark Period Mean (intersection) [%] |
Model Period Mean (complement) [%] |
Benchmark Period Mean (complement) [%] |
Bias [%] |
RMSE [%] |
Phase Shift [months] |
Bias Score [1] |
RMSE Score [1] |
Seasonal Cycle Score [1] |
Spatial Distribution Score [1] |
Overall Score [1] |
|||
|---|---|---|---|---|---|---|---|---|---|---|---|---|---|---|---|---|
| Benchmark | [-] | 72.5 | ||||||||||||||
| I123pd | [-] | 81.3 | 81.4 | 72.4 | 95.0 | 8.93 | 13.5 | 1.62 | 0.576 | 0.586 | 0.775 | 0.588 | 0.622 | |||
| post5.4 | [-] | 82.8 | 82.9 | 72.4 | 95.0 | 10.4 | 14.0 | 1.53 | 0.529 | 0.605 | 0.795 | 0.548 | 0.617 |
Download Data |
Period Mean (original grids) [%] |
Model Period Mean (intersection) [%] |
Benchmark Period Mean (intersection) [%] |
Model Period Mean (complement) [%] |
Benchmark Period Mean (complement) [%] |
Bias [%] |
RMSE [%] |
Phase Shift [months] |
Bias Score [1] |
RMSE Score [1] |
Seasonal Cycle Score [1] |
Spatial Distribution Score [1] |
Overall Score [1] |
|||
|---|---|---|---|---|---|---|---|---|---|---|---|---|---|---|---|---|
| Benchmark | [-] | 53.2 | ||||||||||||||
| I123pd | [-] | 65.2 | 65.4 | 53.0 | 94.2 | 13.0 | 17.2 | 1.62 | 0.402 | 0.598 | 0.756 | 0.691 | 0.609 | |||
| post5.4 | [-] | 65.3 | 65.5 | 53.0 | 94.2 | 13.1 | 17.2 | 1.58 | 0.400 | 0.604 | 0.763 | 0.697 | 0.614 |
Download Data |
Period Mean (original grids) [%] |
Model Period Mean (intersection) [%] |
Benchmark Period Mean (intersection) [%] |
Model Period Mean (complement) [%] |
Benchmark Period Mean (complement) [%] |
Bias [%] |
RMSE [%] |
Phase Shift [months] |
Bias Score [1] |
RMSE Score [1] |
Seasonal Cycle Score [1] |
Spatial Distribution Score [1] |
Overall Score [1] |
|||
|---|---|---|---|---|---|---|---|---|---|---|---|---|---|---|---|---|
| Benchmark | [-] | 55.0 | ||||||||||||||
| I123pd | [-] | 66.7 | 66.8 | 54.4 | 92.8 | 14.5 | 18.7 | 1.29 | 0.114 | 0.666 | 0.802 | 0.836 | 0.617 | |||
| post5.4 | [-] | 66.8 | 66.9 | 54.4 | 92.8 | 14.6 | 18.7 | 1.30 | 0.113 | 0.670 | 0.800 | 0.839 | 0.619 |
Download Data |
Period Mean (original grids) [%] |
Model Period Mean (intersection) [%] |
Benchmark Period Mean (intersection) [%] |
Model Period Mean (complement) [%] |
Benchmark Period Mean (complement) [%] |
Bias [%] |
RMSE [%] |
Phase Shift [months] |
Bias Score [1] |
RMSE Score [1] |
Seasonal Cycle Score [1] |
Spatial Distribution Score [1] |
Overall Score [1] |
|||
|---|---|---|---|---|---|---|---|---|---|---|---|---|---|---|---|---|
| Benchmark | [-] | 79.3 | ||||||||||||||
| I123pd | [-] | 87.3 | 87.2 | 79.2 | 94.8 | 8.38 | 12.7 | 2.60 | 0.566 | 0.594 | 0.566 | 0.317 | 0.527 | |||
| post5.4 | [-] | 88.1 | 88.1 | 79.2 | 94.8 | 9.12 | 13.1 | 2.45 | 0.543 | 0.603 | 0.599 | 0.219 | 0.513 |
Download Data |
Period Mean (original grids) [%] |
Model Period Mean (intersection) [%] |
Benchmark Period Mean (intersection) [%] |
Model Period Mean (complement) [%] |
Benchmark Period Mean (complement) [%] |
Bias [%] |
RMSE [%] |
Phase Shift [months] |
Bias Score [1] |
RMSE Score [1] |
Seasonal Cycle Score [1] |
Spatial Distribution Score [1] |
Overall Score [1] |
|||
|---|---|---|---|---|---|---|---|---|---|---|---|---|---|---|---|---|
| Benchmark | [-] | 46.7 | ||||||||||||||
| I123pd | [-] | 48.9 | 48.8 | 46.0 | 87.1 | 5.56 | 11.5 | 0.853 | 0.288 | 0.690 | 0.858 | 0.834 | 0.672 | |||
| post5.4 | [-] | 49.0 | 48.9 | 46.0 | 87.1 | 5.67 | 11.6 | 0.860 | 0.284 | 0.687 | 0.858 | 0.838 | 0.671 |
Download Data |
Period Mean (original grids) [%] |
Model Period Mean (intersection) [%] |
Benchmark Period Mean (intersection) [%] |
Model Period Mean (complement) [%] |
Benchmark Period Mean (complement) [%] |
Bias [%] |
RMSE [%] |
Phase Shift [months] |
Bias Score [1] |
RMSE Score [1] |
Seasonal Cycle Score [1] |
Spatial Distribution Score [1] |
Overall Score [1] |
|||
|---|---|---|---|---|---|---|---|---|---|---|---|---|---|---|---|---|
| Benchmark | [-] | 72.8 | ||||||||||||||
| I123pd | [-] | 78.6 | 78.6 | 72.6 | 89.1 | 6.06 | 11.7 | 0.605 | 0.396 | 0.664 | 0.940 | 0.618 | 0.656 | |||
| post5.4 | [-] | 78.8 | 78.7 | 72.6 | 89.1 | 6.19 | 11.7 | 0.628 | 0.392 | 0.671 | 0.939 | 0.618 | 0.658 |
Download Data |
Period Mean (original grids) [%] |
Model Period Mean (intersection) [%] |
Benchmark Period Mean (intersection) [%] |
Model Period Mean (complement) [%] |
Benchmark Period Mean (complement) [%] |
Bias [%] |
RMSE [%] |
Phase Shift [months] |
Bias Score [1] |
RMSE Score [1] |
Seasonal Cycle Score [1] |
Spatial Distribution Score [1] |
Overall Score [1] |
|||
|---|---|---|---|---|---|---|---|---|---|---|---|---|---|---|---|---|
| Benchmark | [-] | 62.5 | ||||||||||||||
| I123pd | [-] | 70.5 | 70.5 | 62.2 | 92.2 | 9.29 | 14.3 | 1.51 | 0.305 | 0.615 | 0.774 | 0.904 | 0.642 | |||
| post5.4 | [-] | 70.8 | 70.8 | 62.2 | 92.2 | 9.50 | 14.4 | 1.50 | 0.301 | 0.618 | 0.778 | 0.904 | 0.644 |
Download Data |
Period Mean (original grids) [%] |
Model Period Mean (intersection) [%] |
Benchmark Period Mean (intersection) [%] |
Model Period Mean (complement) [%] |
Benchmark Period Mean (complement) [%] |
Bias [%] |
RMSE [%] |
Phase Shift [months] |
Bias Score [1] |
RMSE Score [1] |
Seasonal Cycle Score [1] |
Spatial Distribution Score [1] |
Overall Score [1] |
|||
|---|---|---|---|---|---|---|---|---|---|---|---|---|---|---|---|---|
| Benchmark | [-] | 37.5 | ||||||||||||||
| I123pd | [-] | 48.5 | 48.5 | 37.2 | 92.2 | 13.0 | 17.4 | 0.778 | 0.181 | 0.583 | 0.892 | 0.825 | 0.613 | |||
| post5.4 | [-] | 48.5 | 48.5 | 37.2 | 92.2 | 13.0 | 17.4 | 0.779 | 0.181 | 0.584 | 0.892 | 0.826 | 0.613 |
Download Data |
Period Mean (original grids) [%] |
Model Period Mean (intersection) [%] |
Benchmark Period Mean (intersection) [%] |
Model Period Mean (complement) [%] |
Benchmark Period Mean (complement) [%] |
Bias [%] |
RMSE [%] |
Phase Shift [months] |
Bias Score [1] |
RMSE Score [1] |
Seasonal Cycle Score [1] |
Spatial Distribution Score [1] |
Overall Score [1] |
|||
|---|---|---|---|---|---|---|---|---|---|---|---|---|---|---|---|---|
| Benchmark | [-] | 84.9 | ||||||||||||||
| I123pd | [-] | 80.0 | 80.0 | 84.9 | 95.0 | -4.31 | 12.0 | 2.49 | 0.517 | 0.481 | 0.602 | 0.673 | 0.551 | |||
| post5.4 | [-] | 80.5 | 80.5 | 84.9 | 95.0 | -3.90 | 11.9 | 2.45 | 0.526 | 0.481 | 0.609 | 0.619 | 0.543 |
Download Data |
Period Mean (original grids) [%] |
Model Period Mean (intersection) [%] |
Benchmark Period Mean (intersection) [%] |
Model Period Mean (complement) [%] |
Benchmark Period Mean (complement) [%] |
Bias [%] |
RMSE [%] |
Phase Shift [months] |
Bias Score [1] |
RMSE Score [1] |
Seasonal Cycle Score [1] |
Spatial Distribution Score [1] |
Overall Score [1] |
|||
|---|---|---|---|---|---|---|---|---|---|---|---|---|---|---|---|---|
| Benchmark | [-] | 62.1 | ||||||||||||||
| I123pd | [-] | 66.3 | 66.2 | 61.1 | 90.6 | 8.76 | 16.8 | 1.69 | 0.0878 | 0.591 | 0.732 | 0.800 | 0.560 | |||
| post5.4 | [-] | 66.5 | 66.4 | 61.1 | 90.6 | 8.96 | 16.9 | 1.69 | 0.0858 | 0.591 | 0.733 | 0.801 | 0.560 |
Download Data |
Period Mean (original grids) [%] |
Model Period Mean (intersection) [%] |
Benchmark Period Mean (intersection) [%] |
Model Period Mean (complement) [%] |
Benchmark Period Mean (complement) [%] |
Bias [%] |
RMSE [%] |
Phase Shift [months] |
Bias Score [1] |
RMSE Score [1] |
Seasonal Cycle Score [1] |
Spatial Distribution Score [1] |
Overall Score [1] |
|||
|---|---|---|---|---|---|---|---|---|---|---|---|---|---|---|---|---|
| Benchmark | [-] | 65.3 | ||||||||||||||
| I123pd | [-] | 73.3 | 73.4 | 65.0 | 94.7 | 8.71 | 14.0 | 4.17 | 0.317 | 0.421 | 0.265 | 0.381 | 0.361 | |||
| post5.4 | [-] | 73.4 | 73.6 | 65.0 | 94.7 | 8.91 | 13.9 | 3.95 | 0.313 | 0.438 | 0.310 | 0.401 | 0.380 |
Download Data |
Period Mean (original grids) [%] |
Model Period Mean (intersection) [%] |
Benchmark Period Mean (intersection) [%] |
Model Period Mean (complement) [%] |
Benchmark Period Mean (complement) [%] |
Bias [%] |
RMSE [%] |
Phase Shift [months] |
Bias Score [1] |
RMSE Score [1] |
Seasonal Cycle Score [1] |
Spatial Distribution Score [1] |
Overall Score [1] |
|||
|---|---|---|---|---|---|---|---|---|---|---|---|---|---|---|---|---|
| Benchmark | [-] | 77.4 | ||||||||||||||
| I123pd | [-] | 77.6 | 77.6 | 77.4 | 95.0 | 0.560 | 11.2 | 1.24 | 0.785 | 0.495 | 0.852 | 0.850 | 0.696 | |||
| post5.4 | [-] | 77.8 | 77.9 | 77.4 | 95.0 | 0.771 | 11.0 | 1.21 | 0.779 | 0.501 | 0.858 | 0.879 | 0.704 |
Download Data |
Period Mean (original grids) [%] |
Model Period Mean (intersection) [%] |
Benchmark Period Mean (intersection) [%] |
Model Period Mean (complement) [%] |
Benchmark Period Mean (complement) [%] |
Bias [%] |
RMSE [%] |
Phase Shift [months] |
Bias Score [1] |
RMSE Score [1] |
Seasonal Cycle Score [1] |
Spatial Distribution Score [1] |
Overall Score [1] |
|||
|---|---|---|---|---|---|---|---|---|---|---|---|---|---|---|---|---|
| Benchmark | [-] | 51.9 | ||||||||||||||
| I123pd | [-] | 57.7 | 57.9 | 51.8 | 94.8 | 6.81 | 9.79 | 0.813 | 0.564 | 0.692 | 0.914 | 0.936 | 0.760 | |||
| post5.4 | [-] | 57.7 | 57.9 | 51.8 | 94.8 | 6.86 | 9.77 | 0.794 | 0.562 | 0.696 | 0.917 | 0.935 | 0.761 |
Download Data |
Period Mean (original grids) [%] |
Model Period Mean (intersection) [%] |
Benchmark Period Mean (intersection) [%] |
Model Period Mean (complement) [%] |
Benchmark Period Mean (complement) [%] |
Bias [%] |
RMSE [%] |
Phase Shift [months] |
Bias Score [1] |
RMSE Score [1] |
Seasonal Cycle Score [1] |
Spatial Distribution Score [1] |
Overall Score [1] |
|||
|---|---|---|---|---|---|---|---|---|---|---|---|---|---|---|---|---|
| Benchmark | [-] | 64.8 | ||||||||||||||
| I123pd | [-] | 86.4 | 86.5 | 64.6 | 91.6 | 21.7 | 22.7 | 0.989 | 0.0107 | 0.692 | 0.866 | 0.907 | 0.634 | |||
| post5.4 | [-] | 86.6 | 86.6 | 64.6 | 91.6 | 21.8 | 22.9 | 0.966 | 0.0104 | 0.692 | 0.870 | 0.901 | 0.633 |
Download Data |
Period Mean (original grids) [%] |
Model Period Mean (intersection) [%] |
Benchmark Period Mean (intersection) [%] |
Model Period Mean (complement) [%] |
Benchmark Period Mean (complement) [%] |
Bias [%] |
RMSE [%] |
Phase Shift [months] |
Bias Score [1] |
RMSE Score [1] |
Seasonal Cycle Score [1] |
Spatial Distribution Score [1] |
Overall Score [1] |
|||
|---|---|---|---|---|---|---|---|---|---|---|---|---|---|---|---|---|
| Benchmark | [-] | 59.3 | ||||||||||||||
| I123pd | [-] | 73.5 | 73.3 | 58.9 | 93.4 | 14.7 | 16.5 | 1.03 | 0.0982 | 0.666 | 0.870 | 0.855 | 0.631 | |||
| post5.4 | [-] | 73.7 | 73.5 | 58.9 | 93.4 | 15.0 | 16.7 | 1.04 | 0.0954 | 0.666 | 0.870 | 0.857 | 0.631 |
Download Data |
Period Mean (original grids) [%] |
Model Period Mean (intersection) [%] |
Benchmark Period Mean (intersection) [%] |
Model Period Mean (complement) [%] |
Benchmark Period Mean (complement) [%] |
Bias [%] |
RMSE [%] |
Phase Shift [months] |
Bias Score [1] |
RMSE Score [1] |
Seasonal Cycle Score [1] |
Spatial Distribution Score [1] |
Overall Score [1] |
|||
|---|---|---|---|---|---|---|---|---|---|---|---|---|---|---|---|---|
| Benchmark | [-] | 57.3 | ||||||||||||||
| I123pd | [-] | 59.5 | 59.6 | 56.7 | 94.5 | 5.06 | 13.1 | 1.43 | 0.309 | 0.657 | 0.800 | 0.722 | 0.629 | |||
| post5.4 | [-] | 59.7 | 59.8 | 56.7 | 94.5 | 5.26 | 13.2 | 1.42 | 0.304 | 0.657 | 0.801 | 0.725 | 0.629 |
Temporally integrated period mean