Mean State
Download Data |
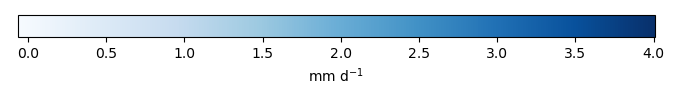
Period Mean (original grids) [mm d-1] |
Model Period Mean (intersection) [mm d-1] |
Benchmark Period Mean (intersection) [mm d-1] |
Model Period Mean (complement) [mm d-1] |
Benchmark Period Mean (complement) [mm d-1] |
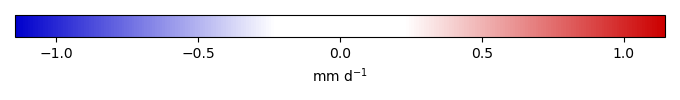
Bias [mm d-1] |
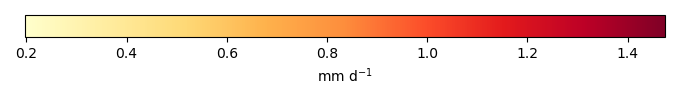
RMSE [mm d-1] |
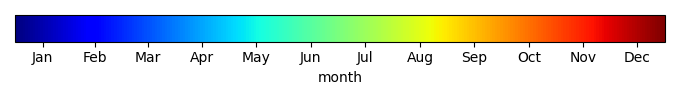
Phase Shift [months] |
Bias Score [1] |
RMSE Score [1] |
Seasonal Cycle Score [1] |
Spatial Distribution Score [1] |
Overall Score [1] |
|||
|---|---|---|---|---|---|---|---|---|---|---|---|---|---|---|---|---|
| Benchmark | [-] | 2.49 | ||||||||||||||
| I123pd | [-] | 2.50 | 2.53 | 2.49 | 1.80 | 0.0296 | 0.657 | 2.86 | 0.589 | 0.650 | 0.526 | 0.973 | 0.678 | |||
| post5.4 | [-] | 2.51 | 2.54 | 2.49 | 1.81 | 0.0394 | 0.658 | 2.85 | 0.588 | 0.649 | 0.527 | 0.974 | 0.677 |
Download Data |
Period Mean (original grids) [mm d-1] |
Model Period Mean (intersection) [mm d-1] |
Benchmark Period Mean (intersection) [mm d-1] |
Model Period Mean (complement) [mm d-1] |
Benchmark Period Mean (complement) [mm d-1] |
Bias [mm d-1] |
RMSE [mm d-1] |
Phase Shift [months] |
Bias Score [1] |
RMSE Score [1] |
Seasonal Cycle Score [1] |
Spatial Distribution Score [1] |
Overall Score [1] |
|||
|---|---|---|---|---|---|---|---|---|---|---|---|---|---|---|---|---|
| Benchmark | [-] | 1.21 | ||||||||||||||
| I123pd | [-] | 1.71 | 1.72 | 1.21 | 0.766 | 0.511 | 0.995 | 0.908 | 0.277 | 0.475 | 0.892 | 0.779 | 0.579 | |||
| post5.4 | [-] | 1.71 | 1.73 | 1.21 | 0.767 | 0.520 | 1.00 | 0.927 | 0.275 | 0.471 | 0.890 | 0.784 | 0.578 |
Download Data |
Period Mean (original grids) [mm d-1] |
Model Period Mean (intersection) [mm d-1] |
Benchmark Period Mean (intersection) [mm d-1] |
Model Period Mean (complement) [mm d-1] |
Benchmark Period Mean (complement) [mm d-1] |
Bias [mm d-1] |
RMSE [mm d-1] |
Phase Shift [months] |
Bias Score [1] |
RMSE Score [1] |
Seasonal Cycle Score [1] |
Spatial Distribution Score [1] |
Overall Score [1] |
|||
|---|---|---|---|---|---|---|---|---|---|---|---|---|---|---|---|---|
| Benchmark | [-] | 1.67 | ||||||||||||||
| I123pd | [-] | 1.65 | 1.64 | 1.67 | 1.75 | 2.90 | -0.0169 | 0.731 | 1.26 | 0.570 | 0.547 | 0.852 | 0.884 | 0.680 | ||
| post5.4 | [-] | 1.66 | 1.65 | 1.67 | 1.76 | 2.90 | -0.00631 | 0.730 | 1.25 | 0.571 | 0.547 | 0.853 | 0.890 | 0.681 |
Download Data |
Period Mean (original grids) [mm d-1] |
Model Period Mean (intersection) [mm d-1] |
Benchmark Period Mean (intersection) [mm d-1] |
Model Period Mean (complement) [mm d-1] |
Benchmark Period Mean (complement) [mm d-1] |
Bias [mm d-1] |
RMSE [mm d-1] |
Phase Shift [months] |
Bias Score [1] |
RMSE Score [1] |
Seasonal Cycle Score [1] |
Spatial Distribution Score [1] |
Overall Score [1] |
|||
|---|---|---|---|---|---|---|---|---|---|---|---|---|---|---|---|---|
| Benchmark | [-] | 0.851 | ||||||||||||||
| I123pd | [-] | 0.449 | 0.451 | 0.851 | 0.432 | -0.401 | 0.510 | 0.411 | 0.0514 | 0.376 | 0.972 | 0.872 | 0.530 | |||
| post5.4 | [-] | 0.462 | 0.463 | 0.851 | 0.445 | -0.388 | 0.498 | 0.446 | 0.0607 | 0.382 | 0.970 | 0.882 | 0.536 |
Download Data |
Period Mean (original grids) [mm d-1] |
Model Period Mean (intersection) [mm d-1] |
Benchmark Period Mean (intersection) [mm d-1] |
Model Period Mean (complement) [mm d-1] |
Benchmark Period Mean (complement) [mm d-1] |
Bias [mm d-1] |
RMSE [mm d-1] |
Phase Shift [months] |
Bias Score [1] |
RMSE Score [1] |
Seasonal Cycle Score [1] |
Spatial Distribution Score [1] |
Overall Score [1] |
|||
|---|---|---|---|---|---|---|---|---|---|---|---|---|---|---|---|---|
| Benchmark | [-] | 3.76 | ||||||||||||||
| I123pd | [-] | 3.65 | 3.65 | 3.76 | 3.63 | 3.88 | -0.117 | 0.576 | 2.89 | 0.505 | 0.707 | 0.522 | 0.682 | 0.625 | ||
| post5.4 | [-] | 3.66 | 3.67 | 3.76 | 3.64 | 3.88 | -0.101 | 0.587 | 2.91 | 0.496 | 0.709 | 0.519 | 0.652 | 0.617 |
Download Data |
Period Mean (original grids) [mm d-1] |
Model Period Mean (intersection) [mm d-1] |
Benchmark Period Mean (intersection) [mm d-1] |
Model Period Mean (complement) [mm d-1] |
Benchmark Period Mean (complement) [mm d-1] |
Bias [mm d-1] |
RMSE [mm d-1] |
Phase Shift [months] |
Bias Score [1] |
RMSE Score [1] |
Seasonal Cycle Score [1] |
Spatial Distribution Score [1] |
Overall Score [1] |
|||
|---|---|---|---|---|---|---|---|---|---|---|---|---|---|---|---|---|
| Benchmark | [-] | 1.12 | ||||||||||||||
| I123pd | [-] | 0.804 | 0.800 | 1.12 | 0.837 | 1.43 | -0.316 | 0.503 | 0.714 | 0.173 | 0.351 | 0.947 | 0.965 | 0.557 | ||
| post5.4 | [-] | 0.812 | 0.809 | 1.12 | 0.851 | 1.43 | -0.308 | 0.497 | 0.757 | 0.187 | 0.350 | 0.944 | 0.967 | 0.560 |
Download Data |
Period Mean (original grids) [mm d-1] |
Model Period Mean (intersection) [mm d-1] |
Benchmark Period Mean (intersection) [mm d-1] |
Model Period Mean (complement) [mm d-1] |
Benchmark Period Mean (complement) [mm d-1] |
Bias [mm d-1] |
RMSE [mm d-1] |
Phase Shift [months] |
Bias Score [1] |
RMSE Score [1] |
Seasonal Cycle Score [1] |
Spatial Distribution Score [1] |
Overall Score [1] |
|||
|---|---|---|---|---|---|---|---|---|---|---|---|---|---|---|---|---|
| Benchmark | [-] | 1.17 | ||||||||||||||
| I123pd | [-] | 0.963 | 1.05 | 1.17 | 0.594 | -0.106 | 0.666 | 1.47 | 0.530 | 0.357 | 0.779 | 0.873 | 0.579 | |||
| post5.4 | [-] | 0.959 | 1.04 | 1.17 | 0.594 | -0.111 | 0.663 | 1.44 | 0.528 | 0.360 | 0.784 | 0.874 | 0.581 |
Download Data |
Period Mean (original grids) [mm d-1] |
Model Period Mean (intersection) [mm d-1] |
Benchmark Period Mean (intersection) [mm d-1] |
Model Period Mean (complement) [mm d-1] |
Benchmark Period Mean (complement) [mm d-1] |
Bias [mm d-1] |
RMSE [mm d-1] |
Phase Shift [months] |
Bias Score [1] |
RMSE Score [1] |
Seasonal Cycle Score [1] |
Spatial Distribution Score [1] |
Overall Score [1] |
|||
|---|---|---|---|---|---|---|---|---|---|---|---|---|---|---|---|---|
| Benchmark | [-] | 2.11 | ||||||||||||||
| I123pd | [-] | 1.97 | 2.03 | 2.11 | 1.53 | 4.04 | -0.0229 | 0.813 | 1.64 | 0.493 | 0.524 | 0.777 | 0.792 | 0.622 | ||
| post5.4 | [-] | 1.96 | 2.02 | 2.11 | 1.54 | 4.04 | -0.0261 | 0.806 | 1.63 | 0.502 | 0.524 | 0.780 | 0.800 | 0.626 |
Download Data |
Period Mean (original grids) [mm d-1] |
Model Period Mean (intersection) [mm d-1] |
Benchmark Period Mean (intersection) [mm d-1] |
Model Period Mean (complement) [mm d-1] |
Benchmark Period Mean (complement) [mm d-1] |
Bias [mm d-1] |
RMSE [mm d-1] |
Phase Shift [months] |
Bias Score [1] |
RMSE Score [1] |
Seasonal Cycle Score [1] |
Spatial Distribution Score [1] |
Overall Score [1] |
|||
|---|---|---|---|---|---|---|---|---|---|---|---|---|---|---|---|---|
| Benchmark | [-] | 0.785 | ||||||||||||||
| I123pd | [-] | 0.521 | 0.542 | 0.785 | 0.355 | -0.244 | 0.378 | 0.519 | 0.225 | 0.449 | 0.965 | 0.981 | 0.614 | |||
| post5.4 | [-] | 0.536 | 0.558 | 0.785 | 0.365 | -0.228 | 0.367 | 0.549 | 0.262 | 0.454 | 0.963 | 0.978 | 0.622 |
Download Data |
Period Mean (original grids) [mm d-1] |
Model Period Mean (intersection) [mm d-1] |
Benchmark Period Mean (intersection) [mm d-1] |
Model Period Mean (complement) [mm d-1] |
Benchmark Period Mean (complement) [mm d-1] |
Bias [mm d-1] |
RMSE [mm d-1] |
Phase Shift [months] |
Bias Score [1] |
RMSE Score [1] |
Seasonal Cycle Score [1] |
Spatial Distribution Score [1] |
Overall Score [1] |
|||
|---|---|---|---|---|---|---|---|---|---|---|---|---|---|---|---|---|
| Benchmark | [-] | 0.787 | ||||||||||||||
| I123pd | [-] | 1.14 | 1.11 | 0.786 | 1.64 | 1.79 | 0.370 | 0.629 | 2.01 | 0.444 | 0.644 | 0.691 | 0.908 | 0.666 | ||
| post5.4 | [-] | 1.15 | 1.12 | 0.786 | 1.66 | 1.79 | 0.376 | 0.631 | 2.01 | 0.443 | 0.641 | 0.693 | 0.915 | 0.666 |
Download Data |
Period Mean (original grids) [mm d-1] |
Model Period Mean (intersection) [mm d-1] |
Benchmark Period Mean (intersection) [mm d-1] |
Model Period Mean (complement) [mm d-1] |
Benchmark Period Mean (complement) [mm d-1] |
Bias [mm d-1] |
RMSE [mm d-1] |
Phase Shift [months] |
Bias Score [1] |
RMSE Score [1] |
Seasonal Cycle Score [1] |
Spatial Distribution Score [1] |
Overall Score [1] |
|||
|---|---|---|---|---|---|---|---|---|---|---|---|---|---|---|---|---|
| Benchmark | [-] | 1.32 | ||||||||||||||
| I123pd | [-] | 1.17 | 1.16 | 1.32 | 1.18 | 1.05 | -0.150 | 0.484 | 0.352 | 0.492 | 0.553 | 0.976 | 0.988 | 0.713 | ||
| post5.4 | [-] | 1.17 | 1.17 | 1.32 | 1.19 | 1.05 | -0.142 | 0.484 | 0.401 | 0.500 | 0.548 | 0.973 | 0.988 | 0.712 |
Download Data |
Period Mean (original grids) [mm d-1] |
Model Period Mean (intersection) [mm d-1] |
Benchmark Period Mean (intersection) [mm d-1] |
Model Period Mean (complement) [mm d-1] |
Benchmark Period Mean (complement) [mm d-1] |
Bias [mm d-1] |
RMSE [mm d-1] |
Phase Shift [months] |
Bias Score [1] |
RMSE Score [1] |
Seasonal Cycle Score [1] |
Spatial Distribution Score [1] |
Overall Score [1] |
|||
|---|---|---|---|---|---|---|---|---|---|---|---|---|---|---|---|---|
| Benchmark | [-] | 1.56 | ||||||||||||||
| I123pd | [-] | 1.18 | 1.49 | 1.56 | 0.353 | 2.15 | -0.0494 | 0.653 | 1.39 | 0.436 | 0.493 | 0.811 | 0.968 | 0.640 | ||
| post5.4 | [-] | 1.19 | 1.49 | 1.56 | 0.357 | 2.15 | -0.0430 | 0.652 | 1.40 | 0.439 | 0.492 | 0.810 | 0.969 | 0.640 |
Download Data |
Period Mean (original grids) [mm d-1] |
Model Period Mean (intersection) [mm d-1] |
Benchmark Period Mean (intersection) [mm d-1] |
Model Period Mean (complement) [mm d-1] |
Benchmark Period Mean (complement) [mm d-1] |
Bias [mm d-1] |
RMSE [mm d-1] |
Phase Shift [months] |
Bias Score [1] |
RMSE Score [1] |
Seasonal Cycle Score [1] |
Spatial Distribution Score [1] |
Overall Score [1] |
|||
|---|---|---|---|---|---|---|---|---|---|---|---|---|---|---|---|---|
| Benchmark | [-] | 0.603 | ||||||||||||||
| I123pd | [-] | 0.338 | 0.873 | 0.603 | 0.212 | 0.282 | 0.738 | 2.06 | 0.511 | 0.369 | 0.688 | 0.955 | 0.579 | |||
| post5.4 | [-] | 0.338 | 0.871 | 0.603 | 0.212 | 0.280 | 0.738 | 2.10 | 0.513 | 0.369 | 0.683 | 0.956 | 0.578 |
Download Data |
Period Mean (original grids) [mm d-1] |
Model Period Mean (intersection) [mm d-1] |
Benchmark Period Mean (intersection) [mm d-1] |
Model Period Mean (complement) [mm d-1] |
Benchmark Period Mean (complement) [mm d-1] |
Bias [mm d-1] |
RMSE [mm d-1] |
Phase Shift [months] |
Bias Score [1] |
RMSE Score [1] |
Seasonal Cycle Score [1] |
Spatial Distribution Score [1] |
Overall Score [1] |
|||
|---|---|---|---|---|---|---|---|---|---|---|---|---|---|---|---|---|
| Benchmark | [-] | 0.876 | ||||||||||||||
| I123pd | [-] | 0.598 | 0.677 | 0.876 | 0.376 | -0.198 | 0.387 | 0.688 | 0.363 | 0.432 | 0.954 | 0.865 | 0.609 | |||
| post5.4 | [-] | 0.607 | 0.688 | 0.876 | 0.381 | -0.187 | 0.385 | 0.699 | 0.373 | 0.428 | 0.953 | 0.855 | 0.607 |
Download Data |
Period Mean (original grids) [mm d-1] |
Model Period Mean (intersection) [mm d-1] |
Benchmark Period Mean (intersection) [mm d-1] |
Model Period Mean (complement) [mm d-1] |
Benchmark Period Mean (complement) [mm d-1] |
Bias [mm d-1] |
RMSE [mm d-1] |
Phase Shift [months] |
Bias Score [1] |
RMSE Score [1] |
Seasonal Cycle Score [1] |
Spatial Distribution Score [1] |
Overall Score [1] |
|||
|---|---|---|---|---|---|---|---|---|---|---|---|---|---|---|---|---|
| Benchmark | [-] | 2.12 | ||||||||||||||
| I123pd | [-] | 2.01 | 1.96 | 2.12 | 2.34 | 3.97 | -0.0696 | 0.656 | 1.58 | 0.588 | 0.583 | 0.790 | 0.968 | 0.702 | ||
| post5.4 | [-] | 2.02 | 1.97 | 2.12 | 2.35 | 3.97 | -0.0596 | 0.657 | 1.59 | 0.589 | 0.579 | 0.790 | 0.970 | 0.702 |
Download Data |
Period Mean (original grids) [mm d-1] |
Model Period Mean (intersection) [mm d-1] |
Benchmark Period Mean (intersection) [mm d-1] |
Model Period Mean (complement) [mm d-1] |
Benchmark Period Mean (complement) [mm d-1] |
Bias [mm d-1] |
RMSE [mm d-1] |
Phase Shift [months] |
Bias Score [1] |
RMSE Score [1] |
Seasonal Cycle Score [1] |
Spatial Distribution Score [1] |
Overall Score [1] |
|||
|---|---|---|---|---|---|---|---|---|---|---|---|---|---|---|---|---|
| Benchmark | [-] | 1.88 | ||||||||||||||
| I123pd | [-] | 1.66 | 1.66 | 1.88 | 1.77 | -0.209 | 0.575 | 0.809 | 0.438 | 0.440 | 0.940 | 0.843 | 0.620 | |||
| post5.4 | [-] | 1.65 | 1.65 | 1.88 | 1.78 | -0.218 | 0.586 | 0.856 | 0.422 | 0.427 | 0.936 | 0.891 | 0.621 |
Download Data |
Period Mean (original grids) [mm d-1] |
Model Period Mean (intersection) [mm d-1] |
Benchmark Period Mean (intersection) [mm d-1] |
Model Period Mean (complement) [mm d-1] |
Benchmark Period Mean (complement) [mm d-1] |
Bias [mm d-1] |
RMSE [mm d-1] |
Phase Shift [months] |
Bias Score [1] |
RMSE Score [1] |
Seasonal Cycle Score [1] |
Spatial Distribution Score [1] |
Overall Score [1] |
|||
|---|---|---|---|---|---|---|---|---|---|---|---|---|---|---|---|---|
| Benchmark | [-] | 1.14 | ||||||||||||||
| I123pd | [-] | 1.05 | 1.04 | 1.14 | 1.33 | -0.0834 | 0.407 | 0.609 | 0.599 | 0.452 | 0.957 | 0.994 | 0.691 | |||
| post5.4 | [-] | 1.05 | 1.04 | 1.14 | 1.34 | -0.0861 | 0.407 | 0.727 | 0.597 | 0.450 | 0.949 | 0.993 | 0.688 |
Download Data |
Period Mean (original grids) [mm d-1] |
Model Period Mean (intersection) [mm d-1] |
Benchmark Period Mean (intersection) [mm d-1] |
Model Period Mean (complement) [mm d-1] |
Benchmark Period Mean (complement) [mm d-1] |
Bias [mm d-1] |
RMSE [mm d-1] |
Phase Shift [months] |
Bias Score [1] |
RMSE Score [1] |
Seasonal Cycle Score [1] |
Spatial Distribution Score [1] |
Overall Score [1] |
|||
|---|---|---|---|---|---|---|---|---|---|---|---|---|---|---|---|---|
| Benchmark | [-] | 0.787 | ||||||||||||||
| I123pd | [-] | 0.912 | 0.922 | 0.787 | 1.11 | 0.143 | 0.638 | 1.91 | 0.632 | 0.388 | 0.696 | 0.962 | 0.613 | |||
| post5.4 | [-] | 0.909 | 0.918 | 0.787 | 1.12 | 0.140 | 0.633 | 1.86 | 0.635 | 0.393 | 0.704 | 0.962 | 0.617 |
Download Data |
Period Mean (original grids) [mm d-1] |
Model Period Mean (intersection) [mm d-1] |
Benchmark Period Mean (intersection) [mm d-1] |
Model Period Mean (complement) [mm d-1] |
Benchmark Period Mean (complement) [mm d-1] |
Bias [mm d-1] |
RMSE [mm d-1] |
Phase Shift [months] |
Bias Score [1] |
RMSE Score [1] |
Seasonal Cycle Score [1] |
Spatial Distribution Score [1] |
Overall Score [1] |
|||
|---|---|---|---|---|---|---|---|---|---|---|---|---|---|---|---|---|
| Benchmark | [-] | 3.61 | ||||||||||||||
| I123pd | [-] | 3.14 | 3.15 | 3.61 | 3.03 | -0.469 | 0.756 | 2.13 | 0.379 | 0.670 | 0.686 | 0.994 | 0.680 | |||
| post5.4 | [-] | 3.16 | 3.17 | 3.61 | 3.05 | -0.449 | 0.748 | 2.14 | 0.388 | 0.667 | 0.685 | 0.994 | 0.680 |
Download Data |
Period Mean (original grids) [mm d-1] |
Model Period Mean (intersection) [mm d-1] |
Benchmark Period Mean (intersection) [mm d-1] |
Model Period Mean (complement) [mm d-1] |
Benchmark Period Mean (complement) [mm d-1] |
Bias [mm d-1] |
RMSE [mm d-1] |
Phase Shift [months] |
Bias Score [1] |
RMSE Score [1] |
Seasonal Cycle Score [1] |
Spatial Distribution Score [1] |
Overall Score [1] |
|||
|---|---|---|---|---|---|---|---|---|---|---|---|---|---|---|---|---|
| Benchmark | [-] | 1.96 | ||||||||||||||
| I123pd | [-] | 2.09 | 2.08 | 1.96 | 2.15 | 1.87 | 0.118 | 0.895 | 1.44 | 0.380 | 0.512 | 0.819 | 0.764 | 0.598 | ||
| post5.4 | [-] | 2.11 | 2.10 | 1.96 | 2.18 | 1.87 | 0.139 | 0.903 | 1.46 | 0.370 | 0.508 | 0.815 | 0.770 | 0.594 |
Download Data |
Period Mean (original grids) [mm d-1] |
Model Period Mean (intersection) [mm d-1] |
Benchmark Period Mean (intersection) [mm d-1] |
Model Period Mean (complement) [mm d-1] |
Benchmark Period Mean (complement) [mm d-1] |
Bias [mm d-1] |
RMSE [mm d-1] |
Phase Shift [months] |
Bias Score [1] |
RMSE Score [1] |
Seasonal Cycle Score [1] |
Spatial Distribution Score [1] |
Overall Score [1] |
|||
|---|---|---|---|---|---|---|---|---|---|---|---|---|---|---|---|---|
| Benchmark | [-] | 1.17 | ||||||||||||||
| I123pd | [-] | 0.961 | 1.07 | 1.17 | 0.557 | -0.104 | 0.618 | 1.90 | 0.433 | 0.550 | 0.713 | 0.925 | 0.634 | |||
| post5.4 | [-] | 0.968 | 1.07 | 1.17 | 0.562 | -0.0957 | 0.619 | 1.91 | 0.432 | 0.550 | 0.713 | 0.929 | 0.635 |
Temporally integrated period mean