Mean State
Download Data |
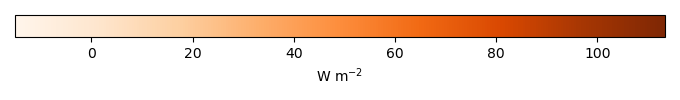
Period Mean (original grids) [W m-2] |
Model Period Mean (intersection) [W m-2] |
Benchmark Period Mean (intersection) [W m-2] |
Model Period Mean (complement) [W m-2] |
Benchmark Period Mean (complement) [W m-2] |
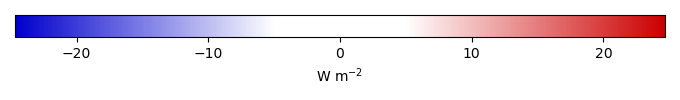
Bias [W m-2] |
RMSE [W m-2] |
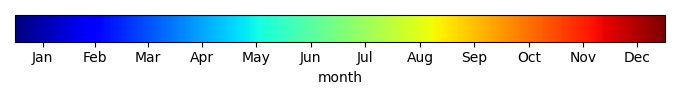
Phase Shift [months] |
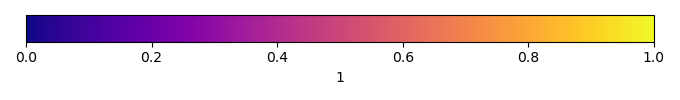
Bias Score [1] |
RMSE Score [1] |
Seasonal Cycle Score [1] |
Spatial Distribution Score [1] |
Overall Score [1] |
|||
|---|---|---|---|---|---|---|---|---|---|---|---|---|---|---|---|---|
| Benchmark | [-] | 66.6 | ||||||||||||||
| I123pd | [-] | 72.1 | 72.8 | 66.6 | 66.6 | 5.87 | 14.7 | 2.18 | 0.630 | 0.651 | 0.648 | 0.996 | 0.715 | |||
| post5.4 | [-] | 72.4 | 73.1 | 66.6 | 66.8 | 6.17 | 15.0 | 2.22 | 0.622 | 0.646 | 0.639 | 0.996 | 0.710 |
Download Data |
Period Mean (original grids) [W m-2] |
Model Period Mean (intersection) [W m-2] |
Benchmark Period Mean (intersection) [W m-2] |
Model Period Mean (complement) [W m-2] |
Benchmark Period Mean (complement) [W m-2] |
Bias [W m-2] |
RMSE [W m-2] |
Phase Shift [months] |
Bias Score [1] |
RMSE Score [1] |
Seasonal Cycle Score [1] |
Spatial Distribution Score [1] |
Overall Score [1] |
|||
|---|---|---|---|---|---|---|---|---|---|---|---|---|---|---|---|---|
| Benchmark | [-] | 46.1 | ||||||||||||||
| I123pd | [-] | 49.0 | 48.3 | 46.1 | 51.2 | 2.23 | 16.6 | 0.801 | 0.592 | 0.504 | 0.913 | 0.929 | 0.689 | |||
| post5.4 | [-] | 49.3 | 48.6 | 46.1 | 51.4 | 2.49 | 16.6 | 0.819 | 0.593 | 0.504 | 0.908 | 0.933 | 0.688 |
Download Data |
Period Mean (original grids) [W m-2] |
Model Period Mean (intersection) [W m-2] |
Benchmark Period Mean (intersection) [W m-2] |
Model Period Mean (complement) [W m-2] |
Benchmark Period Mean (complement) [W m-2] |
Bias [W m-2] |
RMSE [W m-2] |
Phase Shift [months] |
Bias Score [1] |
RMSE Score [1] |
Seasonal Cycle Score [1] |
Spatial Distribution Score [1] |
Overall Score [1] |
|||
|---|---|---|---|---|---|---|---|---|---|---|---|---|---|---|---|---|
| Benchmark | [-] | 48.4 | ||||||||||||||
| I123pd | [-] | 47.8 | 46.6 | 48.4 | 60.0 | -1.76 | 12.6 | 0.899 | 0.669 | 0.691 | 0.897 | 0.990 | 0.788 | |||
| post5.4 | [-] | 48.1 | 46.9 | 48.4 | 60.3 | -1.45 | 12.6 | 0.905 | 0.671 | 0.690 | 0.896 | 0.990 | 0.788 |
Download Data |
Period Mean (original grids) [W m-2] |
Model Period Mean (intersection) [W m-2] |
Benchmark Period Mean (intersection) [W m-2] |
Model Period Mean (complement) [W m-2] |
Benchmark Period Mean (complement) [W m-2] |
Bias [W m-2] |
RMSE [W m-2] |
Phase Shift [months] |
Bias Score [1] |
RMSE Score [1] |
Seasonal Cycle Score [1] |
Spatial Distribution Score [1] |
Overall Score [1] |
|||
|---|---|---|---|---|---|---|---|---|---|---|---|---|---|---|---|---|
| Benchmark | [-] | 14.1 | ||||||||||||||
| I123pd | [-] | 12.9 | 12.9 | 14.1 | 12.9 | -1.25 | 5.80 | 0.358 | 0.710 | 0.644 | 0.976 | 0.989 | 0.793 | |||
| post5.4 | [-] | 13.2 | 13.3 | 14.1 | 13.2 | -0.903 | 5.76 | 0.353 | 0.718 | 0.645 | 0.977 | 0.990 | 0.795 |
Download Data |
Period Mean (original grids) [W m-2] |
Model Period Mean (intersection) [W m-2] |
Benchmark Period Mean (intersection) [W m-2] |
Model Period Mean (complement) [W m-2] |
Benchmark Period Mean (complement) [W m-2] |
Bias [W m-2] |
RMSE [W m-2] |
Phase Shift [months] |
Bias Score [1] |
RMSE Score [1] |
Seasonal Cycle Score [1] |
Spatial Distribution Score [1] |
Overall Score [1] |
|||
|---|---|---|---|---|---|---|---|---|---|---|---|---|---|---|---|---|
| Benchmark | [-] | 89.3 | ||||||||||||||
| I123pd | [-] | 105. | 105. | 89.3 | 103. | 15.9 | 21.1 | 1.78 | 0.420 | 0.791 | 0.738 | 0.846 | 0.718 | |||
| post5.4 | [-] | 105. | 106. | 89.3 | 104. | 16.4 | 21.7 | 1.77 | 0.408 | 0.794 | 0.740 | 0.817 | 0.711 |
Download Data |
Period Mean (original grids) [W m-2] |
Model Period Mean (intersection) [W m-2] |
Benchmark Period Mean (intersection) [W m-2] |
Model Period Mean (complement) [W m-2] |
Benchmark Period Mean (complement) [W m-2] |
Bias [W m-2] |
RMSE [W m-2] |
Phase Shift [months] |
Bias Score [1] |
RMSE Score [1] |
Seasonal Cycle Score [1] |
Spatial Distribution Score [1] |
Overall Score [1] |
|||
|---|---|---|---|---|---|---|---|---|---|---|---|---|---|---|---|---|
| Benchmark | [-] | 24.4 | ||||||||||||||
| I123pd | [-] | 23.3 | 23.2 | 24.4 | 23.6 | -1.19 | 7.76 | 0.728 | 0.725 | 0.598 | 0.947 | 0.925 | 0.758 | |||
| post5.4 | [-] | 23.5 | 23.4 | 24.4 | 23.9 | -0.960 | 7.77 | 0.771 | 0.729 | 0.596 | 0.944 | 0.928 | 0.759 |
Download Data |
Period Mean (original grids) [W m-2] |
Model Period Mean (intersection) [W m-2] |
Benchmark Period Mean (intersection) [W m-2] |
Model Period Mean (complement) [W m-2] |
Benchmark Period Mean (complement) [W m-2] |
Bias [W m-2] |
RMSE [W m-2] |
Phase Shift [months] |
Bias Score [1] |
RMSE Score [1] |
Seasonal Cycle Score [1] |
Spatial Distribution Score [1] |
Overall Score [1] |
|||
|---|---|---|---|---|---|---|---|---|---|---|---|---|---|---|---|---|
| Benchmark | [-] | 25.8 | ||||||||||||||
| I123pd | [-] | 27.8 | 26.8 | 25.8 | 43.9 | 1.37 | 9.98 | 0.635 | 0.678 | 0.644 | 0.943 | 0.970 | 0.776 | |||
| post5.4 | [-] | 27.7 | 26.7 | 25.8 | 43.9 | 1.26 | 10.0 | 0.641 | 0.679 | 0.642 | 0.944 | 0.970 | 0.775 |
Download Data |
Period Mean (original grids) [W m-2] |
Model Period Mean (intersection) [W m-2] |
Benchmark Period Mean (intersection) [W m-2] |
Model Period Mean (complement) [W m-2] |
Benchmark Period Mean (complement) [W m-2] |
Bias [W m-2] |
RMSE [W m-2] |
Phase Shift [months] |
Bias Score [1] |
RMSE Score [1] |
Seasonal Cycle Score [1] |
Spatial Distribution Score [1] |
Overall Score [1] |
|||
|---|---|---|---|---|---|---|---|---|---|---|---|---|---|---|---|---|
| Benchmark | [-] | 54.7 | ||||||||||||||
| I123pd | [-] | 56.8 | 54.8 | 54.7 | 73.9 | 1.23 | 14.1 | 1.10 | 0.680 | 0.625 | 0.875 | 0.983 | 0.758 | |||
| post5.4 | [-] | 56.7 | 54.7 | 54.7 | 74.0 | 1.14 | 14.0 | 1.08 | 0.682 | 0.628 | 0.879 | 0.985 | 0.760 |
Download Data |
Period Mean (original grids) [W m-2] |
Model Period Mean (intersection) [W m-2] |
Benchmark Period Mean (intersection) [W m-2] |
Model Period Mean (complement) [W m-2] |
Benchmark Period Mean (complement) [W m-2] |
Bias [W m-2] |
RMSE [W m-2] |
Phase Shift [months] |
Bias Score [1] |
RMSE Score [1] |
Seasonal Cycle Score [1] |
Spatial Distribution Score [1] |
Overall Score [1] |
|||
|---|---|---|---|---|---|---|---|---|---|---|---|---|---|---|---|---|
| Benchmark | [-] | 13.7 | ||||||||||||||
| I123pd | [-] | 15.0 | 15.3 | 13.7 | 13.7 | 1.38 | 6.22 | 0.346 | 0.734 | 0.624 | 0.977 | 0.917 | 0.775 | |||
| post5.4 | [-] | 15.5 | 15.7 | 13.7 | 14.1 | 1.82 | 6.39 | 0.329 | 0.707 | 0.620 | 0.978 | 0.906 | 0.766 |
Download Data |
Period Mean (original grids) [W m-2] |
Model Period Mean (intersection) [W m-2] |
Benchmark Period Mean (intersection) [W m-2] |
Model Period Mean (complement) [W m-2] |
Benchmark Period Mean (complement) [W m-2] |
Bias [W m-2] |
RMSE [W m-2] |
Phase Shift [months] |
Bias Score [1] |
RMSE Score [1] |
Seasonal Cycle Score [1] |
Spatial Distribution Score [1] |
Overall Score [1] |
|||
|---|---|---|---|---|---|---|---|---|---|---|---|---|---|---|---|---|
| Benchmark | [-] | 25.0 | ||||||||||||||
| I123pd | [-] | 32.1 | 30.8 | 25.0 | 46.7 | 29.8 | 6.67 | 9.84 | 0.565 | 0.602 | 0.756 | 0.944 | 0.984 | 0.808 | ||
| post5.4 | [-] | 32.3 | 30.9 | 25.0 | 47.3 | 29.8 | 6.79 | 9.96 | 0.578 | 0.601 | 0.750 | 0.941 | 0.982 | 0.805 |
Download Data |
Period Mean (original grids) [W m-2] |
Model Period Mean (intersection) [W m-2] |
Benchmark Period Mean (intersection) [W m-2] |
Model Period Mean (complement) [W m-2] |
Benchmark Period Mean (complement) [W m-2] |
Bias [W m-2] |
RMSE [W m-2] |
Phase Shift [months] |
Bias Score [1] |
RMSE Score [1] |
Seasonal Cycle Score [1] |
Spatial Distribution Score [1] |
Overall Score [1] |
|||
|---|---|---|---|---|---|---|---|---|---|---|---|---|---|---|---|---|
| Benchmark | [-] | 31.7 | ||||||||||||||
| I123pd | [-] | 33.6 | 33.7 | 31.7 | 33.4 | 27.9 | 1.98 | 10.3 | 0.240 | 0.735 | 0.613 | 0.984 | 0.993 | 0.787 | ||
| post5.4 | [-] | 33.8 | 33.8 | 31.7 | 33.8 | 27.9 | 2.17 | 10.4 | 0.255 | 0.727 | 0.610 | 0.983 | 0.993 | 0.785 |
Download Data |
Period Mean (original grids) [W m-2] |
Model Period Mean (intersection) [W m-2] |
Benchmark Period Mean (intersection) [W m-2] |
Model Period Mean (complement) [W m-2] |
Benchmark Period Mean (complement) [W m-2] |
Bias [W m-2] |
RMSE [W m-2] |
Phase Shift [months] |
Bias Score [1] |
RMSE Score [1] |
Seasonal Cycle Score [1] |
Spatial Distribution Score [1] |
Overall Score [1] |
|||
|---|---|---|---|---|---|---|---|---|---|---|---|---|---|---|---|---|
| Benchmark | [-] | 31.8 | ||||||||||||||
| I123pd | [-] | 34.2 | 33.3 | 31.8 | 43.9 | 31.0 | 1.74 | 9.58 | 0.947 | 0.672 | 0.681 | 0.887 | 0.987 | 0.781 | ||
| post5.4 | [-] | 34.3 | 33.4 | 31.8 | 44.2 | 31.0 | 1.89 | 9.64 | 0.918 | 0.671 | 0.679 | 0.894 | 0.986 | 0.782 |
Download Data |
Period Mean (original grids) [W m-2] |
Model Period Mean (intersection) [W m-2] |
Benchmark Period Mean (intersection) [W m-2] |
Model Period Mean (complement) [W m-2] |
Benchmark Period Mean (complement) [W m-2] |
Bias [W m-2] |
RMSE [W m-2] |
Phase Shift [months] |
Bias Score [1] |
RMSE Score [1] |
Seasonal Cycle Score [1] |
Spatial Distribution Score [1] |
Overall Score [1] |
|||
|---|---|---|---|---|---|---|---|---|---|---|---|---|---|---|---|---|
| Benchmark | [-] | 5.68 | ||||||||||||||
| I123pd | [-] | 9.66 | 9.30 | 5.68 | 19.8 | 32.8 | 3.88 | 6.64 | 1.35 | 0.746 | 0.791 | 0.804 | 0.870 | 0.801 | ||
| post5.4 | [-] | 9.65 | 9.28 | 5.68 | 19.8 | 32.8 | 3.86 | 6.63 | 1.34 | 0.747 | 0.792 | 0.806 | 0.870 | 0.801 |
Download Data |
Period Mean (original grids) [W m-2] |
Model Period Mean (intersection) [W m-2] |
Benchmark Period Mean (intersection) [W m-2] |
Model Period Mean (complement) [W m-2] |
Benchmark Period Mean (complement) [W m-2] |
Bias [W m-2] |
RMSE [W m-2] |
Phase Shift [months] |
Bias Score [1] |
RMSE Score [1] |
Seasonal Cycle Score [1] |
Spatial Distribution Score [1] |
Overall Score [1] |
|||
|---|---|---|---|---|---|---|---|---|---|---|---|---|---|---|---|---|
| Benchmark | [-] | 13.4 | ||||||||||||||
| I123pd | [-] | 17.4 | 17.5 | 13.4 | 16.3 | 3.73 | 8.17 | 0.485 | 0.550 | 0.566 | 0.968 | 0.860 | 0.702 | |||
| post5.4 | [-] | 17.6 | 17.8 | 13.4 | 16.5 | 3.97 | 8.36 | 0.477 | 0.537 | 0.560 | 0.968 | 0.850 | 0.695 |
Download Data |
Period Mean (original grids) [W m-2] |
Model Period Mean (intersection) [W m-2] |
Benchmark Period Mean (intersection) [W m-2] |
Model Period Mean (complement) [W m-2] |
Benchmark Period Mean (complement) [W m-2] |
Bias [W m-2] |
RMSE [W m-2] |
Phase Shift [months] |
Bias Score [1] |
RMSE Score [1] |
Seasonal Cycle Score [1] |
Spatial Distribution Score [1] |
Overall Score [1] |
|||
|---|---|---|---|---|---|---|---|---|---|---|---|---|---|---|---|---|
| Benchmark | [-] | 51.8 | ||||||||||||||
| I123pd | [-] | 58.4 | 55.0 | 51.8 | 72.0 | 52.2 | 5.19 | 14.0 | 1.17 | 0.588 | 0.703 | 0.855 | 0.959 | 0.761 | ||
| post5.4 | [-] | 58.6 | 55.2 | 51.8 | 72.5 | 52.2 | 5.45 | 14.2 | 1.17 | 0.584 | 0.697 | 0.855 | 0.956 | 0.758 |
Download Data |
Period Mean (original grids) [W m-2] |
Model Period Mean (intersection) [W m-2] |
Benchmark Period Mean (intersection) [W m-2] |
Model Period Mean (complement) [W m-2] |
Benchmark Period Mean (complement) [W m-2] |
Bias [W m-2] |
RMSE [W m-2] |
Phase Shift [months] |
Bias Score [1] |
RMSE Score [1] |
Seasonal Cycle Score [1] |
Spatial Distribution Score [1] |
Overall Score [1] |
|||
|---|---|---|---|---|---|---|---|---|---|---|---|---|---|---|---|---|
| Benchmark | [-] | 51.0 | ||||||||||||||
| I123pd | [-] | 47.6 | 47.4 | 51.0 | 49.8 | -3.31 | 11.2 | 0.775 | 0.718 | 0.613 | 0.948 | 0.869 | 0.752 | |||
| post5.4 | [-] | 47.3 | 47.0 | 51.0 | 50.0 | -3.67 | 11.7 | 0.812 | 0.698 | 0.592 | 0.946 | 0.916 | 0.749 |
Download Data |
Period Mean (original grids) [W m-2] |
Model Period Mean (intersection) [W m-2] |
Benchmark Period Mean (intersection) [W m-2] |
Model Period Mean (complement) [W m-2] |
Benchmark Period Mean (complement) [W m-2] |
Bias [W m-2] |
RMSE [W m-2] |
Phase Shift [months] |
Bias Score [1] |
RMSE Score [1] |
Seasonal Cycle Score [1] |
Spatial Distribution Score [1] |
Overall Score [1] |
|||
|---|---|---|---|---|---|---|---|---|---|---|---|---|---|---|---|---|
| Benchmark | [-] | 25.2 | ||||||||||||||
| I123pd | [-] | 30.6 | 29.9 | 25.2 | 35.3 | 4.82 | 9.02 | 0.615 | 0.629 | 0.658 | 0.958 | 0.978 | 0.776 | |||
| post5.4 | [-] | 30.5 | 29.7 | 25.2 | 35.5 | 4.70 | 8.83 | 0.746 | 0.636 | 0.667 | 0.949 | 0.974 | 0.779 |
Download Data |
Period Mean (original grids) [W m-2] |
Model Period Mean (intersection) [W m-2] |
Benchmark Period Mean (intersection) [W m-2] |
Model Period Mean (complement) [W m-2] |
Benchmark Period Mean (complement) [W m-2] |
Bias [W m-2] |
RMSE [W m-2] |
Phase Shift [months] |
Bias Score [1] |
RMSE Score [1] |
Seasonal Cycle Score [1] |
Spatial Distribution Score [1] |
Overall Score [1] |
|||
|---|---|---|---|---|---|---|---|---|---|---|---|---|---|---|---|---|
| Benchmark | [-] | 24.5 | ||||||||||||||
| I123pd | [-] | 26.3 | 26.5 | 24.5 | 33.4 | 2.23 | 8.69 | 0.677 | 0.747 | 0.687 | 0.939 | 0.992 | 0.810 | |||
| post5.4 | [-] | 26.2 | 26.5 | 24.5 | 33.5 | 2.14 | 8.67 | 0.635 | 0.747 | 0.688 | 0.943 | 0.991 | 0.812 |
Download Data |
Period Mean (original grids) [W m-2] |
Model Period Mean (intersection) [W m-2] |
Benchmark Period Mean (intersection) [W m-2] |
Model Period Mean (complement) [W m-2] |
Benchmark Period Mean (complement) [W m-2] |
Bias [W m-2] |
RMSE [W m-2] |
Phase Shift [months] |
Bias Score [1] |
RMSE Score [1] |
Seasonal Cycle Score [1] |
Spatial Distribution Score [1] |
Overall Score [1] |
|||
|---|---|---|---|---|---|---|---|---|---|---|---|---|---|---|---|---|
| Benchmark | [-] | 87.1 | ||||||||||||||
| I123pd | [-] | 90.6 | 90.7 | 87.1 | 89.4 | 3.61 | 12.6 | 1.36 | 0.635 | 0.795 | 0.809 | 0.749 | 0.757 | |||
| post5.4 | [-] | 91.2 | 91.3 | 87.1 | 89.9 | 4.18 | 12.8 | 1.38 | 0.635 | 0.792 | 0.806 | 0.744 | 0.754 |
Download Data |
Period Mean (original grids) [W m-2] |
Model Period Mean (intersection) [W m-2] |
Benchmark Period Mean (intersection) [W m-2] |
Model Period Mean (complement) [W m-2] |
Benchmark Period Mean (complement) [W m-2] |
Bias [W m-2] |
RMSE [W m-2] |
Phase Shift [months] |
Bias Score [1] |
RMSE Score [1] |
Seasonal Cycle Score [1] |
Spatial Distribution Score [1] |
Overall Score [1] |
|||
|---|---|---|---|---|---|---|---|---|---|---|---|---|---|---|---|---|
| Benchmark | [-] | 63.7 | ||||||||||||||
| I123pd | [-] | 60.7 | 60.5 | 63.7 | 60.5 | -3.24 | 10.4 | 0.838 | 0.700 | 0.772 | 0.918 | 0.982 | 0.829 | |||
| post5.4 | [-] | 61.4 | 61.1 | 63.7 | 61.3 | -2.64 | 10.3 | 0.847 | 0.707 | 0.770 | 0.915 | 0.980 | 0.828 |
Download Data |
Period Mean (original grids) [W m-2] |
Model Period Mean (intersection) [W m-2] |
Benchmark Period Mean (intersection) [W m-2] |
Model Period Mean (complement) [W m-2] |
Benchmark Period Mean (complement) [W m-2] |
Bias [W m-2] |
RMSE [W m-2] |
Phase Shift [months] |
Bias Score [1] |
RMSE Score [1] |
Seasonal Cycle Score [1] |
Spatial Distribution Score [1] |
Overall Score [1] |
|||
|---|---|---|---|---|---|---|---|---|---|---|---|---|---|---|---|---|
| Benchmark | [-] | 23.4 | ||||||||||||||
| I123pd | [-] | 27.9 | 28.0 | 23.4 | 26.9 | 4.40 | 11.3 | 0.543 | 0.582 | 0.694 | 0.946 | 0.929 | 0.769 | |||
| post5.4 | [-] | 28.2 | 28.2 | 23.4 | 27.3 | 4.59 | 11.4 | 0.533 | 0.580 | 0.689 | 0.948 | 0.925 | 0.766 |
Temporally integrated period mean