Mean State
Download Data |
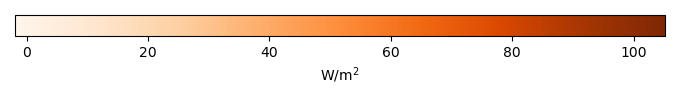
Period Mean (original grids) [W/m2] |
Model Period Mean (intersection) [W/m2] |
Benchmark Period Mean (intersection) [W/m2] |
Model Period Mean (complement) [W/m2] |
Benchmark Period Mean (complement) [W/m2] |
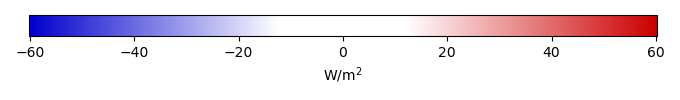
Bias [W/m2] |
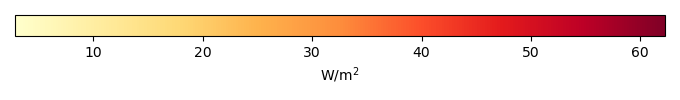
RMSE [W/m2] |
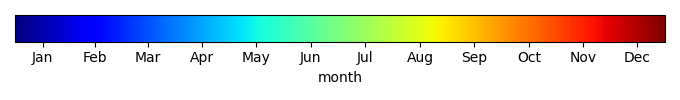
Phase Shift [months] |
Bias Score [1] |
RMSE Score [1] |
Seasonal Cycle Score [1] |
Spatial Distribution Score [1] |
Overall Score [1] |
|||
|---|---|---|---|---|---|---|---|---|---|---|---|---|---|---|---|---|
| Benchmark | [-] | 70.9 | ||||||||||||||
| I123pd | [-] | 71.9 | 72.4 | 70.9 | 63.7 | 0.878 | 15.9 | 2.43 | 0.633 | 0.631 | 0.607 | 0.990 | 0.698 | |||
| post5.4 | [-] | 72.2 | 72.7 | 70.9 | 63.9 | 1.17 | 16.1 | 2.41 | 0.631 | 0.625 | 0.610 | 0.991 | 0.697 |
Download Data |
Period Mean (original grids) [W/m2] |
Model Period Mean (intersection) [W/m2] |
Benchmark Period Mean (intersection) [W/m2] |
Model Period Mean (complement) [W/m2] |
Benchmark Period Mean (complement) [W/m2] |
Bias [W/m2] |
RMSE [W/m2] |
Phase Shift [months] |
Bias Score [1] |
RMSE Score [1] |
Seasonal Cycle Score [1] |
Spatial Distribution Score [1] |
Overall Score [1] |
|||
|---|---|---|---|---|---|---|---|---|---|---|---|---|---|---|---|---|
| Benchmark | [-] | 48.1 | ||||||||||||||
| I123pd | [-] | 48.6 | 48.0 | 48.1 | 44.9 | -0.237 | 19.9 | 0.994 | 0.522 | 0.423 | 0.867 | 0.886 | 0.624 | |||
| post5.4 | [-] | 49.0 | 48.4 | 48.1 | 45.2 | 0.122 | 19.9 | 1.01 | 0.525 | 0.421 | 0.866 | 0.891 | 0.625 |
Download Data |
Period Mean (original grids) [W/m2] |
Model Period Mean (intersection) [W/m2] |
Benchmark Period Mean (intersection) [W/m2] |
Model Period Mean (complement) [W/m2] |
Benchmark Period Mean (complement) [W/m2] |
Bias [W/m2] |
RMSE [W/m2] |
Phase Shift [months] |
Bias Score [1] |
RMSE Score [1] |
Seasonal Cycle Score [1] |
Spatial Distribution Score [1] |
Overall Score [1] |
|||
|---|---|---|---|---|---|---|---|---|---|---|---|---|---|---|---|---|
| Benchmark | [-] | 52.1 | ||||||||||||||
| I123pd | [-] | 46.7 | 46.4 | 52.1 | 52.5 | 18.9 | -5.48 | 17.1 | 1.08 | 0.495 | 0.673 | 0.865 | 0.958 | 0.733 | ||
| post5.4 | [-] | 47.0 | 46.7 | 52.1 | 52.7 | 18.9 | -5.15 | 17.1 | 1.07 | 0.501 | 0.671 | 0.866 | 0.960 | 0.734 |
Download Data |
Period Mean (original grids) [W/m2] |
Model Period Mean (intersection) [W/m2] |
Benchmark Period Mean (intersection) [W/m2] |
Model Period Mean (complement) [W/m2] |
Benchmark Period Mean (complement) [W/m2] |
Bias [W/m2] |
RMSE [W/m2] |
Phase Shift [months] |
Bias Score [1] |
RMSE Score [1] |
Seasonal Cycle Score [1] |
Spatial Distribution Score [1] |
Overall Score [1] |
|||
|---|---|---|---|---|---|---|---|---|---|---|---|---|---|---|---|---|
| Benchmark | [-] | 15.0 | ||||||||||||||
| I123pd | [-] | 12.7 | 12.7 | 15.0 | 12.7 | -2.20 | 8.31 | 0.444 | 0.484 | 0.560 | 0.966 | 0.354 | 0.585 | |||
| post5.4 | [-] | 13.0 | 13.0 | 15.0 | 13.0 | -1.89 | 8.16 | 0.403 | 0.508 | 0.565 | 0.969 | 0.366 | 0.594 |
Download Data |
Period Mean (original grids) [W/m2] |
Model Period Mean (intersection) [W/m2] |
Benchmark Period Mean (intersection) [W/m2] |
Model Period Mean (complement) [W/m2] |
Benchmark Period Mean (complement) [W/m2] |
Bias [W/m2] |
RMSE [W/m2] |
Phase Shift [months] |
Bias Score [1] |
RMSE Score [1] |
Seasonal Cycle Score [1] |
Spatial Distribution Score [1] |
Overall Score [1] |
|||
|---|---|---|---|---|---|---|---|---|---|---|---|---|---|---|---|---|
| Benchmark | [-] | 77.7 | ||||||||||||||
| I123pd | [-] | 104. | 104. | 77.9 | 104. | 29.4 | 26.4 | 34.0 | 2.55 | 0.291 | 0.775 | 0.601 | 0.599 | 0.608 | ||
| post5.4 | [-] | 105. | 105. | 77.9 | 104. | 29.4 | 26.9 | 34.5 | 2.53 | 0.284 | 0.778 | 0.605 | 0.627 | 0.614 |
Download Data |
Period Mean (original grids) [W/m2] |
Model Period Mean (intersection) [W/m2] |
Benchmark Period Mean (intersection) [W/m2] |
Model Period Mean (complement) [W/m2] |
Benchmark Period Mean (complement) [W/m2] |
Bias [W/m2] |
RMSE [W/m2] |
Phase Shift [months] |
Bias Score [1] |
RMSE Score [1] |
Seasonal Cycle Score [1] |
Spatial Distribution Score [1] |
Overall Score [1] |
|||
|---|---|---|---|---|---|---|---|---|---|---|---|---|---|---|---|---|
| Benchmark | [-] | 26.4 | ||||||||||||||
| I123pd | [-] | 23.3 | 23.2 | 26.4 | 24.8 | -27.5 | -3.22 | 9.22 | 0.671 | 0.588 | 0.559 | 0.951 | 0.986 | 0.728 | ||
| post5.4 | [-] | 23.5 | 23.4 | 26.4 | 25.3 | -27.5 | -3.02 | 9.22 | 0.716 | 0.601 | 0.555 | 0.948 | 0.984 | 0.729 |
Download Data |
Period Mean (original grids) [W/m2] |
Model Period Mean (intersection) [W/m2] |
Benchmark Period Mean (intersection) [W/m2] |
Model Period Mean (complement) [W/m2] |
Benchmark Period Mean (complement) [W/m2] |
Bias [W/m2] |
RMSE [W/m2] |
Phase Shift [months] |
Bias Score [1] |
RMSE Score [1] |
Seasonal Cycle Score [1] |
Spatial Distribution Score [1] |
Overall Score [1] |
|||
|---|---|---|---|---|---|---|---|---|---|---|---|---|---|---|---|---|
| Benchmark | [-] | 28.2 | ||||||||||||||
| I123pd | [-] | 27.7 | 27.6 | 28.2 | 30.1 | 0.0374 | 12.2 | 0.723 | 0.577 | 0.620 | 0.926 | 0.910 | 0.731 | |||
| post5.4 | [-] | 27.6 | 27.4 | 28.2 | 30.2 | -0.115 | 12.3 | 0.704 | 0.571 | 0.616 | 0.931 | 0.909 | 0.729 |
Download Data |
Period Mean (original grids) [W/m2] |
Model Period Mean (intersection) [W/m2] |
Benchmark Period Mean (intersection) [W/m2] |
Model Period Mean (complement) [W/m2] |
Benchmark Period Mean (complement) [W/m2] |
Bias [W/m2] |
RMSE [W/m2] |
Phase Shift [months] |
Bias Score [1] |
RMSE Score [1] |
Seasonal Cycle Score [1] |
Spatial Distribution Score [1] |
Overall Score [1] |
|||
|---|---|---|---|---|---|---|---|---|---|---|---|---|---|---|---|---|
| Benchmark | [-] | 57.4 | ||||||||||||||
| I123pd | [-] | 57.0 | 56.3 | 57.4 | 71.7 | 27.2 | 1.30 | 20.0 | 1.04 | 0.523 | 0.587 | 0.882 | 0.950 | 0.706 | ||
| post5.4 | [-] | 57.0 | 56.2 | 57.4 | 71.7 | 27.2 | 1.27 | 20.0 | 1.02 | 0.521 | 0.589 | 0.885 | 0.952 | 0.707 |
Download Data |
Period Mean (original grids) [W/m2] |
Model Period Mean (intersection) [W/m2] |
Benchmark Period Mean (intersection) [W/m2] |
Model Period Mean (complement) [W/m2] |
Benchmark Period Mean (complement) [W/m2] |
Bias [W/m2] |
RMSE [W/m2] |
Phase Shift [months] |
Bias Score [1] |
RMSE Score [1] |
Seasonal Cycle Score [1] |
Spatial Distribution Score [1] |
Overall Score [1] |
|||
|---|---|---|---|---|---|---|---|---|---|---|---|---|---|---|---|---|
| Benchmark | [-] | 15.7 | ||||||||||||||
| I123pd | [-] | 15.0 | 15.2 | 15.7 | 11.8 | 0.110 | -0.636 | 8.34 | 0.236 | 0.605 | 0.532 | 0.982 | 0.617 | 0.653 | ||
| post5.4 | [-] | 15.4 | 15.6 | 15.7 | 12.2 | 0.110 | -0.219 | 8.23 | 0.220 | 0.626 | 0.537 | 0.983 | 0.635 | 0.663 |
Download Data |
Period Mean (original grids) [W/m2] |
Model Period Mean (intersection) [W/m2] |
Benchmark Period Mean (intersection) [W/m2] |
Model Period Mean (complement) [W/m2] |
Benchmark Period Mean (complement) [W/m2] |
Bias [W/m2] |
RMSE [W/m2] |
Phase Shift [months] |
Bias Score [1] |
RMSE Score [1] |
Seasonal Cycle Score [1] |
Spatial Distribution Score [1] |
Overall Score [1] |
|||
|---|---|---|---|---|---|---|---|---|---|---|---|---|---|---|---|---|
| Benchmark | [-] | 27.0 | ||||||||||||||
| I123pd | [-] | 32.5 | 31.9 | 27.0 | 42.9 | 9.96 | 6.71 | 11.7 | 0.655 | 0.620 | 0.720 | 0.931 | 0.951 | 0.789 | ||
| post5.4 | [-] | 32.6 | 32.0 | 27.0 | 43.5 | 9.96 | 6.85 | 11.9 | 0.678 | 0.619 | 0.712 | 0.928 | 0.947 | 0.784 |
Download Data |
Period Mean (original grids) [W/m2] |
Model Period Mean (intersection) [W/m2] |
Benchmark Period Mean (intersection) [W/m2] |
Model Period Mean (complement) [W/m2] |
Benchmark Period Mean (complement) [W/m2] |
Bias [W/m2] |
RMSE [W/m2] |
Phase Shift [months] |
Bias Score [1] |
RMSE Score [1] |
Seasonal Cycle Score [1] |
Spatial Distribution Score [1] |
Overall Score [1] |
|||
|---|---|---|---|---|---|---|---|---|---|---|---|---|---|---|---|---|
| Benchmark | [-] | 31.5 | ||||||||||||||
| I123pd | [-] | 32.8 | 32.7 | 31.5 | 33.5 | 17.5 | 1.29 | 13.8 | 0.345 | 0.578 | 0.561 | 0.974 | 0.734 | 0.682 | ||
| post5.4 | [-] | 32.9 | 32.9 | 31.5 | 33.8 | 17.5 | 1.48 | 13.9 | 0.391 | 0.579 | 0.560 | 0.970 | 0.741 | 0.682 |
Download Data |
Period Mean (original grids) [W/m2] |
Model Period Mean (intersection) [W/m2] |
Benchmark Period Mean (intersection) [W/m2] |
Model Period Mean (complement) [W/m2] |
Benchmark Period Mean (complement) [W/m2] |
Bias [W/m2] |
RMSE [W/m2] |
Phase Shift [months] |
Bias Score [1] |
RMSE Score [1] |
Seasonal Cycle Score [1] |
Spatial Distribution Score [1] |
Overall Score [1] |
|||
|---|---|---|---|---|---|---|---|---|---|---|---|---|---|---|---|---|
| Benchmark | [-] | 39.5 | ||||||||||||||
| I123pd | [-] | 34.0 | 40.2 | 39.5 | 8.62 | 17.2 | 1.22 | 14.2 | 0.973 | 0.548 | 0.622 | 0.883 | 0.968 | 0.729 | ||
| post5.4 | [-] | 34.2 | 40.3 | 39.5 | 8.78 | 17.2 | 1.37 | 14.3 | 0.979 | 0.548 | 0.619 | 0.884 | 0.968 | 0.727 |
Download Data |
Period Mean (original grids) [W/m2] |
Model Period Mean (intersection) [W/m2] |
Benchmark Period Mean (intersection) [W/m2] |
Model Period Mean (complement) [W/m2] |
Benchmark Period Mean (complement) [W/m2] |
Bias [W/m2] |
RMSE [W/m2] |
Phase Shift [months] |
Bias Score [1] |
RMSE Score [1] |
Seasonal Cycle Score [1] |
Spatial Distribution Score [1] |
Overall Score [1] |
|||
|---|---|---|---|---|---|---|---|---|---|---|---|---|---|---|---|---|
| Benchmark | [-] | 8.51 | ||||||||||||||
| I123pd | [-] | 9.99 | 16.5 | 8.51 | 4.28 | 3.71 | 8.44 | 13.5 | 1.12 | 0.494 | 0.597 | 0.857 | 0.931 | 0.695 | ||
| post5.4 | [-] | 9.96 | 16.5 | 8.51 | 4.27 | 3.71 | 8.40 | 13.5 | 1.12 | 0.496 | 0.597 | 0.858 | 0.931 | 0.696 |
Download Data |
Period Mean (original grids) [W/m2] |
Model Period Mean (intersection) [W/m2] |
Benchmark Period Mean (intersection) [W/m2] |
Model Period Mean (complement) [W/m2] |
Benchmark Period Mean (complement) [W/m2] |
Bias [W/m2] |
RMSE [W/m2] |
Phase Shift [months] |
Bias Score [1] |
RMSE Score [1] |
Seasonal Cycle Score [1] |
Spatial Distribution Score [1] |
Overall Score [1] |
|||
|---|---|---|---|---|---|---|---|---|---|---|---|---|---|---|---|---|
| Benchmark | [-] | 14.0 | ||||||||||||||
| I123pd | [-] | 17.4 | 17.6 | 14.0 | 12.1 | 3.20 | 9.60 | 0.585 | 0.551 | 0.505 | 0.958 | 0.892 | 0.682 | |||
| post5.4 | [-] | 17.6 | 17.9 | 14.0 | 12.3 | 3.44 | 9.74 | 0.586 | 0.545 | 0.500 | 0.957 | 0.898 | 0.680 |
Download Data |
Period Mean (original grids) [W/m2] |
Model Period Mean (intersection) [W/m2] |
Benchmark Period Mean (intersection) [W/m2] |
Model Period Mean (complement) [W/m2] |
Benchmark Period Mean (complement) [W/m2] |
Bias [W/m2] |
RMSE [W/m2] |
Phase Shift [months] |
Bias Score [1] |
RMSE Score [1] |
Seasonal Cycle Score [1] |
Spatial Distribution Score [1] |
Overall Score [1] |
|||
|---|---|---|---|---|---|---|---|---|---|---|---|---|---|---|---|---|
| Benchmark | [-] | 50.5 | ||||||||||||||
| I123pd | [-] | 57.9 | 56.5 | 50.6 | 69.5 | 19.0 | 8.66 | 19.9 | 1.03 | 0.514 | 0.669 | 0.883 | 0.948 | 0.736 | ||
| post5.4 | [-] | 58.1 | 56.7 | 50.6 | 69.9 | 19.0 | 8.87 | 20.2 | 1.02 | 0.511 | 0.661 | 0.884 | 0.946 | 0.733 |
Download Data |
Period Mean (original grids) [W/m2] |
Model Period Mean (intersection) [W/m2] |
Benchmark Period Mean (intersection) [W/m2] |
Model Period Mean (complement) [W/m2] |
Benchmark Period Mean (complement) [W/m2] |
Bias [W/m2] |
RMSE [W/m2] |
Phase Shift [months] |
Bias Score [1] |
RMSE Score [1] |
Seasonal Cycle Score [1] |
Spatial Distribution Score [1] |
Overall Score [1] |
|||
|---|---|---|---|---|---|---|---|---|---|---|---|---|---|---|---|---|
| Benchmark | [-] | 49.8 | ||||||||||||||
| I123pd | [-] | 47.8 | 47.7 | 49.8 | 53.2 | 2.15 | -1.95 | 14.0 | 0.840 | 0.596 | 0.574 | 0.943 | 0.684 | 0.674 | ||
| post5.4 | [-] | 47.3 | 47.2 | 49.8 | 53.6 | 2.15 | -2.37 | 14.8 | 0.868 | 0.567 | 0.548 | 0.942 | 0.739 | 0.669 |
Download Data |
Period Mean (original grids) [W/m2] |
Model Period Mean (intersection) [W/m2] |
Benchmark Period Mean (intersection) [W/m2] |
Model Period Mean (complement) [W/m2] |
Benchmark Period Mean (complement) [W/m2] |
Bias [W/m2] |
RMSE [W/m2] |
Phase Shift [months] |
Bias Score [1] |
RMSE Score [1] |
Seasonal Cycle Score [1] |
Spatial Distribution Score [1] |
Overall Score [1] |
|||
|---|---|---|---|---|---|---|---|---|---|---|---|---|---|---|---|---|
| Benchmark | [-] | 25.3 | ||||||||||||||
| I123pd | [-] | 31.0 | 30.9 | 25.3 | 40.6 | 5.99 | 10.8 | 0.677 | 0.616 | 0.640 | 0.951 | 0.973 | 0.764 | |||
| post5.4 | [-] | 30.8 | 30.7 | 25.3 | 40.9 | 5.82 | 11.0 | 0.776 | 0.605 | 0.638 | 0.943 | 0.972 | 0.759 |
Download Data |
Period Mean (original grids) [W/m2] |
Model Period Mean (intersection) [W/m2] |
Benchmark Period Mean (intersection) [W/m2] |
Model Period Mean (complement) [W/m2] |
Benchmark Period Mean (complement) [W/m2] |
Bias [W/m2] |
RMSE [W/m2] |
Phase Shift [months] |
Bias Score [1] |
RMSE Score [1] |
Seasonal Cycle Score [1] |
Spatial Distribution Score [1] |
Overall Score [1] |
|||
|---|---|---|---|---|---|---|---|---|---|---|---|---|---|---|---|---|
| Benchmark | [-] | 27.3 | ||||||||||||||
| I123pd | [-] | 27.4 | 27.7 | 27.3 | 40.1 | 0.790 | 9.65 | 0.699 | 0.708 | 0.669 | 0.935 | 0.979 | 0.792 | |||
| post5.4 | [-] | 27.5 | 27.7 | 27.3 | 40.9 | 0.842 | 9.77 | 0.685 | 0.704 | 0.665 | 0.935 | 0.980 | 0.790 |
Download Data |
Period Mean (original grids) [W/m2] |
Model Period Mean (intersection) [W/m2] |
Benchmark Period Mean (intersection) [W/m2] |
Model Period Mean (complement) [W/m2] |
Benchmark Period Mean (complement) [W/m2] |
Bias [W/m2] |
RMSE [W/m2] |
Phase Shift [months] |
Bias Score [1] |
RMSE Score [1] |
Seasonal Cycle Score [1] |
Spatial Distribution Score [1] |
Overall Score [1] |
|||
|---|---|---|---|---|---|---|---|---|---|---|---|---|---|---|---|---|
| Benchmark | [-] | 90.2 | ||||||||||||||
| I123pd | [-] | 89.5 | 89.6 | 90.2 | 89.0 | -0.699 | 17.1 | 2.20 | 0.484 | 0.754 | 0.668 | 0.987 | 0.729 | |||
| post5.4 | [-] | 90.1 | 90.2 | 90.2 | 89.5 | -0.140 | 17.1 | 2.22 | 0.489 | 0.751 | 0.664 | 0.987 | 0.728 |
Download Data |
Period Mean (original grids) [W/m2] |
Model Period Mean (intersection) [W/m2] |
Benchmark Period Mean (intersection) [W/m2] |
Model Period Mean (complement) [W/m2] |
Benchmark Period Mean (complement) [W/m2] |
Bias [W/m2] |
RMSE [W/m2] |
Phase Shift [months] |
Bias Score [1] |
RMSE Score [1] |
Seasonal Cycle Score [1] |
Spatial Distribution Score [1] |
Overall Score [1] |
|||
|---|---|---|---|---|---|---|---|---|---|---|---|---|---|---|---|---|
| Benchmark | [-] | 69.7 | ||||||||||||||
| I123pd | [-] | 59.9 | 59.6 | 69.7 | 61.1 | 9.66 | -10.1 | 16.0 | 0.980 | 0.477 | 0.737 | 0.893 | 0.981 | 0.765 | ||
| post5.4 | [-] | 60.3 | 59.9 | 69.7 | 61.8 | 9.66 | -9.77 | 16.0 | 0.964 | 0.486 | 0.733 | 0.896 | 0.984 | 0.767 |
Download Data |
Period Mean (original grids) [W/m2] |
Model Period Mean (intersection) [W/m2] |
Benchmark Period Mean (intersection) [W/m2] |
Model Period Mean (complement) [W/m2] |
Benchmark Period Mean (complement) [W/m2] |
Bias [W/m2] |
RMSE [W/m2] |
Phase Shift [months] |
Bias Score [1] |
RMSE Score [1] |
Seasonal Cycle Score [1] |
Spatial Distribution Score [1] |
Overall Score [1] |
|||
|---|---|---|---|---|---|---|---|---|---|---|---|---|---|---|---|---|
| Benchmark | [-] | 22.7 | ||||||||||||||
| I123pd | [-] | 27.9 | 28.3 | 22.7 | 20.8 | 6.72 | 5.33 | 13.1 | 0.674 | 0.514 | 0.677 | 0.929 | 0.927 | 0.745 | ||
| post5.4 | [-] | 28.1 | 28.5 | 22.7 | 21.1 | 6.72 | 5.57 | 13.3 | 0.692 | 0.512 | 0.671 | 0.927 | 0.922 | 0.741 |
Temporally integrated period mean