Mean State
Download Data |
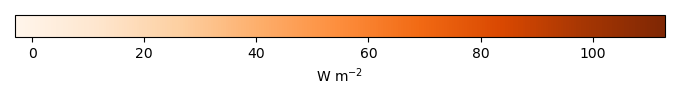
Period Mean (original grids) [W m-2] |
Model Period Mean (intersection) [W m-2] |
Benchmark Period Mean (intersection) [W m-2] |
Model Period Mean (complement) [W m-2] |
Benchmark Period Mean (complement) [W m-2] |
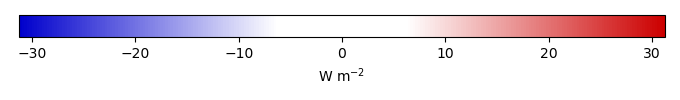
Bias [W m-2] |
RMSE [W m-2] |
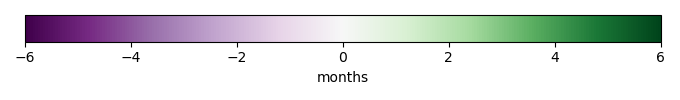
Phase Shift [months] |
Bias Score [1] |
RMSE Score [1] |
Seasonal Cycle Score [1] |
Spatial Distribution Score [1] |
Overall Score [1] |
|||
|---|---|---|---|---|---|---|---|---|---|---|---|---|---|---|---|---|
| Benchmark | [-] | 65.9 | ||||||||||||||
| I123pd | [-] | 72.6 | 73.3 | 65.9 | 61.8 | 6.46 | 15.6 | 2.43 | 0.564 | 0.657 | 0.604 | 0.977 | 0.692 | |||
| post5.4 | [-] | 72.9 | 73.6 | 65.9 | 62.0 | 6.73 | 15.9 | 2.49 | 0.556 | 0.654 | 0.596 | 0.976 | 0.687 |
Download Data |
Period Mean (original grids) [W m-2] |
Model Period Mean (intersection) [W m-2] |
Benchmark Period Mean (intersection) [W m-2] |
Model Period Mean (complement) [W m-2] |
Benchmark Period Mean (complement) [W m-2] |
Bias [W m-2] |
RMSE [W m-2] |
Phase Shift [months] |
Bias Score [1] |
RMSE Score [1] |
Seasonal Cycle Score [1] |
Spatial Distribution Score [1] |
Overall Score [1] |
|||
|---|---|---|---|---|---|---|---|---|---|---|---|---|---|---|---|---|
| Benchmark | [-] | 47.3 | ||||||||||||||
| I123pd | [-] | 50.0 | 49.4 | 47.3 | 49.8 | 3.19 | 16.9 | 1.07 | 0.612 | 0.480 | 0.844 | 0.962 | 0.676 | |||
| post5.4 | [-] | 50.2 | 49.6 | 47.3 | 49.9 | 3.41 | 16.8 | 1.08 | 0.612 | 0.481 | 0.842 | 0.964 | 0.676 |
Download Data |
Period Mean (original grids) [W m-2] |
Model Period Mean (intersection) [W m-2] |
Benchmark Period Mean (intersection) [W m-2] |
Model Period Mean (complement) [W m-2] |
Benchmark Period Mean (complement) [W m-2] |
Bias [W m-2] |
RMSE [W m-2] |
Phase Shift [months] |
Bias Score [1] |
RMSE Score [1] |
Seasonal Cycle Score [1] |
Spatial Distribution Score [1] |
Overall Score [1] |
|||
|---|---|---|---|---|---|---|---|---|---|---|---|---|---|---|---|---|
| Benchmark | [-] | 52.2 | ||||||||||||||
| I123pd | [-] | 47.5 | 46.7 | 52.2 | 59.8 | 55.3 | -5.26 | 15.9 | 1.00 | 0.564 | 0.599 | 0.871 | 0.949 | 0.716 | ||
| post5.4 | [-] | 47.7 | 47.0 | 52.2 | 60.1 | 55.3 | -4.97 | 15.8 | 1.00 | 0.566 | 0.601 | 0.872 | 0.944 | 0.717 |
Download Data |
Period Mean (original grids) [W m-2] |
Model Period Mean (intersection) [W m-2] |
Benchmark Period Mean (intersection) [W m-2] |
Model Period Mean (complement) [W m-2] |
Benchmark Period Mean (complement) [W m-2] |
Bias [W m-2] |
RMSE [W m-2] |
Phase Shift [months] |
Bias Score [1] |
RMSE Score [1] |
Seasonal Cycle Score [1] |
Spatial Distribution Score [1] |
Overall Score [1] |
|||
|---|---|---|---|---|---|---|---|---|---|---|---|---|---|---|---|---|
| Benchmark | [-] | 16.2 | ||||||||||||||
| I123pd | [-] | 13.4 | 13.5 | 16.2 | 13.4 | -2.70 | 9.35 | 0.548 | 0.504 | 0.456 | 0.963 | 0.904 | 0.657 | |||
| post5.4 | [-] | 13.8 | 13.8 | 16.2 | 13.8 | -2.36 | 9.16 | 0.555 | 0.512 | 0.464 | 0.962 | 0.908 | 0.662 |
Download Data |
Period Mean (original grids) [W m-2] |
Model Period Mean (intersection) [W m-2] |
Benchmark Period Mean (intersection) [W m-2] |
Model Period Mean (complement) [W m-2] |
Benchmark Period Mean (complement) [W m-2] |
Bias [W m-2] |
RMSE [W m-2] |
Phase Shift [months] |
Bias Score [1] |
RMSE Score [1] |
Seasonal Cycle Score [1] |
Spatial Distribution Score [1] |
Overall Score [1] |
|||
|---|---|---|---|---|---|---|---|---|---|---|---|---|---|---|---|---|
| Benchmark | [-] | 86.9 | ||||||||||||||
| I123pd | [-] | 106. | 107. | 86.9 | 105. | 19.5 | 25.0 | 2.56 | 0.367 | 0.771 | 0.585 | 0.941 | 0.687 | |||
| post5.4 | [-] | 107. | 107. | 86.9 | 105. | 20.0 | 25.5 | 2.51 | 0.356 | 0.777 | 0.594 | 0.924 | 0.686 |
Download Data |
Period Mean (original grids) [W m-2] |
Model Period Mean (intersection) [W m-2] |
Benchmark Period Mean (intersection) [W m-2] |
Model Period Mean (complement) [W m-2] |
Benchmark Period Mean (complement) [W m-2] |
Bias [W m-2] |
RMSE [W m-2] |
Phase Shift [months] |
Bias Score [1] |
RMSE Score [1] |
Seasonal Cycle Score [1] |
Spatial Distribution Score [1] |
Overall Score [1] |
|||
|---|---|---|---|---|---|---|---|---|---|---|---|---|---|---|---|---|
| Benchmark | [-] | 28.6 | ||||||||||||||
| I123pd | [-] | 23.5 | 23.4 | 28.6 | 23.9 | -5.18 | 11.2 | 0.677 | 0.514 | 0.455 | 0.948 | 0.987 | 0.672 | |||
| post5.4 | [-] | 23.7 | 23.6 | 28.6 | 24.3 | -4.96 | 11.1 | 0.711 | 0.532 | 0.456 | 0.946 | 0.987 | 0.676 |
Download Data |
Period Mean (original grids) [W m-2] |
Model Period Mean (intersection) [W m-2] |
Benchmark Period Mean (intersection) [W m-2] |
Model Period Mean (complement) [W m-2] |
Benchmark Period Mean (complement) [W m-2] |
Bias [W m-2] |
RMSE [W m-2] |
Phase Shift [months] |
Bias Score [1] |
RMSE Score [1] |
Seasonal Cycle Score [1] |
Spatial Distribution Score [1] |
Overall Score [1] |
|||
|---|---|---|---|---|---|---|---|---|---|---|---|---|---|---|---|---|
| Benchmark | [-] | 30.9 | ||||||||||||||
| I123pd | [-] | 27.9 | 27.1 | 30.9 | 50.0 | -3.32 | 11.5 | 0.804 | 0.595 | 0.621 | 0.915 | 0.958 | 0.742 | |||
| post5.4 | [-] | 27.7 | 26.9 | 30.9 | 50.1 | -3.46 | 11.6 | 0.780 | 0.588 | 0.616 | 0.919 | 0.957 | 0.739 |
Download Data |
Period Mean (original grids) [W m-2] |
Model Period Mean (intersection) [W m-2] |
Benchmark Period Mean (intersection) [W m-2] |
Model Period Mean (complement) [W m-2] |
Benchmark Period Mean (complement) [W m-2] |
Bias [W m-2] |
RMSE [W m-2] |
Phase Shift [months] |
Bias Score [1] |
RMSE Score [1] |
Seasonal Cycle Score [1] |
Spatial Distribution Score [1] |
Overall Score [1] |
|||
|---|---|---|---|---|---|---|---|---|---|---|---|---|---|---|---|---|
| Benchmark | [-] | 56.7 | ||||||||||||||
| I123pd | [-] | 57.1 | 55.6 | 56.7 | 79.0 | 0.542 | 14.5 | 1.22 | 0.665 | 0.611 | 0.852 | 0.993 | 0.746 | |||
| post5.4 | [-] | 57.0 | 55.5 | 56.7 | 79.1 | 0.447 | 14.6 | 1.20 | 0.660 | 0.613 | 0.856 | 0.993 | 0.747 |
Download Data |
Period Mean (original grids) [W m-2] |
Model Period Mean (intersection) [W m-2] |
Benchmark Period Mean (intersection) [W m-2] |
Model Period Mean (complement) [W m-2] |
Benchmark Period Mean (complement) [W m-2] |
Bias [W m-2] |
RMSE [W m-2] |
Phase Shift [months] |
Bias Score [1] |
RMSE Score [1] |
Seasonal Cycle Score [1] |
Spatial Distribution Score [1] |
Overall Score [1] |
|||
|---|---|---|---|---|---|---|---|---|---|---|---|---|---|---|---|---|
| Benchmark | [-] | 16.2 | ||||||||||||||
| I123pd | [-] | 15.1 | 15.3 | 16.2 | 13.4 | -1.14 | 7.02 | 0.404 | 0.760 | 0.555 | 0.973 | 0.985 | 0.766 | |||
| post5.4 | [-] | 15.5 | 15.7 | 16.2 | 13.9 | -0.741 | 6.96 | 0.405 | 0.768 | 0.556 | 0.973 | 0.981 | 0.767 |
Download Data |
Period Mean (original grids) [W m-2] |
Model Period Mean (intersection) [W m-2] |
Benchmark Period Mean (intersection) [W m-2] |
Model Period Mean (complement) [W m-2] |
Benchmark Period Mean (complement) [W m-2] |
Bias [W m-2] |
RMSE [W m-2] |
Phase Shift [months] |
Bias Score [1] |
RMSE Score [1] |
Seasonal Cycle Score [1] |
Spatial Distribution Score [1] |
Overall Score [1] |
|||
|---|---|---|---|---|---|---|---|---|---|---|---|---|---|---|---|---|
| Benchmark | [-] | 29.5 | ||||||||||||||
| I123pd | [-] | 33.3 | 32.1 | 29.5 | 49.6 | 3.40 | 9.81 | 0.943 | 0.677 | 0.715 | 0.895 | 0.974 | 0.795 | |||
| post5.4 | [-] | 33.4 | 32.2 | 29.5 | 50.3 | 3.56 | 9.94 | 0.957 | 0.675 | 0.710 | 0.892 | 0.970 | 0.792 |
Download Data |
Period Mean (original grids) [W m-2] |
Model Period Mean (intersection) [W m-2] |
Benchmark Period Mean (intersection) [W m-2] |
Model Period Mean (complement) [W m-2] |
Benchmark Period Mean (complement) [W m-2] |
Bias [W m-2] |
RMSE [W m-2] |
Phase Shift [months] |
Bias Score [1] |
RMSE Score [1] |
Seasonal Cycle Score [1] |
Spatial Distribution Score [1] |
Overall Score [1] |
|||
|---|---|---|---|---|---|---|---|---|---|---|---|---|---|---|---|---|
| Benchmark | [-] | 39.3 | ||||||||||||||
| I123pd | [-] | 34.4 | 34.4 | 39.3 | 34.2 | 33.0 | -4.84 | 11.3 | 0.359 | 0.593 | 0.634 | 0.975 | 0.974 | 0.762 | ||
| post5.4 | [-] | 34.6 | 34.6 | 39.3 | 34.7 | 33.0 | -4.58 | 11.4 | 0.406 | 0.602 | 0.628 | 0.972 | 0.976 | 0.761 |
Download Data |
Period Mean (original grids) [W m-2] |
Model Period Mean (intersection) [W m-2] |
Benchmark Period Mean (intersection) [W m-2] |
Model Period Mean (complement) [W m-2] |
Benchmark Period Mean (complement) [W m-2] |
Bias [W m-2] |
RMSE [W m-2] |
Phase Shift [months] |
Bias Score [1] |
RMSE Score [1] |
Seasonal Cycle Score [1] |
Spatial Distribution Score [1] |
Overall Score [1] |
|||
|---|---|---|---|---|---|---|---|---|---|---|---|---|---|---|---|---|
| Benchmark | [-] | 39.7 | ||||||||||||||
| I123pd | [-] | 34.4 | 38.0 | 39.7 | 14.4 | 35.9 | -1.17 | 12.1 | 1.08 | 0.608 | 0.633 | 0.863 | 0.982 | 0.744 | ||
| post5.4 | [-] | 34.5 | 38.2 | 39.7 | 14.7 | 35.9 | -1.02 | 12.1 | 1.08 | 0.607 | 0.631 | 0.863 | 0.981 | 0.743 |
Download Data |
Period Mean (original grids) [W m-2] |
Model Period Mean (intersection) [W m-2] |
Benchmark Period Mean (intersection) [W m-2] |
Model Period Mean (complement) [W m-2] |
Benchmark Period Mean (complement) [W m-2] |
Bias [W m-2] |
RMSE [W m-2] |
Phase Shift [months] |
Bias Score [1] |
RMSE Score [1] |
Seasonal Cycle Score [1] |
Spatial Distribution Score [1] |
Overall Score [1] |
|||
|---|---|---|---|---|---|---|---|---|---|---|---|---|---|---|---|---|
| Benchmark | [-] | 10.2 | ||||||||||||||
| I123pd | [-] | 9.96 | 9.69 | 10.2 | 21.7 | 8.43 | -0.175 | 7.48 | 1.98 | 0.739 | 0.750 | 0.694 | 0.947 | 0.776 | ||
| post5.4 | [-] | 9.96 | 9.68 | 10.2 | 21.7 | 8.43 | -0.181 | 7.50 | 1.98 | 0.739 | 0.750 | 0.694 | 0.947 | 0.776 |
Download Data |
Period Mean (original grids) [W m-2] |
Model Period Mean (intersection) [W m-2] |
Benchmark Period Mean (intersection) [W m-2] |
Model Period Mean (complement) [W m-2] |
Benchmark Period Mean (complement) [W m-2] |
Bias [W m-2] |
RMSE [W m-2] |
Phase Shift [months] |
Bias Score [1] |
RMSE Score [1] |
Seasonal Cycle Score [1] |
Spatial Distribution Score [1] |
Overall Score [1] |
|||
|---|---|---|---|---|---|---|---|---|---|---|---|---|---|---|---|---|
| Benchmark | [-] | 17.6 | ||||||||||||||
| I123pd | [-] | 17.5 | 17.9 | 17.6 | 14.4 | -0.0383 | 7.48 | 0.465 | 0.644 | 0.568 | 0.969 | 0.906 | 0.731 | |||
| post5.4 | [-] | 17.8 | 18.2 | 17.6 | 14.6 | 0.230 | 7.52 | 0.433 | 0.644 | 0.566 | 0.971 | 0.897 | 0.729 |
Download Data |
Period Mean (original grids) [W m-2] |
Model Period Mean (intersection) [W m-2] |
Benchmark Period Mean (intersection) [W m-2] |
Model Period Mean (complement) [W m-2] |
Benchmark Period Mean (complement) [W m-2] |
Bias [W m-2] |
RMSE [W m-2] |
Phase Shift [months] |
Bias Score [1] |
RMSE Score [1] |
Seasonal Cycle Score [1] |
Spatial Distribution Score [1] |
Overall Score [1] |
|||
|---|---|---|---|---|---|---|---|---|---|---|---|---|---|---|---|---|
| Benchmark | [-] | 57.1 | ||||||||||||||
| I123pd | [-] | 58.9 | 56.8 | 57.1 | 70.3 | 1.84 | 14.6 | 0.963 | 0.581 | 0.680 | 0.892 | 0.926 | 0.752 | |||
| post5.4 | [-] | 59.2 | 57.1 | 57.1 | 70.7 | 2.12 | 14.9 | 0.966 | 0.578 | 0.672 | 0.892 | 0.922 | 0.747 |
Download Data |
Period Mean (original grids) [W m-2] |
Model Period Mean (intersection) [W m-2] |
Benchmark Period Mean (intersection) [W m-2] |
Model Period Mean (complement) [W m-2] |
Benchmark Period Mean (complement) [W m-2] |
Bias [W m-2] |
RMSE [W m-2] |
Phase Shift [months] |
Bias Score [1] |
RMSE Score [1] |
Seasonal Cycle Score [1] |
Spatial Distribution Score [1] |
Overall Score [1] |
|||
|---|---|---|---|---|---|---|---|---|---|---|---|---|---|---|---|---|
| Benchmark | [-] | 59.7 | ||||||||||||||
| I123pd | [-] | 48.9 | 48.8 | 59.7 | 52.7 | -10.5 | 14.9 | 0.453 | 0.350 | 0.608 | 0.970 | 0.943 | 0.696 | |||
| post5.4 | [-] | 48.8 | 48.6 | 59.7 | 53.0 | -10.7 | 15.5 | 0.486 | 0.334 | 0.579 | 0.967 | 0.975 | 0.687 |
Download Data |
Period Mean (original grids) [W m-2] |
Model Period Mean (intersection) [W m-2] |
Benchmark Period Mean (intersection) [W m-2] |
Model Period Mean (complement) [W m-2] |
Benchmark Period Mean (complement) [W m-2] |
Bias [W m-2] |
RMSE [W m-2] |
Phase Shift [months] |
Bias Score [1] |
RMSE Score [1] |
Seasonal Cycle Score [1] |
Spatial Distribution Score [1] |
Overall Score [1] |
|||
|---|---|---|---|---|---|---|---|---|---|---|---|---|---|---|---|---|
| Benchmark | [-] | 32.3 | ||||||||||||||
| I123pd | [-] | 30.6 | 30.1 | 32.3 | 39.1 | -1.85 | 9.40 | 0.599 | 0.732 | 0.587 | 0.958 | 0.988 | 0.770 | |||
| post5.4 | [-] | 30.5 | 30.0 | 32.3 | 39.4 | -1.97 | 9.60 | 0.715 | 0.721 | 0.579 | 0.950 | 0.990 | 0.764 |
Download Data |
Period Mean (original grids) [W m-2] |
Model Period Mean (intersection) [W m-2] |
Benchmark Period Mean (intersection) [W m-2] |
Model Period Mean (complement) [W m-2] |
Benchmark Period Mean (complement) [W m-2] |
Bias [W m-2] |
RMSE [W m-2] |
Phase Shift [months] |
Bias Score [1] |
RMSE Score [1] |
Seasonal Cycle Score [1] |
Spatial Distribution Score [1] |
Overall Score [1] |
|||
|---|---|---|---|---|---|---|---|---|---|---|---|---|---|---|---|---|
| Benchmark | [-] | 31.4 | ||||||||||||||
| I123pd | [-] | 26.8 | 27.0 | 31.4 | 40.1 | -4.16 | 10.0 | 0.768 | 0.674 | 0.654 | 0.916 | 0.993 | 0.778 | |||
| post5.4 | [-] | 26.7 | 26.9 | 31.4 | 40.5 | -4.27 | 10.1 | 0.754 | 0.667 | 0.650 | 0.918 | 0.992 | 0.776 |
Download Data |
Period Mean (original grids) [W m-2] |
Model Period Mean (intersection) [W m-2] |
Benchmark Period Mean (intersection) [W m-2] |
Model Period Mean (complement) [W m-2] |
Benchmark Period Mean (complement) [W m-2] |
Bias [W m-2] |
RMSE [W m-2] |
Phase Shift [months] |
Bias Score [1] |
RMSE Score [1] |
Seasonal Cycle Score [1] |
Spatial Distribution Score [1] |
Overall Score [1] |
|||
|---|---|---|---|---|---|---|---|---|---|---|---|---|---|---|---|---|
| Benchmark | [-] | 86.4 | ||||||||||||||
| I123pd | [-] | 91.5 | 91.7 | 86.4 | 88.1 | 5.31 | 13.6 | 1.29 | 0.621 | 0.787 | 0.831 | 0.644 | 0.734 | |||
| post5.4 | [-] | 92.1 | 92.2 | 86.4 | 88.5 | 5.85 | 13.7 | 1.31 | 0.620 | 0.785 | 0.827 | 0.639 | 0.731 |
Download Data |
Period Mean (original grids) [W m-2] |
Model Period Mean (intersection) [W m-2] |
Benchmark Period Mean (intersection) [W m-2] |
Model Period Mean (complement) [W m-2] |
Benchmark Period Mean (complement) [W m-2] |
Bias [W m-2] |
RMSE [W m-2] |
Phase Shift [months] |
Bias Score [1] |
RMSE Score [1] |
Seasonal Cycle Score [1] |
Spatial Distribution Score [1] |
Overall Score [1] |
|||
|---|---|---|---|---|---|---|---|---|---|---|---|---|---|---|---|---|
| Benchmark | [-] | 68.6 | ||||||||||||||
| I123pd | [-] | 60.2 | 59.9 | 68.6 | 62.3 | -8.92 | 15.2 | 1.12 | 0.549 | 0.682 | 0.878 | 0.956 | 0.750 | |||
| post5.4 | [-] | 60.8 | 60.5 | 68.6 | 63.1 | -8.35 | 15.0 | 1.12 | 0.565 | 0.678 | 0.878 | 0.953 | 0.751 |
Download Data |
Period Mean (original grids) [W m-2] |
Model Period Mean (intersection) [W m-2] |
Benchmark Period Mean (intersection) [W m-2] |
Model Period Mean (complement) [W m-2] |
Benchmark Period Mean (complement) [W m-2] |
Bias [W m-2] |
RMSE [W m-2] |
Phase Shift [months] |
Bias Score [1] |
RMSE Score [1] |
Seasonal Cycle Score [1] |
Spatial Distribution Score [1] |
Overall Score [1] |
|||
|---|---|---|---|---|---|---|---|---|---|---|---|---|---|---|---|---|
| Benchmark | [-] | 31.5 | ||||||||||||||
| I123pd | [-] | 27.3 | 27.4 | 31.5 | 25.6 | 16.6 | -3.98 | 15.1 | 1.13 | 0.347 | 0.640 | 0.858 | 0.726 | 0.642 | ||
| post5.4 | [-] | 27.5 | 27.5 | 31.5 | 26.1 | 16.6 | -3.80 | 15.2 | 1.14 | 0.347 | 0.636 | 0.858 | 0.717 | 0.639 |
Temporally integrated period mean