Mean State
Download Data |
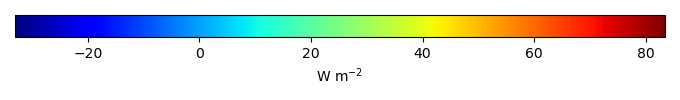
Period Mean (original grids) [W m-2] |
Model Period Mean (intersection) [W m-2] |
Benchmark Period Mean (intersection) [W m-2] |
Model Period Mean (complement) [W m-2] |
Benchmark Period Mean (complement) [W m-2] |
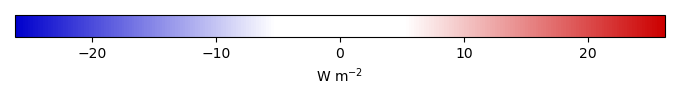
Bias [W m-2] |
RMSE [W m-2] |
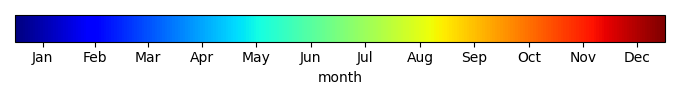
Phase Shift [months] |
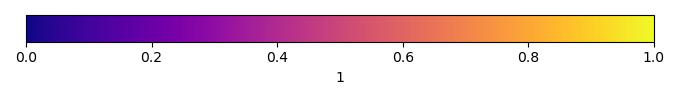
Bias Score [1] |
RMSE Score [1] |
Seasonal Cycle Score [1] |
Spatial Distribution Score [1] |
Overall Score [1] |
|||
|---|---|---|---|---|---|---|---|---|---|---|---|---|---|---|---|---|
| Benchmark | [-] | 48.0 | ||||||||||||||
| I123pd | [-] | 43.0 | 42.7 | 48.0 | 45.6 | -4.82 | 19.0 | 2.71 | 0.436 | 0.496 | 0.574 | 0.825 | 0.565 | |||
| post5.4 | [-] | 43.0 | 42.7 | 48.0 | 45.6 | -4.83 | 19.0 | 2.68 | 0.434 | 0.496 | 0.581 | 0.824 | 0.566 |
Download Data |
Period Mean (original grids) [W m-2] |
Model Period Mean (intersection) [W m-2] |
Benchmark Period Mean (intersection) [W m-2] |
Model Period Mean (complement) [W m-2] |
Benchmark Period Mean (complement) [W m-2] |
Bias [W m-2] |
RMSE [W m-2] |
Phase Shift [months] |
Bias Score [1] |
RMSE Score [1] |
Seasonal Cycle Score [1] |
Spatial Distribution Score [1] |
Overall Score [1] |
|||
|---|---|---|---|---|---|---|---|---|---|---|---|---|---|---|---|---|
| Benchmark | [-] | 55.5 | ||||||||||||||
| I123pd | [-] | 52.9 | 53.0 | 55.5 | 60.8 | -2.61 | 22.4 | 1.34 | 0.466 | 0.270 | 0.828 | 0.820 | 0.531 | |||
| post5.4 | [-] | 52.9 | 53.0 | 55.5 | 60.9 | -2.61 | 22.4 | 1.34 | 0.465 | 0.272 | 0.828 | 0.819 | 0.531 |
Download Data |
Period Mean (original grids) [W m-2] |
Model Period Mean (intersection) [W m-2] |
Benchmark Period Mean (intersection) [W m-2] |
Model Period Mean (complement) [W m-2] |
Benchmark Period Mean (complement) [W m-2] |
Bias [W m-2] |
RMSE [W m-2] |
Phase Shift [months] |
Bias Score [1] |
RMSE Score [1] |
Seasonal Cycle Score [1] |
Spatial Distribution Score [1] |
Overall Score [1] |
|||
|---|---|---|---|---|---|---|---|---|---|---|---|---|---|---|---|---|
| Benchmark | [-] | 55.7 | ||||||||||||||
| I123pd | [-] | 59.9 | 59.9 | 55.7 | 59.5 | 68.3 | 4.81 | 19.4 | 1.44 | 0.452 | 0.436 | 0.808 | 0.770 | 0.580 | ||
| post5.4 | [-] | 60.1 | 60.2 | 55.7 | 59.6 | 68.3 | 5.08 | 19.6 | 1.42 | 0.446 | 0.438 | 0.814 | 0.755 | 0.578 |
Download Data |
Period Mean (original grids) [W m-2] |
Model Period Mean (intersection) [W m-2] |
Benchmark Period Mean (intersection) [W m-2] |
Model Period Mean (complement) [W m-2] |
Benchmark Period Mean (complement) [W m-2] |
Bias [W m-2] |
RMSE [W m-2] |
Phase Shift [months] |
Bias Score [1] |
RMSE Score [1] |
Seasonal Cycle Score [1] |
Spatial Distribution Score [1] |
Overall Score [1] |
|||
|---|---|---|---|---|---|---|---|---|---|---|---|---|---|---|---|---|
| Benchmark | [-] | 18.8 | ||||||||||||||
| I123pd | [-] | 10.5 | 10.7 | 18.8 | 7.40 | -8.36 | 14.4 | 0.377 | 0.499 | 0.560 | 0.974 | 0.943 | 0.707 | |||
| post5.4 | [-] | 10.8 | 11.0 | 18.8 | 7.53 | -8.04 | 13.5 | 0.332 | 0.516 | 0.595 | 0.977 | 0.943 | 0.725 |
Download Data |
Period Mean (original grids) [W m-2] |
Model Period Mean (intersection) [W m-2] |
Benchmark Period Mean (intersection) [W m-2] |
Model Period Mean (complement) [W m-2] |
Benchmark Period Mean (complement) [W m-2] |
Bias [W m-2] |
RMSE [W m-2] |
Phase Shift [months] |
Bias Score [1] |
RMSE Score [1] |
Seasonal Cycle Score [1] |
Spatial Distribution Score [1] |
Overall Score [1] |
|||
|---|---|---|---|---|---|---|---|---|---|---|---|---|---|---|---|---|
| Benchmark | [-] | 33.4 | ||||||||||||||
| I123pd | [-] | 36.8 | 35.0 | 33.4 | 40.9 | 2.45 | 12.2 | 2.47 | 0.592 | 0.722 | 0.601 | 0.957 | 0.719 | |||
| post5.4 | [-] | 36.4 | 34.5 | 33.4 | 40.8 | 2.08 | 12.1 | 2.50 | 0.597 | 0.723 | 0.596 | 0.961 | 0.720 |
Download Data |
Period Mean (original grids) [W m-2] |
Model Period Mean (intersection) [W m-2] |
Benchmark Period Mean (intersection) [W m-2] |
Model Period Mean (complement) [W m-2] |
Benchmark Period Mean (complement) [W m-2] |
Bias [W m-2] |
RMSE [W m-2] |
Phase Shift [months] |
Bias Score [1] |
RMSE Score [1] |
Seasonal Cycle Score [1] |
Spatial Distribution Score [1] |
Overall Score [1] |
|||
|---|---|---|---|---|---|---|---|---|---|---|---|---|---|---|---|---|
| Benchmark | [-] | 22.2 | ||||||||||||||
| I123pd | [-] | 19.4 | 19.4 | 22.2 | 20.6 | -2.88 | 11.8 | 0.812 | 0.686 | 0.554 | 0.928 | 0.922 | 0.729 | |||
| post5.4 | [-] | 19.5 | 19.5 | 22.2 | 20.4 | -2.77 | 11.3 | 0.748 | 0.697 | 0.575 | 0.932 | 0.927 | 0.741 |
Download Data |
Period Mean (original grids) [W m-2] |
Model Period Mean (intersection) [W m-2] |
Benchmark Period Mean (intersection) [W m-2] |
Model Period Mean (complement) [W m-2] |
Benchmark Period Mean (complement) [W m-2] |
Bias [W m-2] |
RMSE [W m-2] |
Phase Shift [months] |
Bias Score [1] |
RMSE Score [1] |
Seasonal Cycle Score [1] |
Spatial Distribution Score [1] |
Overall Score [1] |
|||
|---|---|---|---|---|---|---|---|---|---|---|---|---|---|---|---|---|
| Benchmark | [-] | 33.2 | ||||||||||||||
| I123pd | [-] | 34.2 | 34.3 | 33.2 | 30.0 | 1.07 | 11.4 | 0.915 | 0.563 | 0.603 | 0.902 | 0.970 | 0.728 | |||
| post5.4 | [-] | 34.3 | 34.4 | 33.2 | 30.2 | 1.19 | 11.3 | 0.909 | 0.563 | 0.604 | 0.902 | 0.969 | 0.728 |
Download Data |
Period Mean (original grids) [W m-2] |
Model Period Mean (intersection) [W m-2] |
Benchmark Period Mean (intersection) [W m-2] |
Model Period Mean (complement) [W m-2] |
Benchmark Period Mean (complement) [W m-2] |
Bias [W m-2] |
RMSE [W m-2] |
Phase Shift [months] |
Bias Score [1] |
RMSE Score [1] |
Seasonal Cycle Score [1] |
Spatial Distribution Score [1] |
Overall Score [1] |
|||
|---|---|---|---|---|---|---|---|---|---|---|---|---|---|---|---|---|
| Benchmark | [-] | 43.4 | ||||||||||||||
| I123pd | [-] | 39.5 | 39.3 | 43.4 | 40.2 | -4.23 | 14.6 | 0.792 | 0.592 | 0.547 | 0.923 | 0.950 | 0.712 | |||
| post5.4 | [-] | 39.8 | 39.7 | 43.4 | 40.4 | -3.86 | 14.6 | 0.794 | 0.601 | 0.544 | 0.923 | 0.947 | 0.712 |
Download Data |
Period Mean (original grids) [W m-2] |
Model Period Mean (intersection) [W m-2] |
Benchmark Period Mean (intersection) [W m-2] |
Model Period Mean (complement) [W m-2] |
Benchmark Period Mean (complement) [W m-2] |
Bias [W m-2] |
RMSE [W m-2] |
Phase Shift [months] |
Bias Score [1] |
RMSE Score [1] |
Seasonal Cycle Score [1] |
Spatial Distribution Score [1] |
Overall Score [1] |
|||
|---|---|---|---|---|---|---|---|---|---|---|---|---|---|---|---|---|
| Benchmark | [-] | 14.4 | ||||||||||||||
| I123pd | [-] | 2.89 | 3.35 | 14.4 | -0.917 | -11.3 | 14.4 | 0.634 | 0.345 | 0.661 | 0.957 | 0.326 | 0.590 | |||
| post5.4 | [-] | 3.00 | 3.47 | 14.4 | -0.895 | -11.2 | 14.0 | 0.545 | 0.350 | 0.683 | 0.963 | 0.329 | 0.602 |
Download Data |
Period Mean (original grids) [W m-2] |
Model Period Mean (intersection) [W m-2] |
Benchmark Period Mean (intersection) [W m-2] |
Model Period Mean (complement) [W m-2] |
Benchmark Period Mean (complement) [W m-2] |
Bias [W m-2] |
RMSE [W m-2] |
Phase Shift [months] |
Bias Score [1] |
RMSE Score [1] |
Seasonal Cycle Score [1] |
Spatial Distribution Score [1] |
Overall Score [1] |
|||
|---|---|---|---|---|---|---|---|---|---|---|---|---|---|---|---|---|
| Benchmark | [-] | 58.2 | ||||||||||||||
| I123pd | [-] | 69.9 | 70.3 | 58.2 | 64.5 | 11.6 | 15.0 | 0.553 | 0.321 | 0.702 | 0.955 | 0.988 | 0.734 | |||
| post5.4 | [-] | 70.2 | 70.7 | 58.2 | 64.6 | 11.9 | 15.5 | 0.545 | 0.312 | 0.693 | 0.957 | 0.980 | 0.727 |
Download Data |
Period Mean (original grids) [W m-2] |
Model Period Mean (intersection) [W m-2] |
Benchmark Period Mean (intersection) [W m-2] |
Model Period Mean (complement) [W m-2] |
Benchmark Period Mean (complement) [W m-2] |
Bias [W m-2] |
RMSE [W m-2] |
Phase Shift [months] |
Bias Score [1] |
RMSE Score [1] |
Seasonal Cycle Score [1] |
Spatial Distribution Score [1] |
Overall Score [1] |
|||
|---|---|---|---|---|---|---|---|---|---|---|---|---|---|---|---|---|
| Benchmark | [-] | 23.9 | ||||||||||||||
| I123pd | [-] | 27.6 | 27.6 | 23.8 | 26.8 | 56.1 | 3.95 | 13.6 | 0.734 | 0.487 | 0.478 | 0.920 | 0.955 | 0.664 | ||
| post5.4 | [-] | 27.4 | 27.4 | 23.8 | 26.5 | 56.1 | 3.79 | 13.5 | 0.714 | 0.493 | 0.486 | 0.922 | 0.951 | 0.667 |
Download Data |
Period Mean (original grids) [W m-2] |
Model Period Mean (intersection) [W m-2] |
Benchmark Period Mean (intersection) [W m-2] |
Model Period Mean (complement) [W m-2] |
Benchmark Period Mean (complement) [W m-2] |
Bias [W m-2] |
RMSE [W m-2] |
Phase Shift [months] |
Bias Score [1] |
RMSE Score [1] |
Seasonal Cycle Score [1] |
Spatial Distribution Score [1] |
Overall Score [1] |
|||
|---|---|---|---|---|---|---|---|---|---|---|---|---|---|---|---|---|
| Benchmark | [-] | 39.1 | ||||||||||||||
| I123pd | [-] | 31.3 | 38.0 | 39.1 | -5.04 | 57.8 | -1.08 | 14.1 | 1.03 | 0.511 | 0.579 | 0.877 | 0.916 | 0.692 | ||
| post5.4 | [-] | 31.5 | 38.2 | 39.1 | -4.78 | 57.8 | -0.907 | 14.0 | 1.03 | 0.511 | 0.582 | 0.877 | 0.913 | 0.693 |
Download Data |
Period Mean (original grids) [W m-2] |
Model Period Mean (intersection) [W m-2] |
Benchmark Period Mean (intersection) [W m-2] |
Model Period Mean (complement) [W m-2] |
Benchmark Period Mean (complement) [W m-2] |
Bias [W m-2] |
RMSE [W m-2] |
Phase Shift [months] |
Bias Score [1] |
RMSE Score [1] |
Seasonal Cycle Score [1] |
Spatial Distribution Score [1] |
Overall Score [1] |
|||
|---|---|---|---|---|---|---|---|---|---|---|---|---|---|---|---|---|
| Benchmark | [-] | 49.8 | ||||||||||||||
| I123pd | [-] | 42.9 | 42.6 | 49.8 | 52.4 | 83.8 | -6.61 | 12.0 | 1.11 | 0.453 | 0.683 | 0.860 | 0.958 | 0.727 | ||
| post5.4 | [-] | 43.0 | 42.8 | 49.8 | 52.6 | 83.8 | -6.47 | 12.0 | 1.13 | 0.457 | 0.682 | 0.858 | 0.957 | 0.727 |
Download Data |
Period Mean (original grids) [W m-2] |
Model Period Mean (intersection) [W m-2] |
Benchmark Period Mean (intersection) [W m-2] |
Model Period Mean (complement) [W m-2] |
Benchmark Period Mean (complement) [W m-2] |
Bias [W m-2] |
RMSE [W m-2] |
Phase Shift [months] |
Bias Score [1] |
RMSE Score [1] |
Seasonal Cycle Score [1] |
Spatial Distribution Score [1] |
Overall Score [1] |
|||
|---|---|---|---|---|---|---|---|---|---|---|---|---|---|---|---|---|
| Benchmark | [-] | 19.1 | ||||||||||||||
| I123pd | [-] | 8.11 | 8.92 | 19.1 | 2.75 | -11.0 | 16.1 | 0.426 | 0.366 | 0.552 | 0.966 | 0.474 | 0.582 | |||
| post5.4 | [-] | 8.25 | 9.07 | 19.1 | 2.79 | -10.8 | 15.9 | 0.413 | 0.374 | 0.560 | 0.967 | 0.470 | 0.586 |
Download Data |
Period Mean (original grids) [W m-2] |
Model Period Mean (intersection) [W m-2] |
Benchmark Period Mean (intersection) [W m-2] |
Model Period Mean (complement) [W m-2] |
Benchmark Period Mean (complement) [W m-2] |
Bias [W m-2] |
RMSE [W m-2] |
Phase Shift [months] |
Bias Score [1] |
RMSE Score [1] |
Seasonal Cycle Score [1] |
Spatial Distribution Score [1] |
Overall Score [1] |
|||
|---|---|---|---|---|---|---|---|---|---|---|---|---|---|---|---|---|
| Benchmark | [-] | 53.7 | ||||||||||||||
| I123pd | [-] | 49.9 | 49.6 | 53.7 | 51.7 | -3.67 | 14.7 | 0.730 | 0.551 | 0.582 | 0.930 | 0.968 | 0.723 | |||
| post5.4 | [-] | 50.5 | 50.2 | 53.7 | 52.5 | -3.00 | 14.7 | 0.736 | 0.563 | 0.576 | 0.928 | 0.977 | 0.724 |
Download Data |
Period Mean (original grids) [W m-2] |
Model Period Mean (intersection) [W m-2] |
Benchmark Period Mean (intersection) [W m-2] |
Model Period Mean (complement) [W m-2] |
Benchmark Period Mean (complement) [W m-2] |
Bias [W m-2] |
RMSE [W m-2] |
Phase Shift [months] |
Bias Score [1] |
RMSE Score [1] |
Seasonal Cycle Score [1] |
Spatial Distribution Score [1] |
Overall Score [1] |
|||
|---|---|---|---|---|---|---|---|---|---|---|---|---|---|---|---|---|
| Benchmark | [-] | 29.7 | ||||||||||||||
| I123pd | [-] | 33.9 | 34.1 | 29.7 | 31.1 | 4.66 | 11.1 | 0.911 | 0.573 | 0.631 | 0.889 | 0.916 | 0.728 | |||
| post5.4 | [-] | 34.6 | 34.9 | 29.7 | 31.2 | 5.38 | 11.4 | 1.06 | 0.535 | 0.636 | 0.858 | 0.929 | 0.719 |
Download Data |
Period Mean (original grids) [W m-2] |
Model Period Mean (intersection) [W m-2] |
Benchmark Period Mean (intersection) [W m-2] |
Model Period Mean (complement) [W m-2] |
Benchmark Period Mean (complement) [W m-2] |
Bias [W m-2] |
RMSE [W m-2] |
Phase Shift [months] |
Bias Score [1] |
RMSE Score [1] |
Seasonal Cycle Score [1] |
Spatial Distribution Score [1] |
Overall Score [1] |
|||
|---|---|---|---|---|---|---|---|---|---|---|---|---|---|---|---|---|
| Benchmark | [-] | 26.5 | ||||||||||||||
| I123pd | [-] | 27.2 | 27.6 | 26.5 | 22.3 | 0.687 | 13.3 | 0.678 | 0.660 | 0.473 | 0.948 | 0.613 | 0.633 | |||
| post5.4 | [-] | 27.4 | 27.8 | 26.5 | 22.3 | 0.877 | 13.2 | 0.670 | 0.659 | 0.478 | 0.947 | 0.616 | 0.636 |
Download Data |
Period Mean (original grids) [W m-2] |
Model Period Mean (intersection) [W m-2] |
Benchmark Period Mean (intersection) [W m-2] |
Model Period Mean (complement) [W m-2] |
Benchmark Period Mean (complement) [W m-2] |
Bias [W m-2] |
RMSE [W m-2] |
Phase Shift [months] |
Bias Score [1] |
RMSE Score [1] |
Seasonal Cycle Score [1] |
Spatial Distribution Score [1] |
Overall Score [1] |
|||
|---|---|---|---|---|---|---|---|---|---|---|---|---|---|---|---|---|
| Benchmark | [-] | 41.6 | ||||||||||||||
| I123pd | [-] | 40.0 | 40.0 | 41.6 | 44.0 | -1.56 | 10.2 | 0.693 | 0.634 | 0.610 | 0.923 | 0.989 | 0.753 | |||
| post5.4 | [-] | 40.1 | 40.1 | 41.6 | 44.1 | -1.46 | 10.2 | 0.719 | 0.638 | 0.607 | 0.918 | 0.987 | 0.751 |
Download Data |
Period Mean (original grids) [W m-2] |
Model Period Mean (intersection) [W m-2] |
Benchmark Period Mean (intersection) [W m-2] |
Model Period Mean (complement) [W m-2] |
Benchmark Period Mean (complement) [W m-2] |
Bias [W m-2] |
RMSE [W m-2] |
Phase Shift [months] |
Bias Score [1] |
RMSE Score [1] |
Seasonal Cycle Score [1] |
Spatial Distribution Score [1] |
Overall Score [1] |
|||
|---|---|---|---|---|---|---|---|---|---|---|---|---|---|---|---|---|
| Benchmark | [-] | 32.2 | ||||||||||||||
| I123pd | [-] | 27.6 | 27.2 | 32.2 | 40.8 | -4.64 | 11.4 | 1.26 | 0.588 | 0.730 | 0.835 | 0.783 | 0.733 | |||
| post5.4 | [-] | 27.4 | 27.0 | 32.2 | 40.9 | -4.81 | 11.5 | 1.25 | 0.578 | 0.730 | 0.836 | 0.771 | 0.729 |
Download Data |
Period Mean (original grids) [W m-2] |
Model Period Mean (intersection) [W m-2] |
Benchmark Period Mean (intersection) [W m-2] |
Model Period Mean (complement) [W m-2] |
Benchmark Period Mean (complement) [W m-2] |
Bias [W m-2] |
RMSE [W m-2] |
Phase Shift [months] |
Bias Score [1] |
RMSE Score [1] |
Seasonal Cycle Score [1] |
Spatial Distribution Score [1] |
Overall Score [1] |
|||
|---|---|---|---|---|---|---|---|---|---|---|---|---|---|---|---|---|
| Benchmark | [-] | 43.0 | ||||||||||||||
| I123pd | [-] | 46.9 | 46.9 | 43.0 | 46.0 | 4.10 | 14.0 | 1.57 | 0.551 | 0.606 | 0.802 | 0.929 | 0.699 | |||
| post5.4 | [-] | 47.4 | 47.5 | 43.0 | 46.0 | 4.64 | 14.0 | 1.53 | 0.543 | 0.615 | 0.809 | 0.906 | 0.698 |
Download Data |
Period Mean (original grids) [W m-2] |
Model Period Mean (intersection) [W m-2] |
Benchmark Period Mean (intersection) [W m-2] |
Model Period Mean (complement) [W m-2] |
Benchmark Period Mean (complement) [W m-2] |
Bias [W m-2] |
RMSE [W m-2] |
Phase Shift [months] |
Bias Score [1] |
RMSE Score [1] |
Seasonal Cycle Score [1] |
Spatial Distribution Score [1] |
Overall Score [1] |
|||
|---|---|---|---|---|---|---|---|---|---|---|---|---|---|---|---|---|
| Benchmark | [-] | 51.7 | ||||||||||||||
| I123pd | [-] | 58.4 | 57.4 | 51.7 | 66.4 | 29.7 | 6.41 | 15.9 | 0.726 | 0.347 | 0.569 | 0.940 | 0.935 | 0.672 | ||
| post5.4 | [-] | 58.8 | 57.8 | 51.7 | 66.3 | 29.7 | 6.81 | 16.1 | 0.727 | 0.341 | 0.563 | 0.940 | 0.925 | 0.666 |
Temporally integrated period mean