Mean State
Download Data |
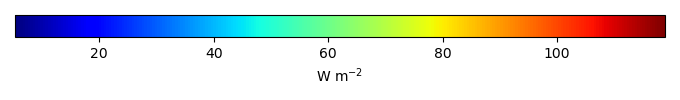
Period Mean (original grids) [W m-2] |
Model Period Mean (intersection) [W m-2] |
Benchmark Period Mean (intersection) [W m-2] |
Model Period Mean (complement) [W m-2] |
Benchmark Period Mean (complement) [W m-2] |
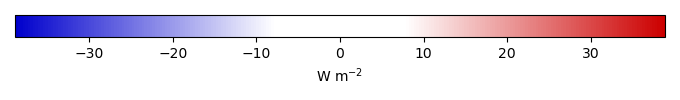
Bias [W m-2] |
RMSE [W m-2] |
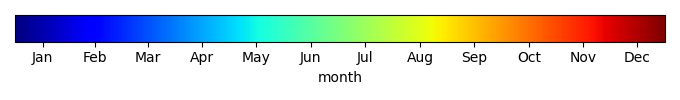
Phase Shift [months] |
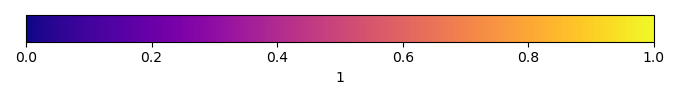
Bias Score [1] |
RMSE Score [1] |
Seasonal Cycle Score [1] |
Spatial Distribution Score [1] |
Overall Score [1] |
|||
|---|---|---|---|---|---|---|---|---|---|---|---|---|---|---|---|---|
| Benchmark | [-] | 29.7 | ||||||||||||||
| I123pd | [-] | 41.0 | 40.6 | 30.0 | 10.9 | 11.4 | 12.3 | 1.56 | 0.219 | 0.724 | 0.779 | 0.965 | 0.682 | |||
| post5.4 | [-] | 41.2 | 40.8 | 30.0 | 10.9 | 11.5 | 12.4 | 1.59 | 0.216 | 0.725 | 0.774 | 0.964 | 0.681 |
Download Data |
Period Mean (original grids) [W m-2] |
Model Period Mean (intersection) [W m-2] |
Benchmark Period Mean (intersection) [W m-2] |
Model Period Mean (complement) [W m-2] |
Benchmark Period Mean (complement) [W m-2] |
Bias [W m-2] |
RMSE [W m-2] |
Phase Shift [months] |
Bias Score [1] |
RMSE Score [1] |
Seasonal Cycle Score [1] |
Spatial Distribution Score [1] |
Overall Score [1] |
|||
|---|---|---|---|---|---|---|---|---|---|---|---|---|---|---|---|---|
| Benchmark | [-] | 43.8 | ||||||||||||||
| I123pd | [-] | 47.1 | 47.6 | 43.9 | 11.9 | 2.76 | 8.51 | 1.21 | 0.495 | 0.709 | 0.856 | 0.957 | 0.745 | |||
| post5.4 | [-] | 47.1 | 47.5 | 43.9 | 11.9 | 2.71 | 8.50 | 1.21 | 0.497 | 0.708 | 0.855 | 0.958 | 0.745 |
Download Data |
Period Mean (original grids) [W m-2] |
Model Period Mean (intersection) [W m-2] |
Benchmark Period Mean (intersection) [W m-2] |
Model Period Mean (complement) [W m-2] |
Benchmark Period Mean (complement) [W m-2] |
Bias [W m-2] |
RMSE [W m-2] |
Phase Shift [months] |
Bias Score [1] |
RMSE Score [1] |
Seasonal Cycle Score [1] |
Spatial Distribution Score [1] |
Overall Score [1] |
|||
|---|---|---|---|---|---|---|---|---|---|---|---|---|---|---|---|---|
| Benchmark | [-] | 33.1 | ||||||||||||||
| I123pd | [-] | 39.8 | 39.8 | 33.3 | 14.1 | 6.38 | 8.74 | 1.29 | 0.455 | 0.779 | 0.822 | 0.837 | 0.734 | |||
| post5.4 | [-] | 40.0 | 40.0 | 33.3 | 14.1 | 6.54 | 8.70 | 1.29 | 0.458 | 0.780 | 0.821 | 0.852 | 0.738 |
Download Data |
Period Mean (original grids) [W m-2] |
Model Period Mean (intersection) [W m-2] |
Benchmark Period Mean (intersection) [W m-2] |
Model Period Mean (complement) [W m-2] |
Benchmark Period Mean (complement) [W m-2] |
Bias [W m-2] |
RMSE [W m-2] |
Phase Shift [months] |
Bias Score [1] |
RMSE Score [1] |
Seasonal Cycle Score [1] |
Spatial Distribution Score [1] |
Overall Score [1] |
|||
|---|---|---|---|---|---|---|---|---|---|---|---|---|---|---|---|---|
| Benchmark | [-] | 39.5 | ||||||||||||||
| I123pd | [-] | 34.4 | 34.4 | 39.5 | 37.1 | -4.81 | 16.0 | 0.126 | 0.496 | 0.551 | 0.991 | 0.641 | 0.646 | |||
| post5.4 | [-] | 35.0 | 35.0 | 39.5 | 37.1 | -4.33 | 15.9 | 0.159 | 0.521 | 0.550 | 0.989 | 0.612 | 0.644 |
Download Data |
Period Mean (original grids) [W m-2] |
Model Period Mean (intersection) [W m-2] |
Benchmark Period Mean (intersection) [W m-2] |
Model Period Mean (complement) [W m-2] |
Benchmark Period Mean (complement) [W m-2] |
Bias [W m-2] |
RMSE [W m-2] |
Phase Shift [months] |
Bias Score [1] |
RMSE Score [1] |
Seasonal Cycle Score [1] |
Spatial Distribution Score [1] |
Overall Score [1] |
|||
|---|---|---|---|---|---|---|---|---|---|---|---|---|---|---|---|---|
| Benchmark | [-] | 18.1 | ||||||||||||||
| I123pd | [-] | 41.3 | 41.3 | 18.4 | 12.2 | 23.0 | 23.3 | 2.27 | 0.00107 | 0.733 | 0.635 | 0.582 | 0.537 | |||
| post5.4 | [-] | 41.3 | 41.2 | 18.4 | 12.2 | 23.0 | 23.3 | 2.22 | 0.00129 | 0.735 | 0.645 | 0.596 | 0.542 |
Download Data |
Period Mean (original grids) [W m-2] |
Model Period Mean (intersection) [W m-2] |
Benchmark Period Mean (intersection) [W m-2] |
Model Period Mean (complement) [W m-2] |
Benchmark Period Mean (complement) [W m-2] |
Bias [W m-2] |
RMSE [W m-2] |
Phase Shift [months] |
Bias Score [1] |
RMSE Score [1] |
Seasonal Cycle Score [1] |
Spatial Distribution Score [1] |
Overall Score [1] |
|||
|---|---|---|---|---|---|---|---|---|---|---|---|---|---|---|---|---|
| Benchmark | [-] | 26.1 | ||||||||||||||
| I123pd | [-] | 26.9 | 26.8 | 26.1 | 22.7 | 0.705 | 8.86 | 0.368 | 0.624 | 0.585 | 0.959 | 0.788 | 0.708 | |||
| post5.4 | [-] | 27.1 | 27.0 | 26.1 | 22.7 | 0.909 | 8.90 | 0.395 | 0.623 | 0.582 | 0.955 | 0.789 | 0.706 |
Download Data |
Period Mean (original grids) [W m-2] |
Model Period Mean (intersection) [W m-2] |
Benchmark Period Mean (intersection) [W m-2] |
Model Period Mean (complement) [W m-2] |
Benchmark Period Mean (complement) [W m-2] |
Bias [W m-2] |
RMSE [W m-2] |
Phase Shift [months] |
Bias Score [1] |
RMSE Score [1] |
Seasonal Cycle Score [1] |
Spatial Distribution Score [1] |
Overall Score [1] |
|||
|---|---|---|---|---|---|---|---|---|---|---|---|---|---|---|---|---|
| Benchmark | [-] | 34.3 | ||||||||||||||
| I123pd | [-] | 37.6 | 37.5 | 34.4 | 8.50 | 2.45 | 10.5 | 0.900 | 0.431 | 0.535 | 0.883 | 0.817 | 0.641 | |||
| post5.4 | [-] | 37.5 | 37.5 | 34.4 | 8.50 | 2.41 | 10.4 | 0.907 | 0.434 | 0.536 | 0.882 | 0.820 | 0.642 |
Download Data |
Period Mean (original grids) [W m-2] |
Model Period Mean (intersection) [W m-2] |
Benchmark Period Mean (intersection) [W m-2] |
Model Period Mean (complement) [W m-2] |
Benchmark Period Mean (complement) [W m-2] |
Bias [W m-2] |
RMSE [W m-2] |
Phase Shift [months] |
Bias Score [1] |
RMSE Score [1] |
Seasonal Cycle Score [1] |
Spatial Distribution Score [1] |
Overall Score [1] |
|||
|---|---|---|---|---|---|---|---|---|---|---|---|---|---|---|---|---|
| Benchmark | [-] | 27.3 | ||||||||||||||
| I123pd | [-] | 40.0 | 40.0 | 27.5 | 12.6 | 12.1 | 14.2 | 0.943 | 0.154 | 0.608 | 0.892 | 0.829 | 0.618 | |||
| post5.4 | [-] | 39.9 | 39.9 | 27.5 | 12.6 | 12.0 | 14.2 | 0.945 | 0.157 | 0.607 | 0.892 | 0.831 | 0.619 |
Download Data |
Period Mean (original grids) [W m-2] |
Model Period Mean (intersection) [W m-2] |
Benchmark Period Mean (intersection) [W m-2] |
Model Period Mean (complement) [W m-2] |
Benchmark Period Mean (complement) [W m-2] |
Bias [W m-2] |
RMSE [W m-2] |
Phase Shift [months] |
Bias Score [1] |
RMSE Score [1] |
Seasonal Cycle Score [1] |
Spatial Distribution Score [1] |
Overall Score [1] |
|||
|---|---|---|---|---|---|---|---|---|---|---|---|---|---|---|---|---|
| Benchmark | [-] | 35.0 | ||||||||||||||
| I123pd | [-] | 32.8 | 32.6 | 35.1 | 21.5 | -1.93 | 12.5 | 0.176 | 0.687 | 0.576 | 0.988 | 0.812 | 0.728 | |||
| post5.4 | [-] | 33.1 | 33.0 | 35.1 | 21.5 | -1.64 | 12.4 | 0.171 | 0.694 | 0.579 | 0.989 | 0.793 | 0.727 |
Download Data |
Period Mean (original grids) [W m-2] |
Model Period Mean (intersection) [W m-2] |
Benchmark Period Mean (intersection) [W m-2] |
Model Period Mean (complement) [W m-2] |
Benchmark Period Mean (complement) [W m-2] |
Bias [W m-2] |
RMSE [W m-2] |
Phase Shift [months] |
Bias Score [1] |
RMSE Score [1] |
Seasonal Cycle Score [1] |
Spatial Distribution Score [1] |
Overall Score [1] |
|||
|---|---|---|---|---|---|---|---|---|---|---|---|---|---|---|---|---|
| Benchmark | [-] | 36.2 | ||||||||||||||
| I123pd | [-] | 42.7 | 42.7 | 36.6 | 12.0 | 5.18 | 7.92 | 0.551 | 0.629 | 0.840 | 0.958 | 0.705 | 0.795 | |||
| post5.4 | [-] | 43.4 | 43.4 | 36.6 | 12.0 | 5.81 | 8.04 | 0.545 | 0.618 | 0.842 | 0.958 | 0.718 | 0.796 |
Download Data |
Period Mean (original grids) [W m-2] |
Model Period Mean (intersection) [W m-2] |
Benchmark Period Mean (intersection) [W m-2] |
Model Period Mean (complement) [W m-2] |
Benchmark Period Mean (complement) [W m-2] |
Bias [W m-2] |
RMSE [W m-2] |
Phase Shift [months] |
Bias Score [1] |
RMSE Score [1] |
Seasonal Cycle Score [1] |
Spatial Distribution Score [1] |
Overall Score [1] |
|||
|---|---|---|---|---|---|---|---|---|---|---|---|---|---|---|---|---|
| Benchmark | [-] | 19.2 | ||||||||||||||
| I123pd | [-] | 28.5 | 28.5 | 19.4 | 11.4 | 8.91 | 11.2 | 0.422 | 0.245 | 0.577 | 0.958 | 0.853 | 0.642 | |||
| post5.4 | [-] | 28.5 | 28.5 | 19.4 | 11.4 | 8.89 | 11.2 | 0.410 | 0.248 | 0.575 | 0.959 | 0.852 | 0.642 |
Download Data |
Period Mean (original grids) [W m-2] |
Model Period Mean (intersection) [W m-2] |
Benchmark Period Mean (intersection) [W m-2] |
Model Period Mean (complement) [W m-2] |
Benchmark Period Mean (complement) [W m-2] |
Bias [W m-2] |
RMSE [W m-2] |
Phase Shift [months] |
Bias Score [1] |
RMSE Score [1] |
Seasonal Cycle Score [1] |
Spatial Distribution Score [1] |
Overall Score [1] |
|||
|---|---|---|---|---|---|---|---|---|---|---|---|---|---|---|---|---|
| Benchmark | [-] | 43.1 | ||||||||||||||
| I123pd | [-] | 48.1 | 48.1 | 43.4 | 15.4 | 3.73 | 12.6 | 0.773 | 0.436 | 0.645 | 0.903 | 0.980 | 0.722 | |||
| post5.4 | [-] | 48.1 | 48.1 | 43.4 | 15.4 | 3.71 | 12.7 | 0.773 | 0.436 | 0.644 | 0.903 | 0.978 | 0.721 |
Download Data |
Period Mean (original grids) [W m-2] |
Model Period Mean (intersection) [W m-2] |
Benchmark Period Mean (intersection) [W m-2] |
Model Period Mean (complement) [W m-2] |
Benchmark Period Mean (complement) [W m-2] |
Bias [W m-2] |
RMSE [W m-2] |
Phase Shift [months] |
Bias Score [1] |
RMSE Score [1] |
Seasonal Cycle Score [1] |
Spatial Distribution Score [1] |
Overall Score [1] |
|||
|---|---|---|---|---|---|---|---|---|---|---|---|---|---|---|---|---|
| Benchmark | [-] | 72.2 | ||||||||||||||
| I123pd | [-] | 80.2 | 79.9 | 72.5 | 12.9 | 4.80 | 12.7 | 0.622 | 0.508 | 0.716 | 0.939 | 0.959 | 0.768 | |||
| post5.4 | [-] | 80.2 | 79.9 | 72.5 | 12.9 | 4.83 | 12.7 | 0.617 | 0.508 | 0.715 | 0.939 | 0.959 | 0.767 |
Download Data |
Period Mean (original grids) [W m-2] |
Model Period Mean (intersection) [W m-2] |
Benchmark Period Mean (intersection) [W m-2] |
Model Period Mean (complement) [W m-2] |
Benchmark Period Mean (complement) [W m-2] |
Bias [W m-2] |
RMSE [W m-2] |
Phase Shift [months] |
Bias Score [1] |
RMSE Score [1] |
Seasonal Cycle Score [1] |
Spatial Distribution Score [1] |
Overall Score [1] |
|||
|---|---|---|---|---|---|---|---|---|---|---|---|---|---|---|---|---|
| Benchmark | [-] | 43.8 | ||||||||||||||
| I123pd | [-] | 39.5 | 39.4 | 43.7 | 45.9 | -3.06 | 15.8 | 0.166 | 0.578 | 0.476 | 0.987 | 0.957 | 0.695 | |||
| post5.4 | [-] | 39.6 | 39.6 | 43.7 | 45.9 | -2.92 | 15.8 | 0.159 | 0.583 | 0.474 | 0.988 | 0.953 | 0.694 |
Download Data |
Period Mean (original grids) [W m-2] |
Model Period Mean (intersection) [W m-2] |
Benchmark Period Mean (intersection) [W m-2] |
Model Period Mean (complement) [W m-2] |
Benchmark Period Mean (complement) [W m-2] |
Bias [W m-2] |
RMSE [W m-2] |
Phase Shift [months] |
Bias Score [1] |
RMSE Score [1] |
Seasonal Cycle Score [1] |
Spatial Distribution Score [1] |
Overall Score [1] |
|||
|---|---|---|---|---|---|---|---|---|---|---|---|---|---|---|---|---|
| Benchmark | [-] | 25.7 | ||||||||||||||
| I123pd | [-] | 39.1 | 39.2 | 26.2 | 11.2 | 12.5 | 14.9 | 1.19 | 0.294 | 0.717 | 0.842 | 0.412 | 0.597 | |||
| post5.4 | [-] | 39.4 | 39.5 | 26.2 | 11.2 | 12.7 | 14.9 | 1.19 | 0.298 | 0.715 | 0.841 | 0.416 | 0.597 |
Download Data |
Period Mean (original grids) [W m-2] |
Model Period Mean (intersection) [W m-2] |
Benchmark Period Mean (intersection) [W m-2] |
Model Period Mean (complement) [W m-2] |
Benchmark Period Mean (complement) [W m-2] |
Bias [W m-2] |
RMSE [W m-2] |
Phase Shift [months] |
Bias Score [1] |
RMSE Score [1] |
Seasonal Cycle Score [1] |
Spatial Distribution Score [1] |
Overall Score [1] |
|||
|---|---|---|---|---|---|---|---|---|---|---|---|---|---|---|---|---|
| Benchmark | [-] | 25.8 | ||||||||||||||
| I123pd | [-] | 32.7 | 32.7 | 25.9 | 11.0 | 6.38 | 8.29 | 0.682 | 0.354 | 0.630 | 0.908 | 0.523 | 0.609 | |||
| post5.4 | [-] | 32.6 | 32.5 | 25.9 | 11.0 | 6.22 | 8.23 | 0.674 | 0.359 | 0.629 | 0.910 | 0.491 | 0.604 |
Download Data |
Period Mean (original grids) [W m-2] |
Model Period Mean (intersection) [W m-2] |
Benchmark Period Mean (intersection) [W m-2] |
Model Period Mean (complement) [W m-2] |
Benchmark Period Mean (complement) [W m-2] |
Bias [W m-2] |
RMSE [W m-2] |
Phase Shift [months] |
Bias Score [1] |
RMSE Score [1] |
Seasonal Cycle Score [1] |
Spatial Distribution Score [1] |
Overall Score [1] |
|||
|---|---|---|---|---|---|---|---|---|---|---|---|---|---|---|---|---|
| Benchmark | [-] | 24.9 | ||||||||||||||
| I123pd | [-] | 29.3 | 29.4 | 24.9 | 8.12 | 4.57 | 10.7 | 0.462 | 0.473 | 0.473 | 0.951 | 0.862 | 0.646 | |||
| post5.4 | [-] | 29.4 | 29.5 | 24.9 | 8.12 | 4.63 | 10.8 | 0.467 | 0.462 | 0.467 | 0.950 | 0.846 | 0.639 |
Download Data |
Period Mean (original grids) [W m-2] |
Model Period Mean (intersection) [W m-2] |
Benchmark Period Mean (intersection) [W m-2] |
Model Period Mean (complement) [W m-2] |
Benchmark Period Mean (complement) [W m-2] |
Bias [W m-2] |
RMSE [W m-2] |
Phase Shift [months] |
Bias Score [1] |
RMSE Score [1] |
Seasonal Cycle Score [1] |
Spatial Distribution Score [1] |
Overall Score [1] |
|||
|---|---|---|---|---|---|---|---|---|---|---|---|---|---|---|---|---|
| Benchmark | [-] | 38.8 | ||||||||||||||
| I123pd | [-] | 37.2 | 37.2 | 38.8 | 10.6 | -2.00 | 7.17 | 1.16 | 0.578 | 0.670 | 0.826 | 0.805 | 0.710 | |||
| post5.4 | [-] | 37.4 | 37.3 | 38.8 | 10.6 | -1.83 | 7.11 | 1.15 | 0.583 | 0.668 | 0.828 | 0.813 | 0.712 |
Download Data |
Period Mean (original grids) [W m-2] |
Model Period Mean (intersection) [W m-2] |
Benchmark Period Mean (intersection) [W m-2] |
Model Period Mean (complement) [W m-2] |
Benchmark Period Mean (complement) [W m-2] |
Bias [W m-2] |
RMSE [W m-2] |
Phase Shift [months] |
Bias Score [1] |
RMSE Score [1] |
Seasonal Cycle Score [1] |
Spatial Distribution Score [1] |
Overall Score [1] |
|||
|---|---|---|---|---|---|---|---|---|---|---|---|---|---|---|---|---|
| Benchmark | [-] | 26.2 | ||||||||||||||
| I123pd | [-] | 35.2 | 35.2 | 26.3 | 10.6 | 9.09 | 10.0 | 1.54 | 0.235 | 0.731 | 0.783 | 0.919 | 0.680 | |||
| post5.4 | [-] | 35.2 | 35.2 | 26.3 | 10.6 | 9.10 | 10.1 | 1.54 | 0.235 | 0.731 | 0.783 | 0.923 | 0.680 |
Download Data |
Period Mean (original grids) [W m-2] |
Model Period Mean (intersection) [W m-2] |
Benchmark Period Mean (intersection) [W m-2] |
Model Period Mean (complement) [W m-2] |
Benchmark Period Mean (complement) [W m-2] |
Bias [W m-2] |
RMSE [W m-2] |
Phase Shift [months] |
Bias Score [1] |
RMSE Score [1] |
Seasonal Cycle Score [1] |
Spatial Distribution Score [1] |
Overall Score [1] |
|||
|---|---|---|---|---|---|---|---|---|---|---|---|---|---|---|---|---|
| Benchmark | [-] | 30.6 | ||||||||||||||
| I123pd | [-] | 34.2 | 34.2 | 30.8 | 11.8 | 3.21 | 6.33 | 1.03 | 0.577 | 0.758 | 0.879 | 0.469 | 0.688 | |||
| post5.4 | [-] | 34.1 | 34.2 | 30.8 | 11.8 | 3.17 | 6.35 | 1.03 | 0.575 | 0.755 | 0.879 | 0.478 | 0.689 |
Download Data |
Period Mean (original grids) [W m-2] |
Model Period Mean (intersection) [W m-2] |
Benchmark Period Mean (intersection) [W m-2] |
Model Period Mean (complement) [W m-2] |
Benchmark Period Mean (complement) [W m-2] |
Bias [W m-2] |
RMSE [W m-2] |
Phase Shift [months] |
Bias Score [1] |
RMSE Score [1] |
Seasonal Cycle Score [1] |
Spatial Distribution Score [1] |
Overall Score [1] |
|||
|---|---|---|---|---|---|---|---|---|---|---|---|---|---|---|---|---|
| Benchmark | [-] | 29.5 | ||||||||||||||
| I123pd | [-] | 35.8 | 35.7 | 29.7 | 12.3 | 5.69 | 11.1 | 0.735 | 0.425 | 0.695 | 0.924 | 0.697 | 0.687 | |||
| post5.4 | [-] | 36.3 | 36.2 | 29.7 | 12.3 | 6.16 | 11.4 | 0.729 | 0.408 | 0.688 | 0.925 | 0.687 | 0.679 |
Temporally integrated period mean