Mean State
Download Data |
Period Mean (original grids) [Pg yr-1] |
Model Period Mean (intersection) [Pg yr-1] |
Benchmark Period Mean (intersection) [Pg yr-1] |
Model Period Mean (complement) [Pg yr-1] |
Benchmark Period Mean (complement) [Pg yr-1] |
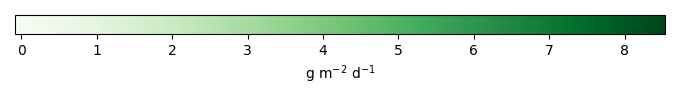
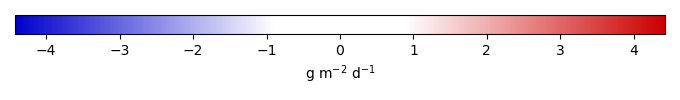
Bias [g m-2 d-1] |
RMSE [g m-2 d-1] |
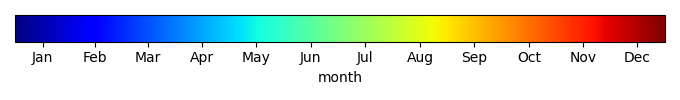
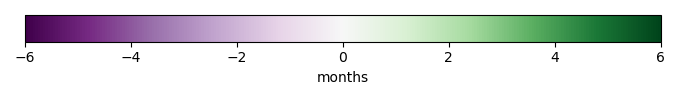
Phase Shift [months] |
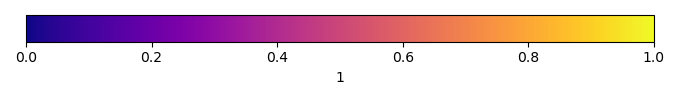
Bias Score [1] |
RMSE Score [1] |
Seasonal Cycle Score [1] |
Spatial Distribution Score [1] |
Overall Score [1] |
|||
|---|---|---|---|---|---|---|---|---|---|---|---|---|---|---|---|---|
| Benchmark | [-] | 114. | ||||||||||||||
| S2S | [-] | 78.9 | 74.5 | 113. | 4.21 | 0.643 | -0.774 | 1.75 | 1.26 | 0.512 | 0.471 | 0.832 | 0.725 | 0.602 | ||
| Smyle_Transient | [-] | 131. | 124. | 113. | 6.54 | 0.643 | 0.450 | 1.65 | 1.09 | 0.500 | 0.455 | 0.856 | 0.955 | 0.644 |
Temporally integrated period mean