Equatorial plots
Contents
Equatorial plots
%%capture
# comment above line to see details about the run(s) displayed
from misc import *
import intake, yaml
%matplotlib inline
---------------------------------------------------------------------------
KeyboardInterrupt                         Traceback (most recent call last)
/glade/derecho/scratch/gmarques/tmp/ipykernel_69783/522025164.py in <module>
      1 # comment above line to see details about the run(s) displayed
----> 2 from misc import *
      3 import intake, yaml
      4 get_ipython().run_line_magic('matplotlib', 'inline')

/glade/work/gmarques/Notebooks/CESM_MOM6/cesm_mom6_progress/007_vs_015_MEKE/notebooks/misc.py in <module>
    133   print(depth_mask.shape)
    134   print(grd[i])
--> 135   basin_code.append(genBasinMasks(grd[i].geolon, grd[i].geolat, depth_mask, xda=True))
    136
    137 # pop grid

/glade/work/gmarques/miniconda/envs/dev2/lib/python3.9/site-packages/mom6_tools-0.0.post296+dirty-py3.9.egg/mom6_tools/m6toolbox.py in genBasinMasks(x, y, depth, verbose, xda)
    601   # points from following regions are not "removed" from wet
    602   code1 = code.copy()
--> 603   wet = ice9(x, y, depth, (0,-35)) # All ocean points seeded from South Atlantic
    604   if verbose: print('Processing Labrador Sea ...')
    605   tmp = wet*((southOf(x, y, (-65.,66.), (-45,66.)))

/glade/work/gmarques/miniconda/envs/dev2/lib/python3.9/site-packages/mom6_tools-0.0.post296+dirty-py3.9.egg/mom6_tools/m6toolbox.py in ice9(x, y, depth, xy0)
    374 def ice9(x, y, depth, xy0):
    375   ji = nearestJI(x, y, xy0[0], xy0[1])
--> 376   return ice9it(ji[1], ji[0], depth)
    377
    378 def ice9Wrapper(x, y, depth, xy0):

/glade/work/gmarques/miniconda/envs/dev2/lib/python3.9/site-packages/mom6_tools-0.0.post296+dirty-py3.9.egg/mom6_tools/m6toolbox.py in ice9it(i, j, depth, minD)
    356   while stack:
    357     (j,i) = stack.pop()
--> 358     if wetMask[j,i] or depth[j,i] <= minD: continue
    359     wetMask[j,i] = 1
    360

KeyboardInterrupt:
# load obs
catalog = intake.open_catalog('/glade/u/home/gmarques/libs/oce-catalogs/reference-datasets.yml')
obs = catalog['woa-2018-tx2_3v2-annual-all'].to_dask()
obs['xh'] = grd[0].xh
obs['yh'] = grd[0].yh
thetao_obs = obs.thetao
salt_obs = obs.so
obs_label = catalog['woa-2018-tx2_3v2-annual-all'].metadata['prefix']+' '+str(catalog['woa-2018-tx2_3v2-annual-all'].metadata['version'])
def plot_comparison(model, var, obs, vmin, vmax, diff, cname):
  fig, ax = plt.subplots(nrows=3, ncols=1,
                       sharex=True,sharey=True,
                       figsize=(12,14))

  ax1 = ax.flatten()

  model[var].plot(ax=ax1[0], ylim=(500,0),
                     y="z_l",vmin=vmin, vmax=vmax,
                     yincrease=False);

  obs.sel(yh=0.,
               method="nearest").plot(ax=ax1[1], ylim=(500, 0),
                                      y="z_l",vmin=vmin, vmax=vmax,
                                      yincrease=False);

  (model[var] - obs.sel(yh=0.,
               method="nearest")).plot(ax=ax1[2], ylim=(500, 0),
                                      y="z_l", cmap="bwr", vmin=-diff, vmax=diff,
                                      yincrease=False);

  ax[0].set_title('Model, casename = {}'.format(cname)); ax[0].set_xlabel('')
  ax[1].set_title('Obs (WOA18)'); ax[1].set_xlabel('')
  ax[2].set_title('Model - Obs'); ax[2].set_xlabel('Longitude');
  return
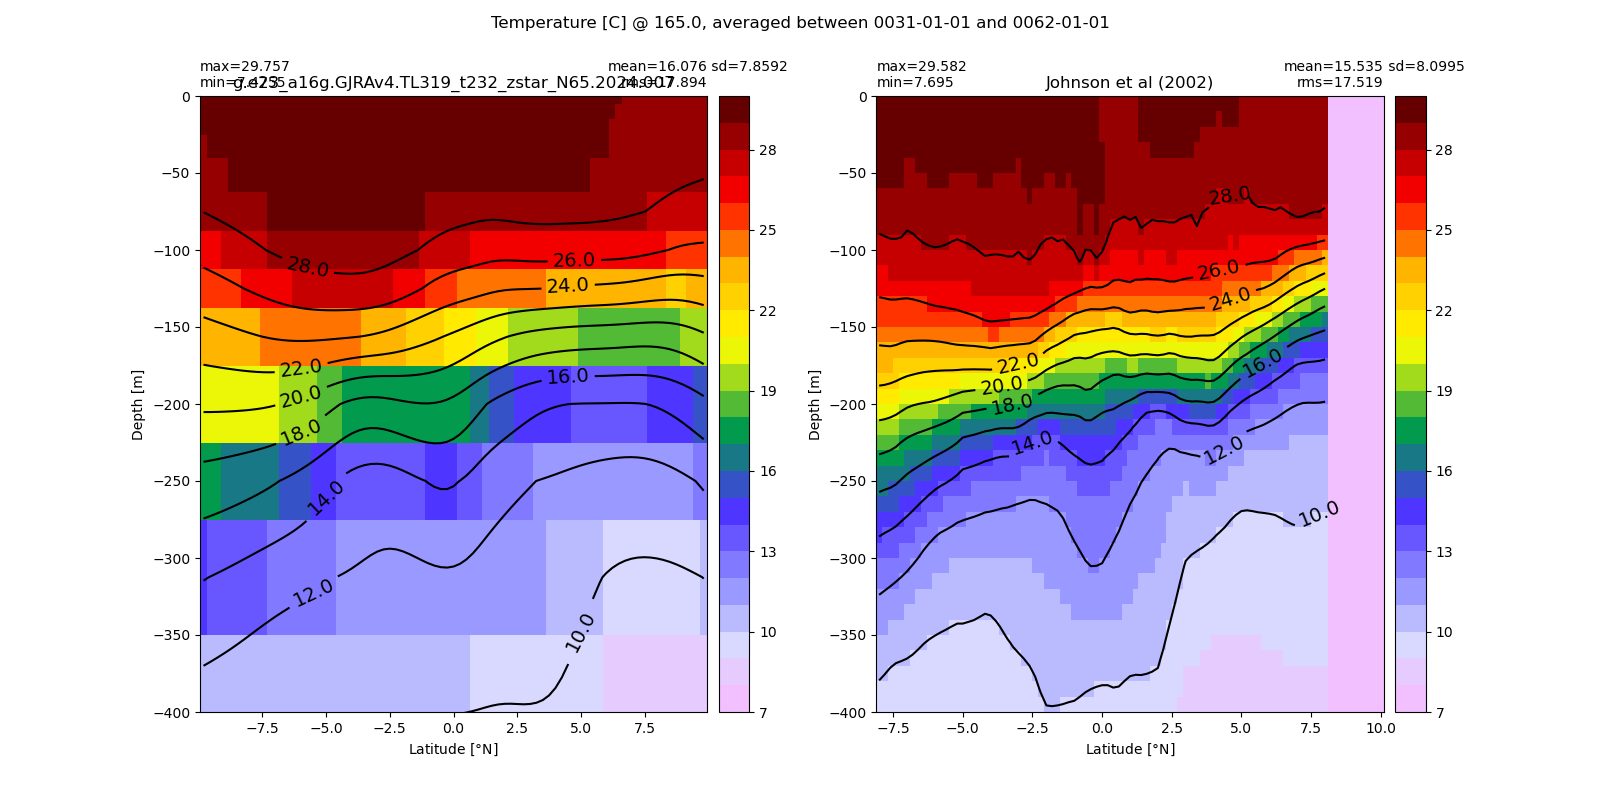
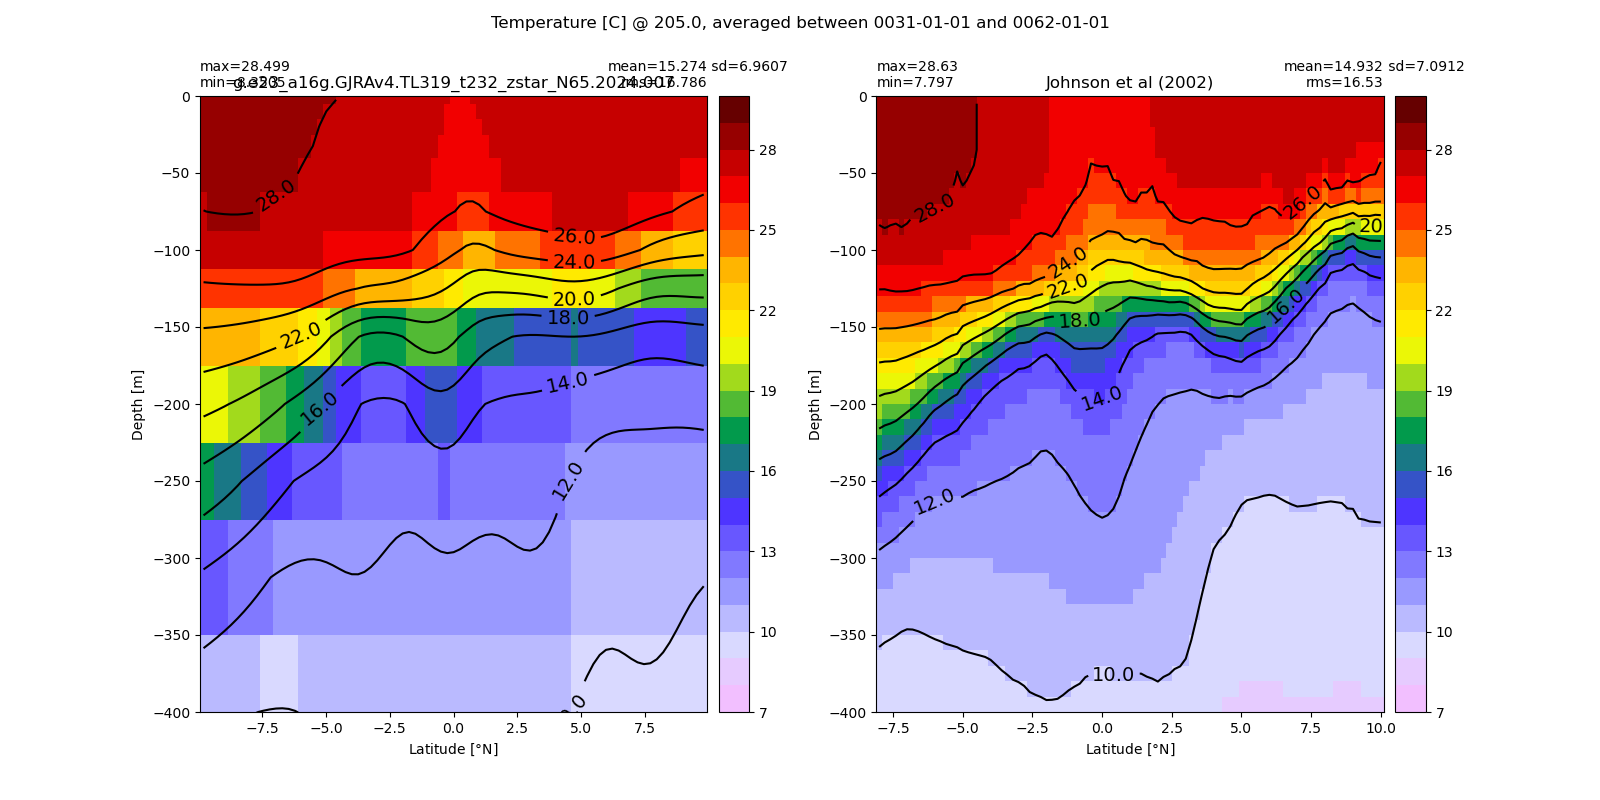
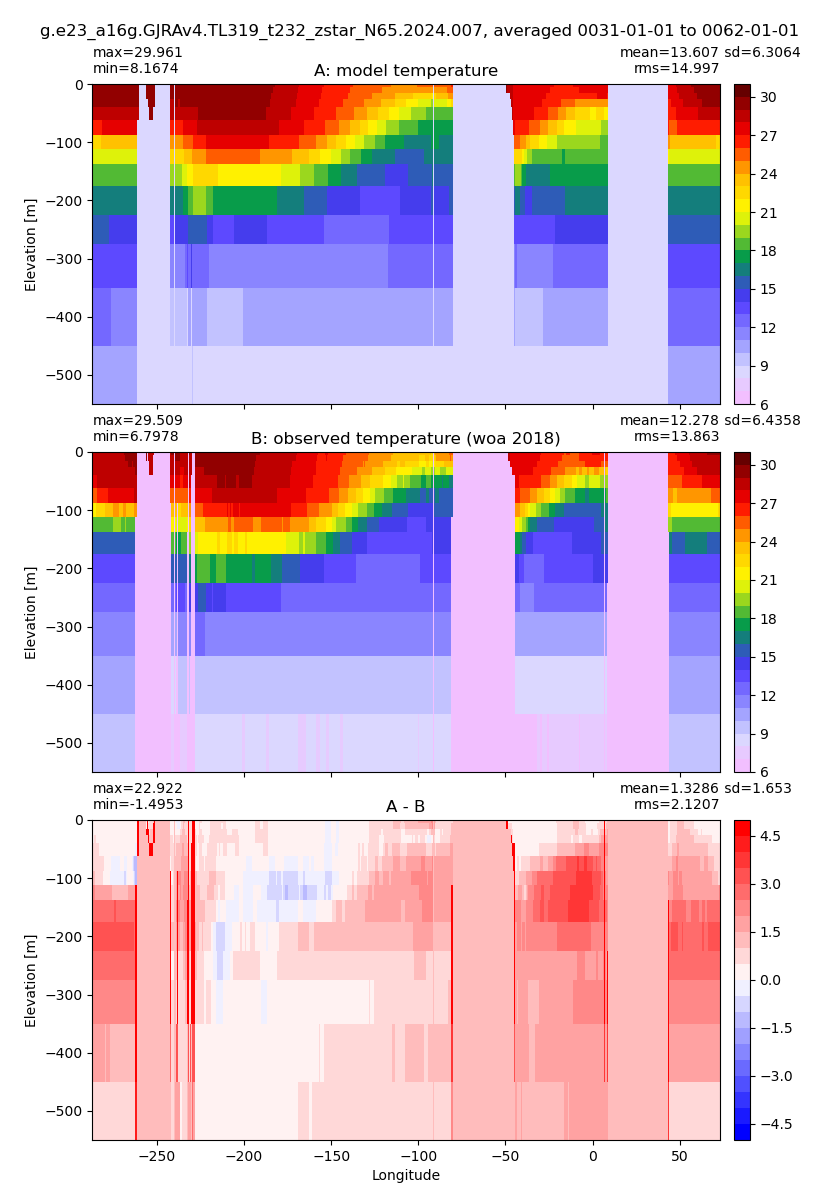
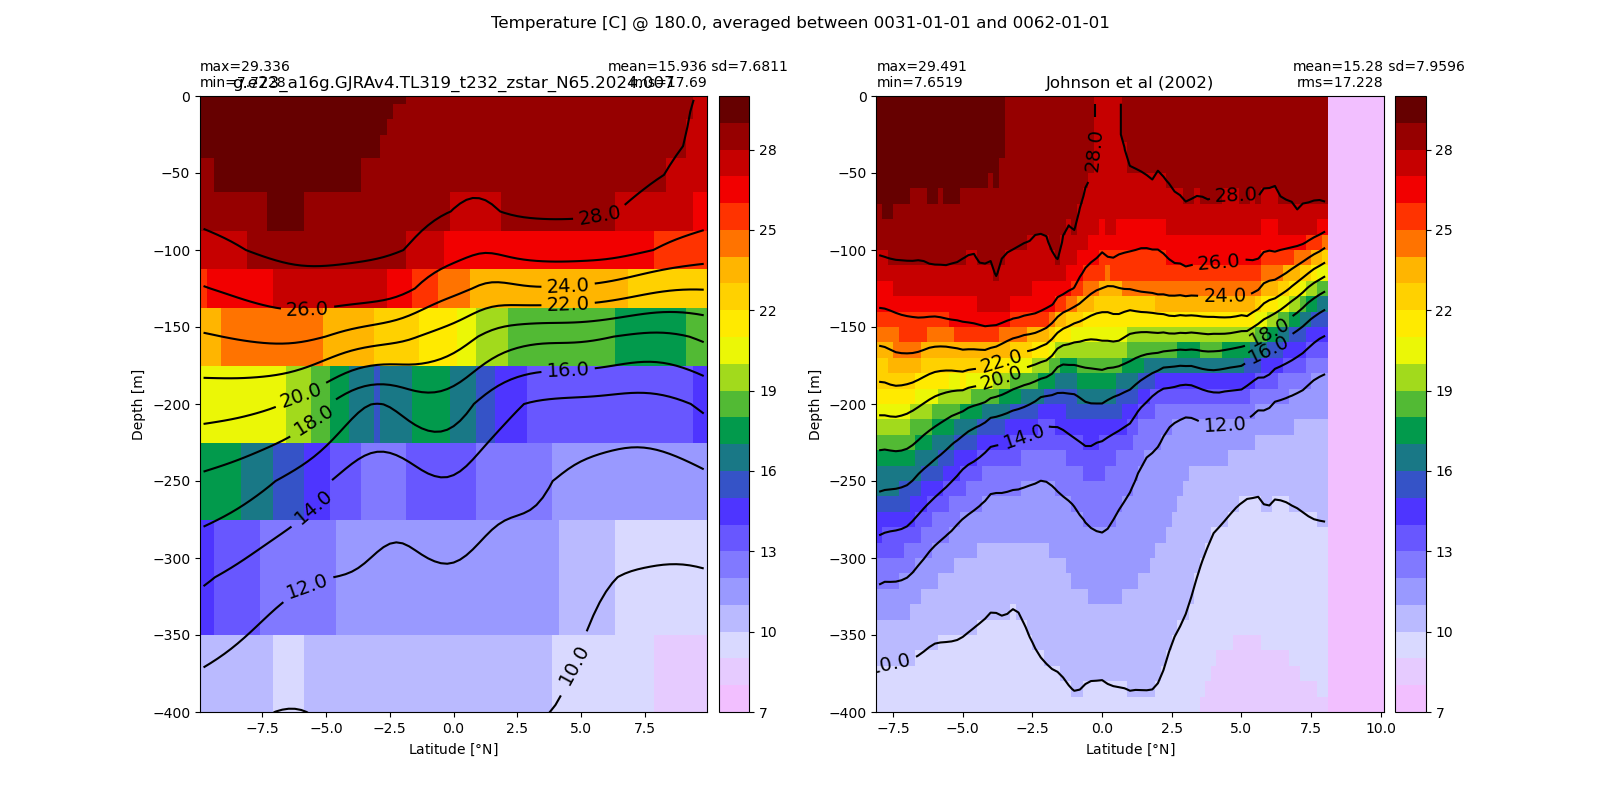
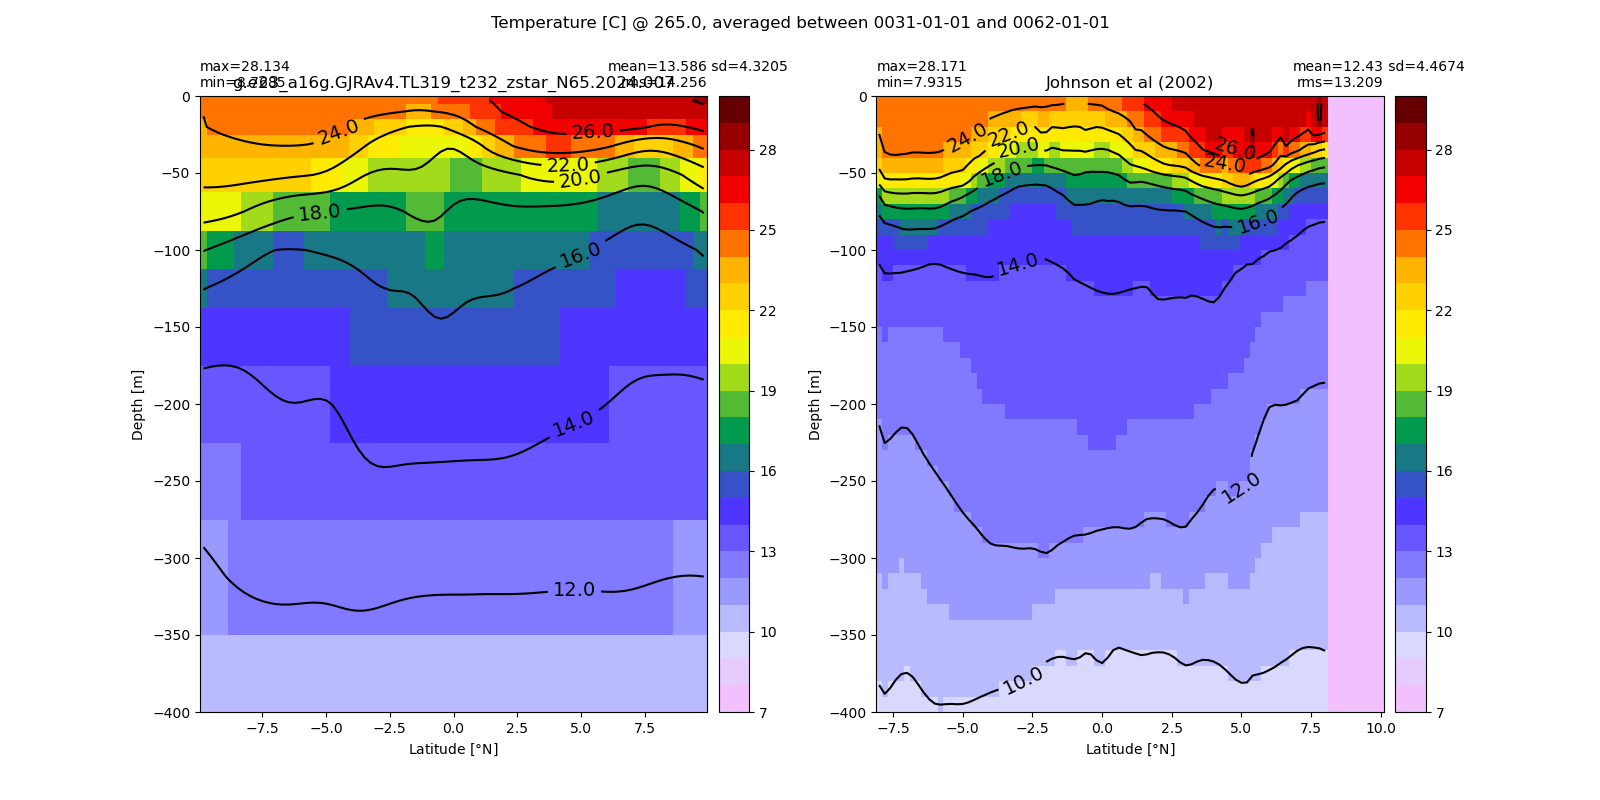
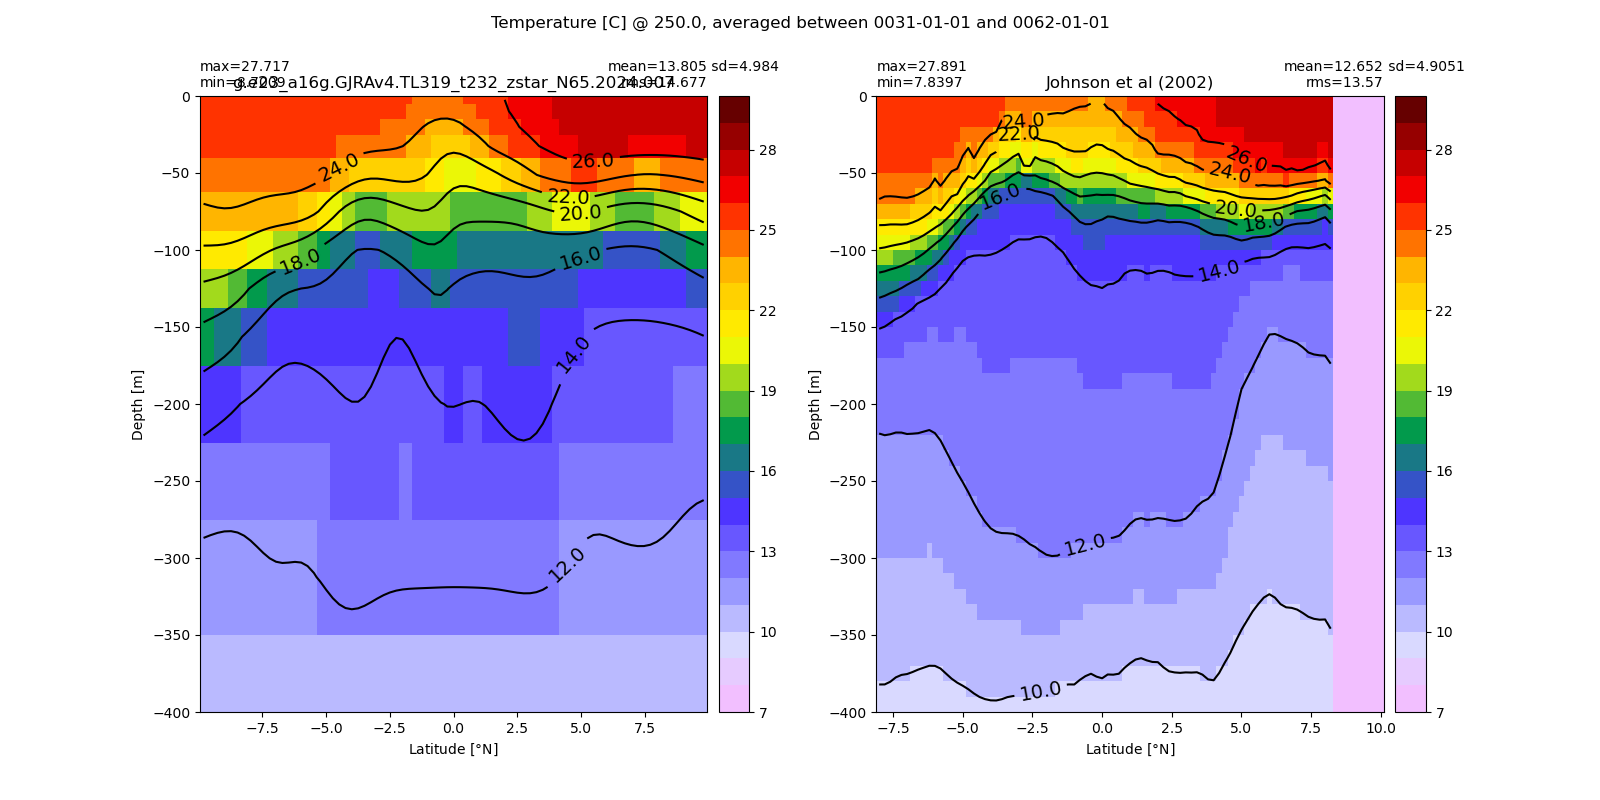
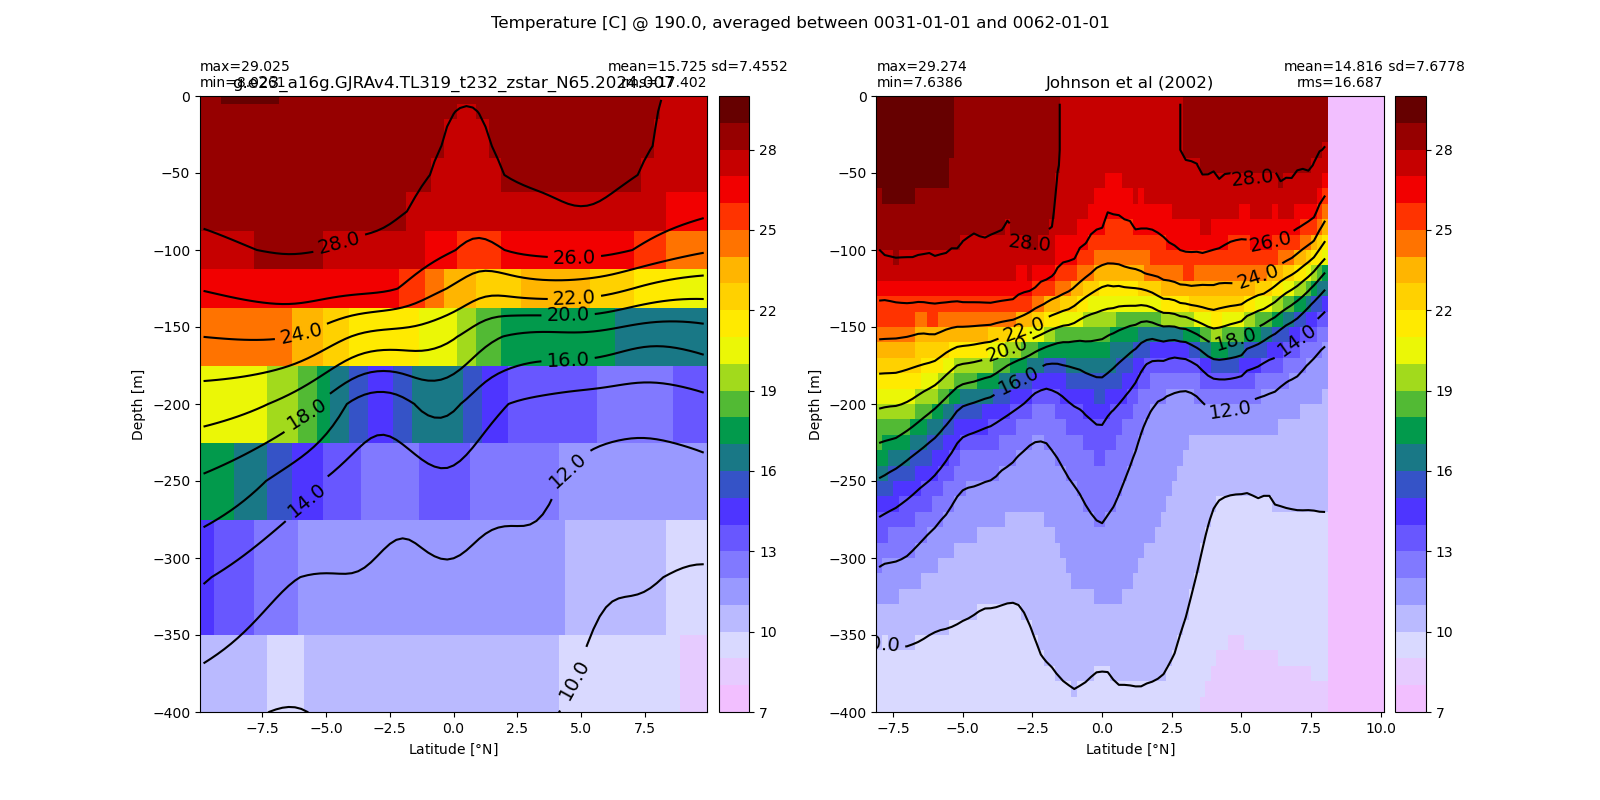
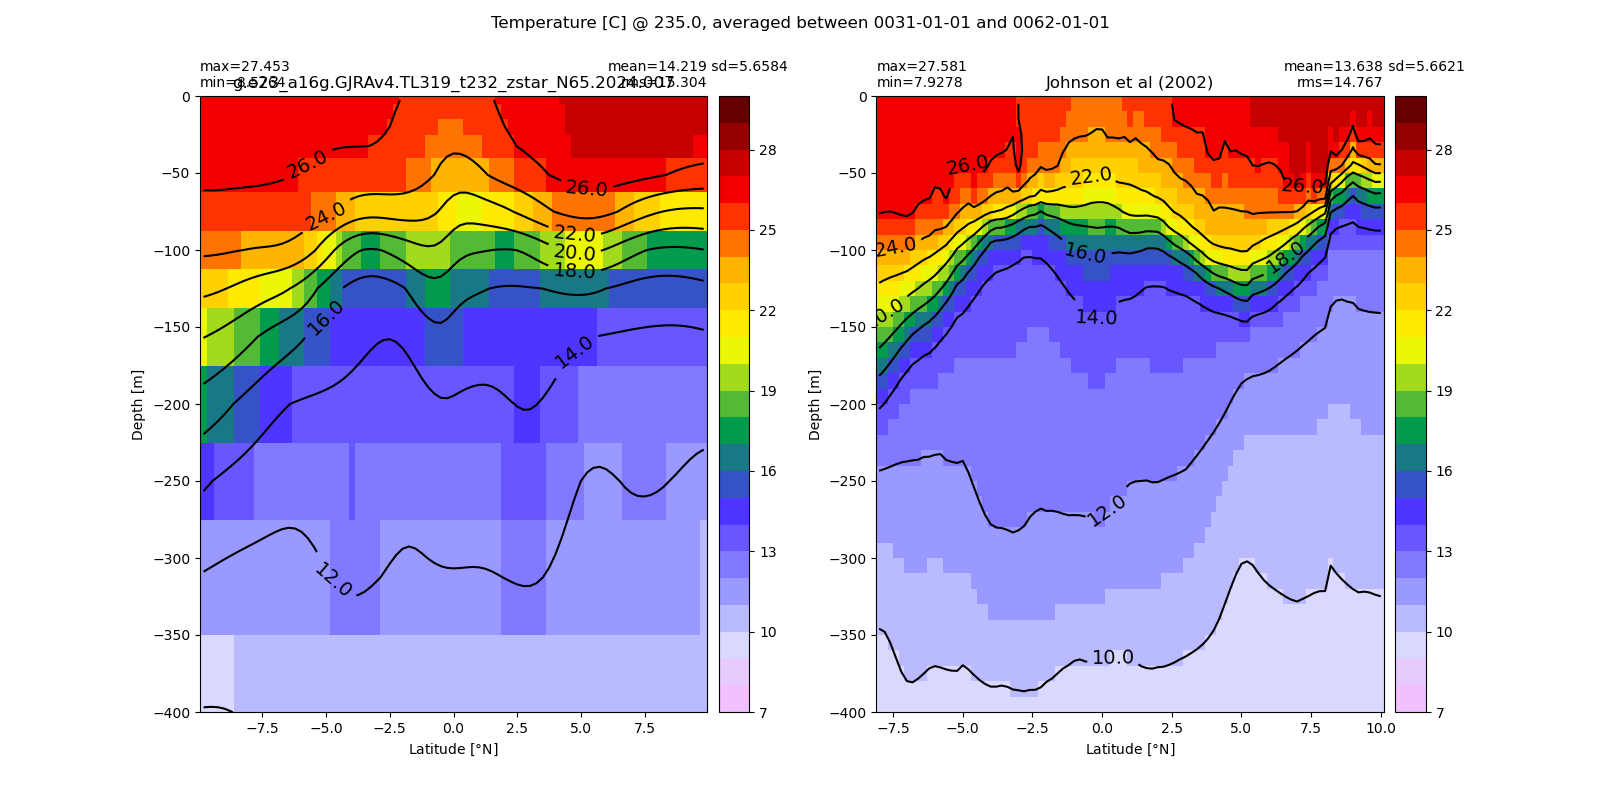
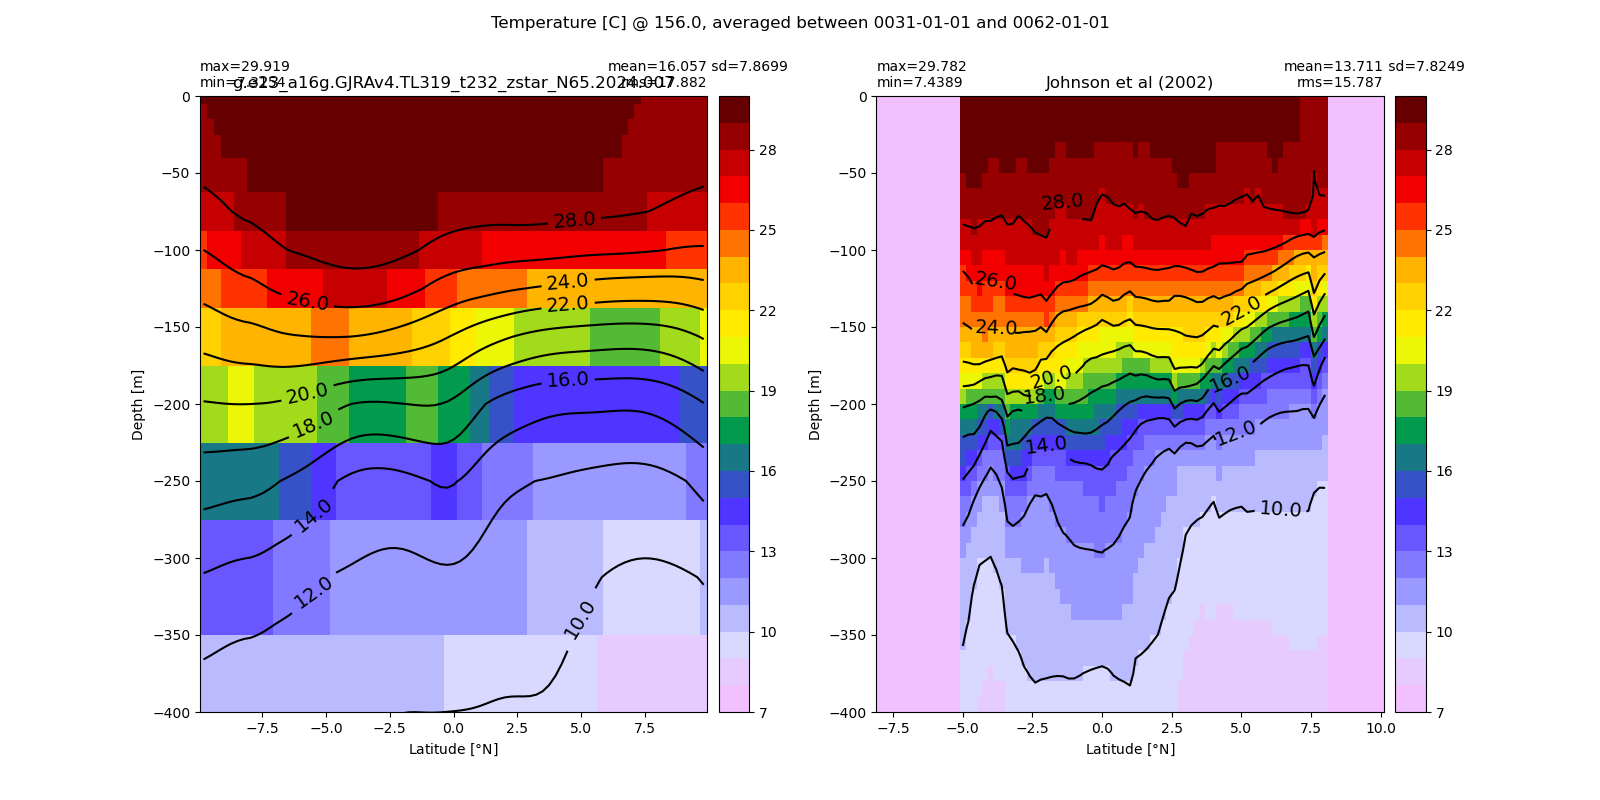
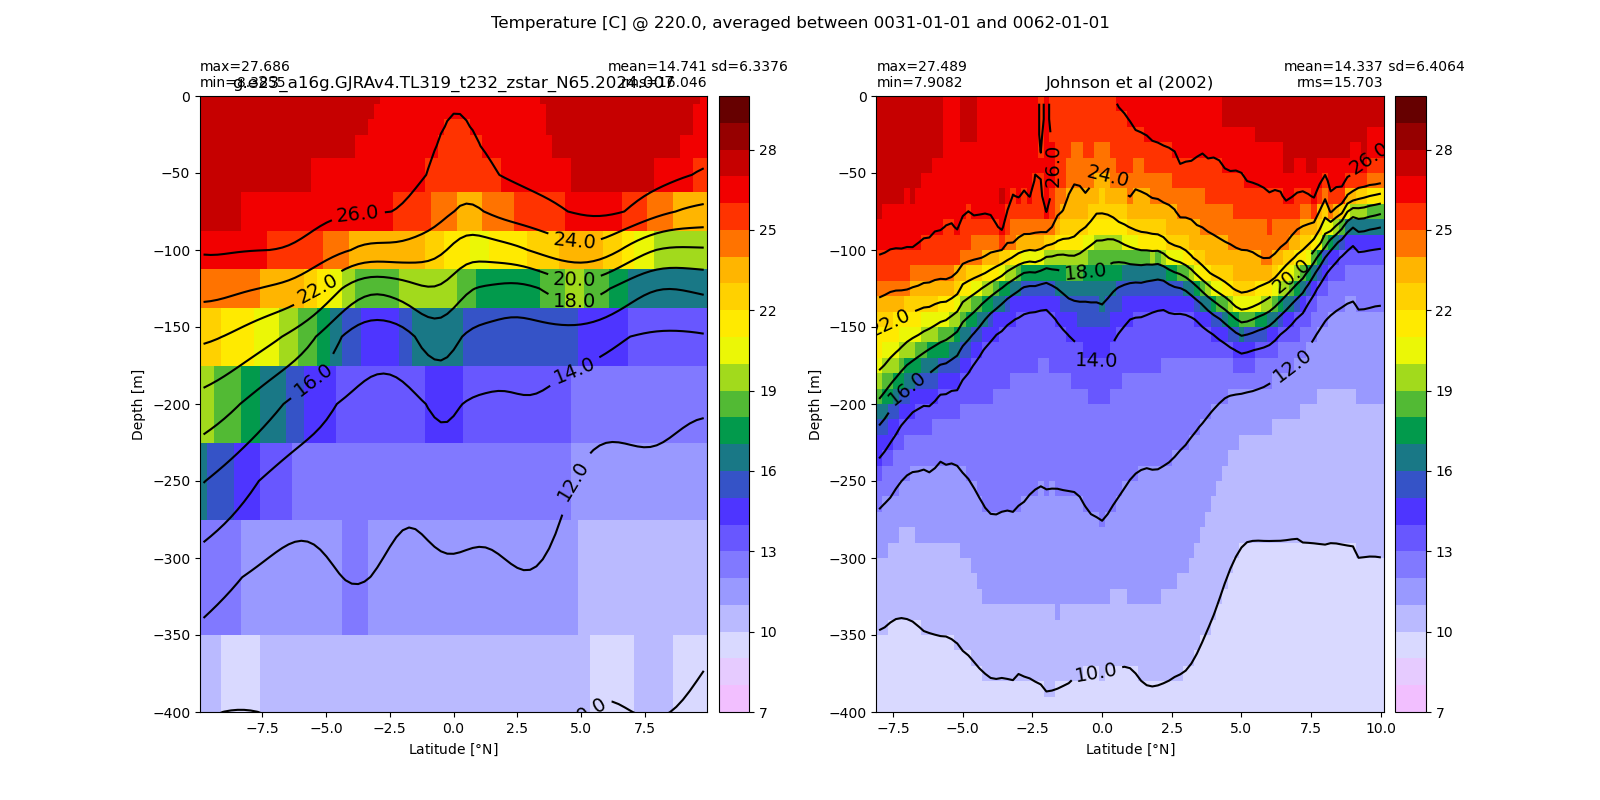
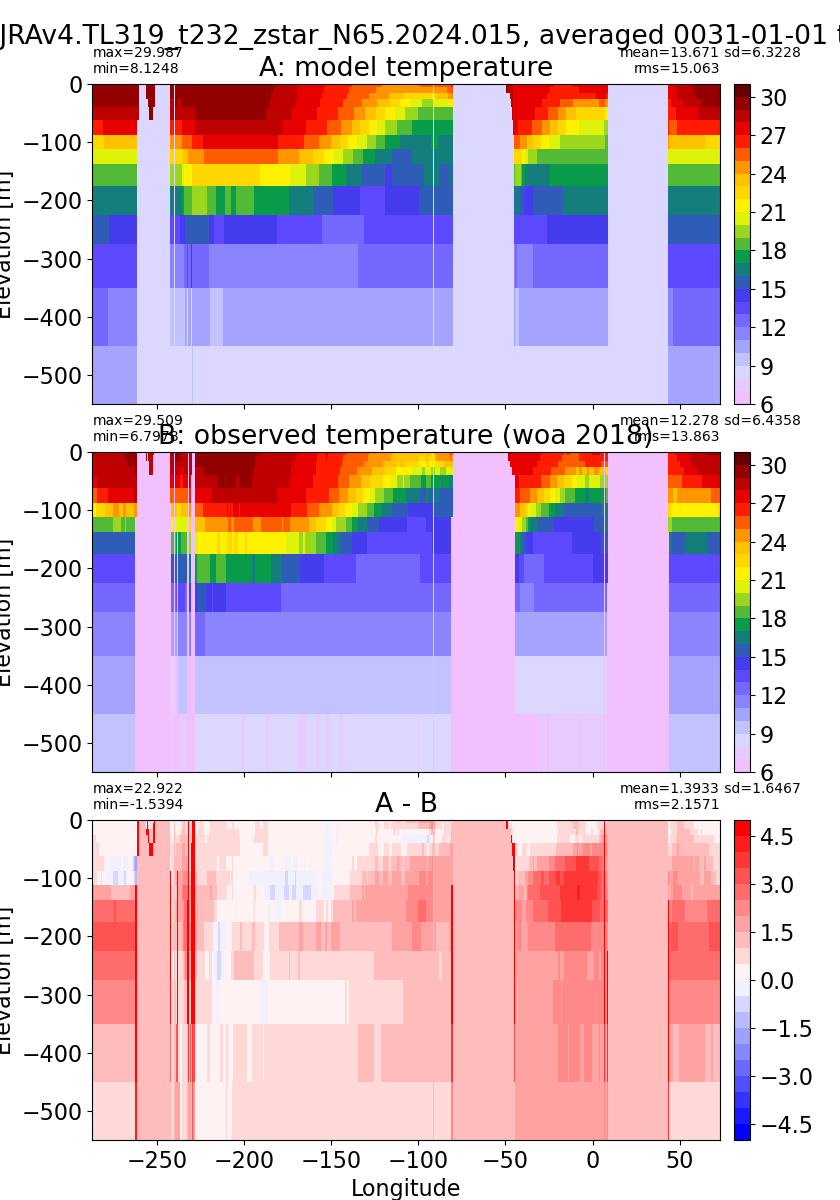
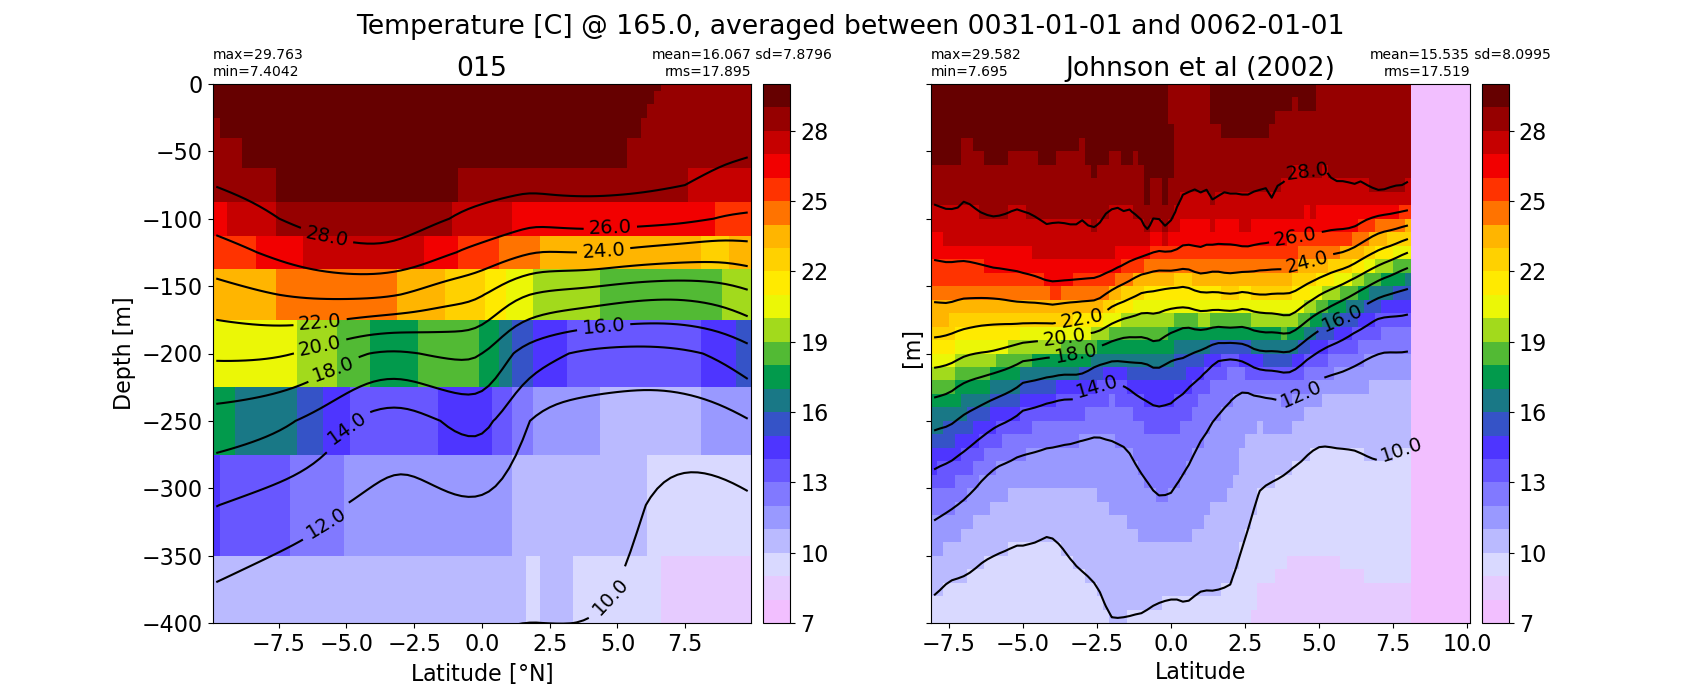
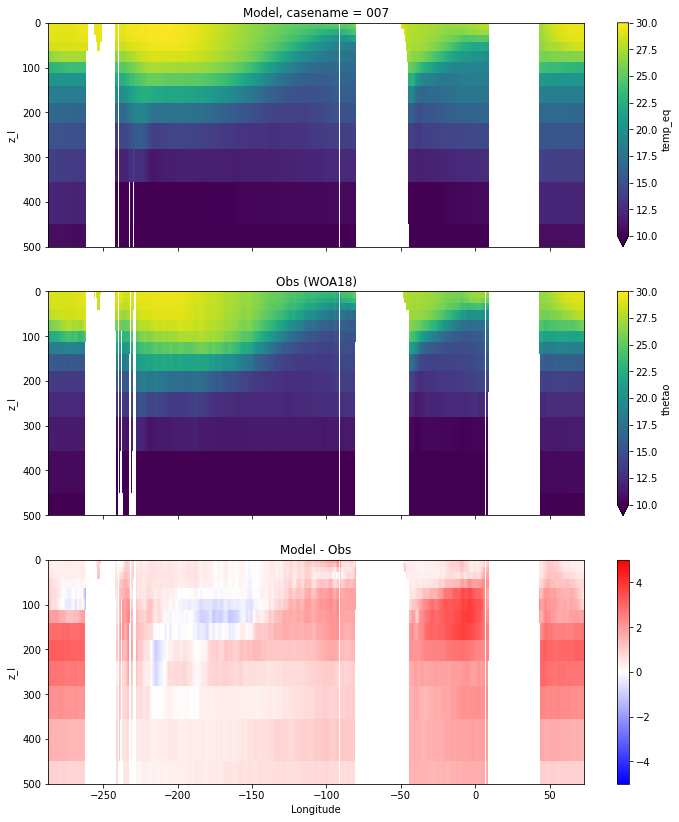
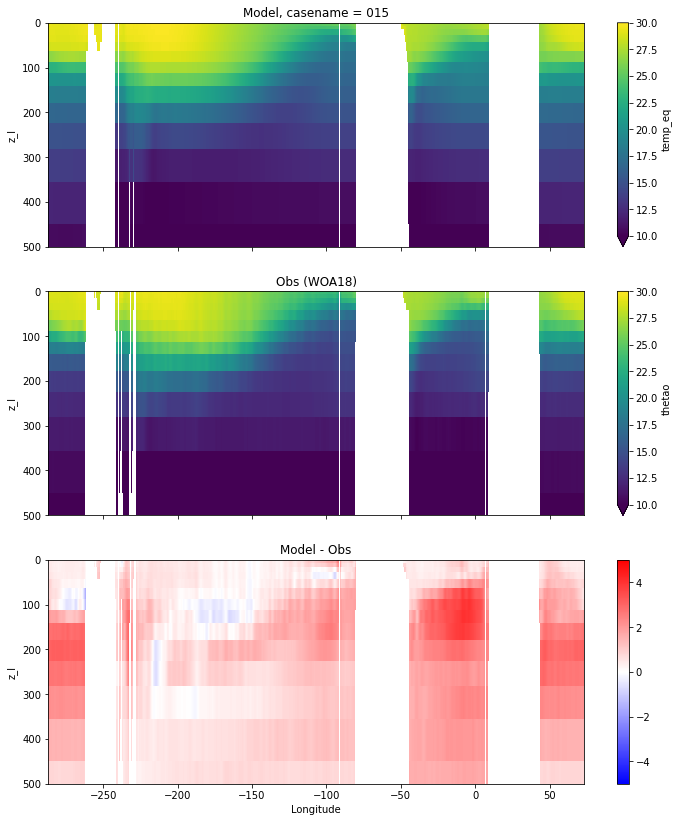
Potential temperature
for path, case, i in zip(ocn_path, casename, range(len(casename))):
  ds_temp = xr.open_dataset(ocn_path[i]+casename[i]+'_temp_eq.nc').rename({'zl':'z_l'})
  plot_comparison(ds_temp,'temp_eq',thetao_obs,10,30,5,label[i])
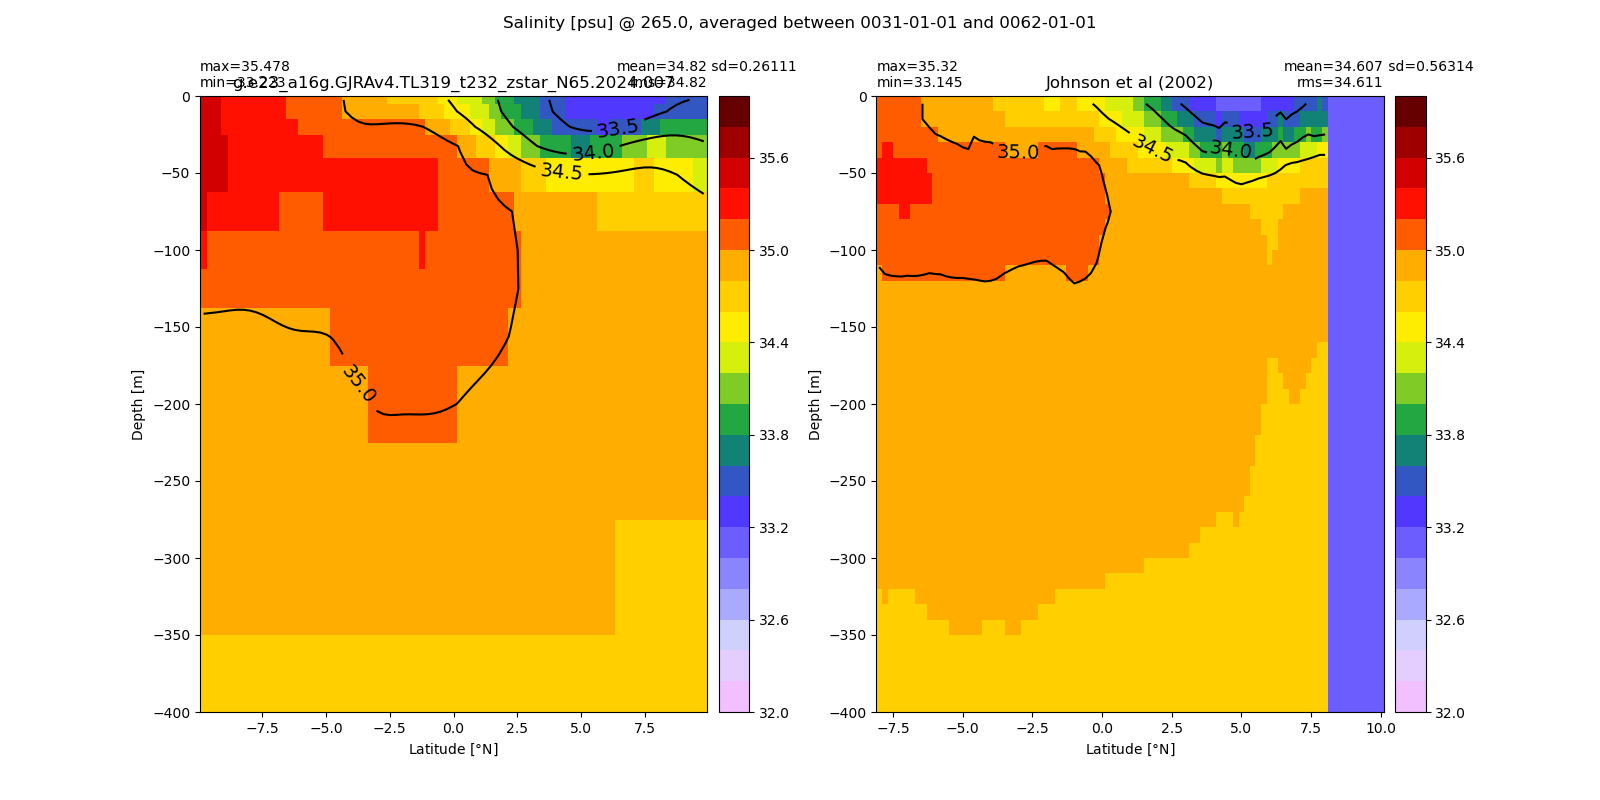
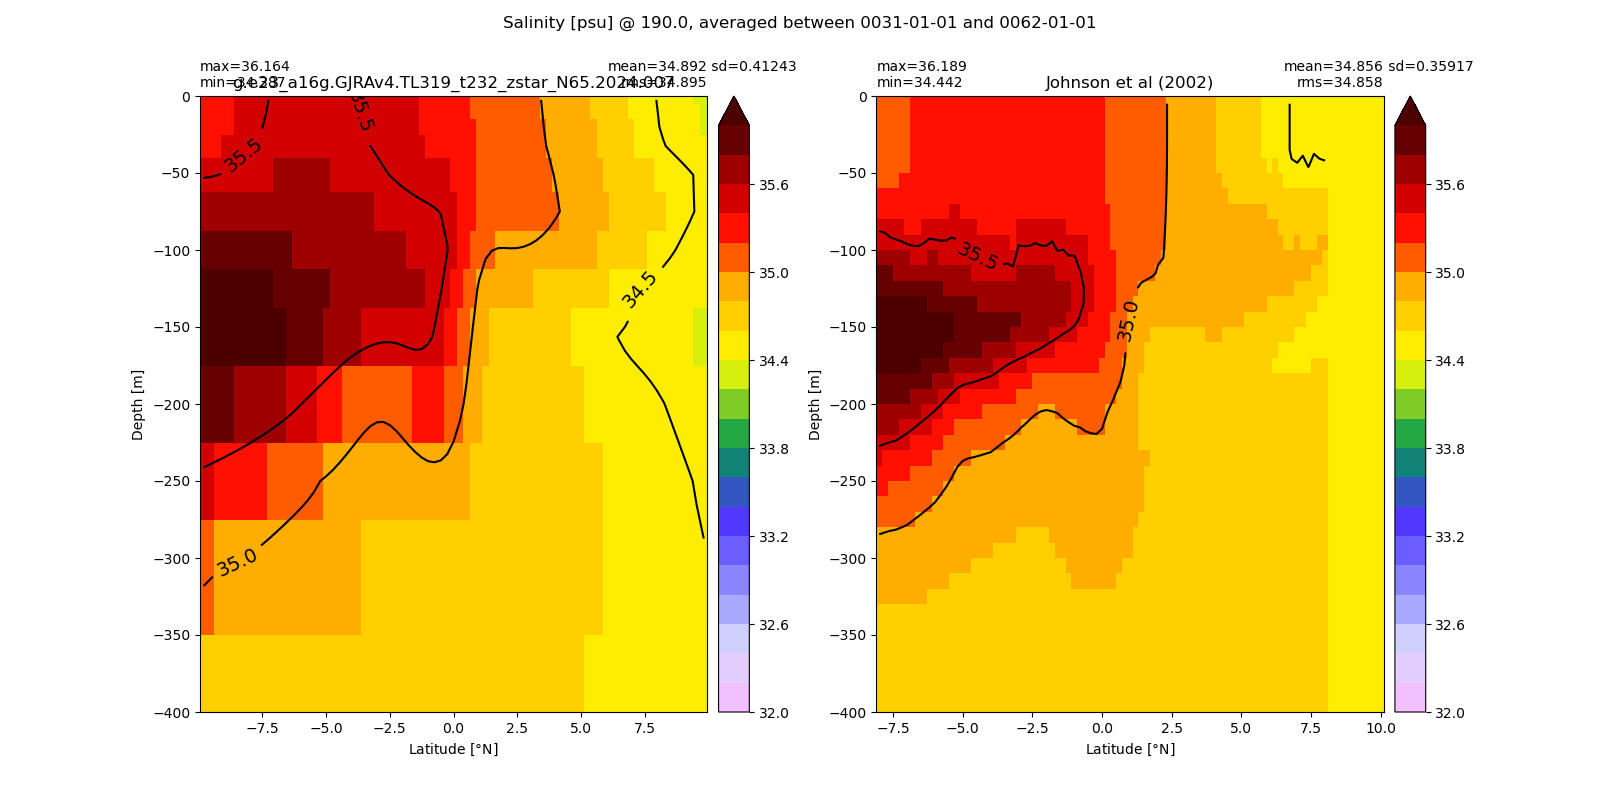
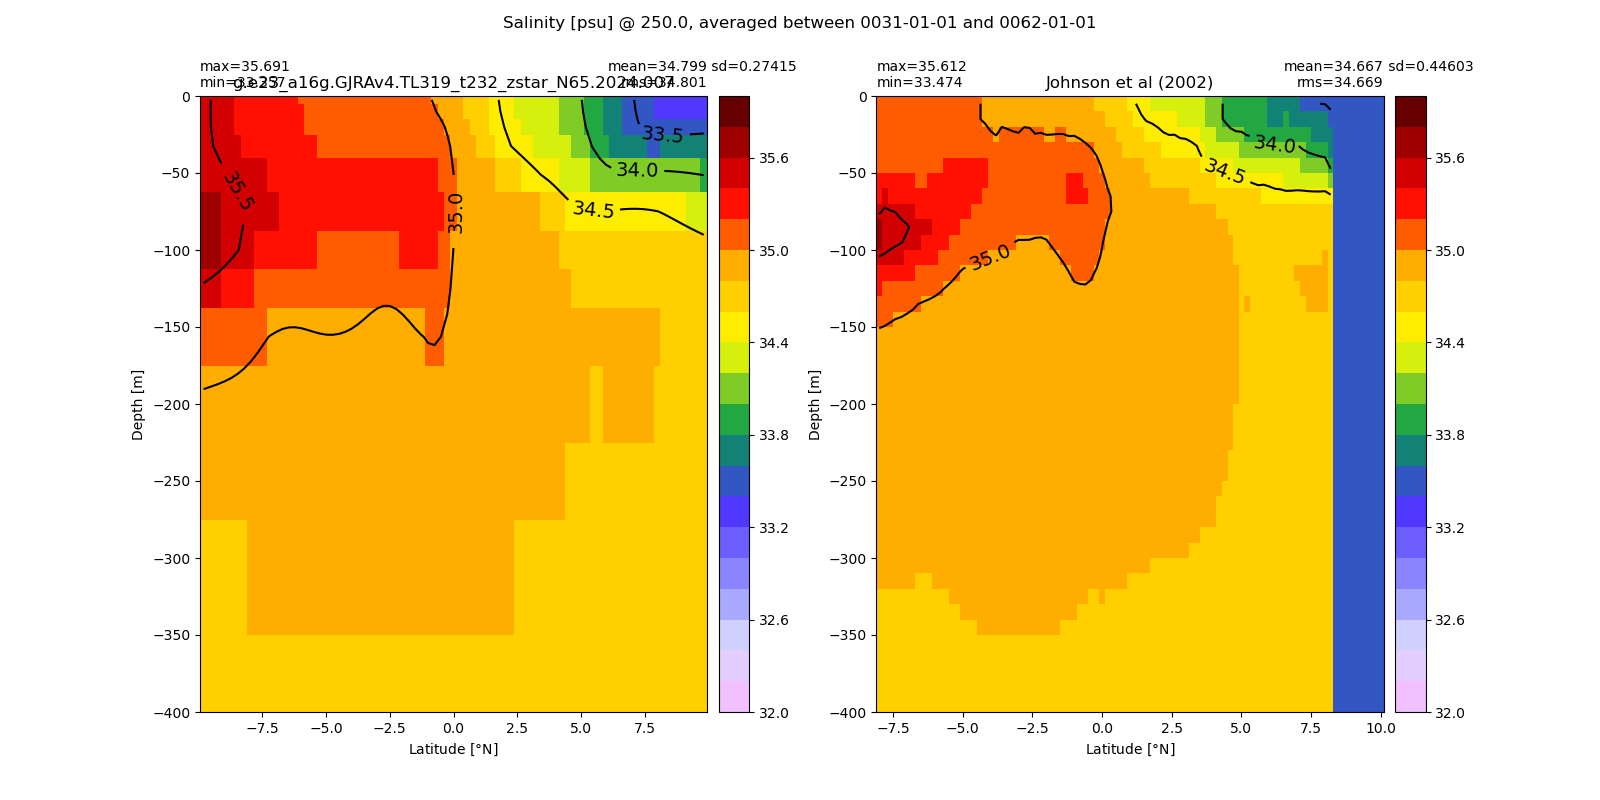
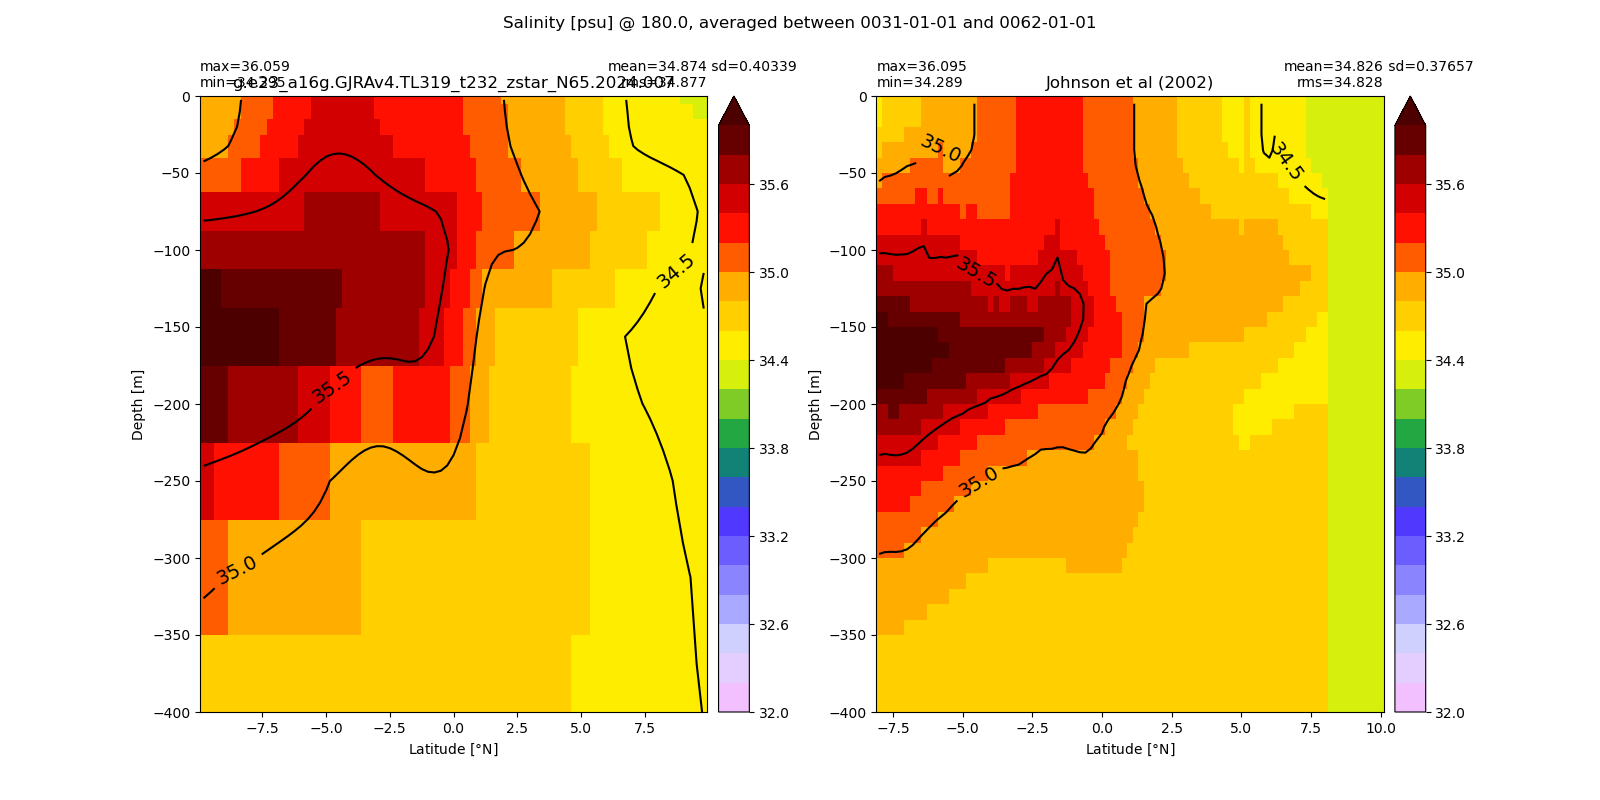
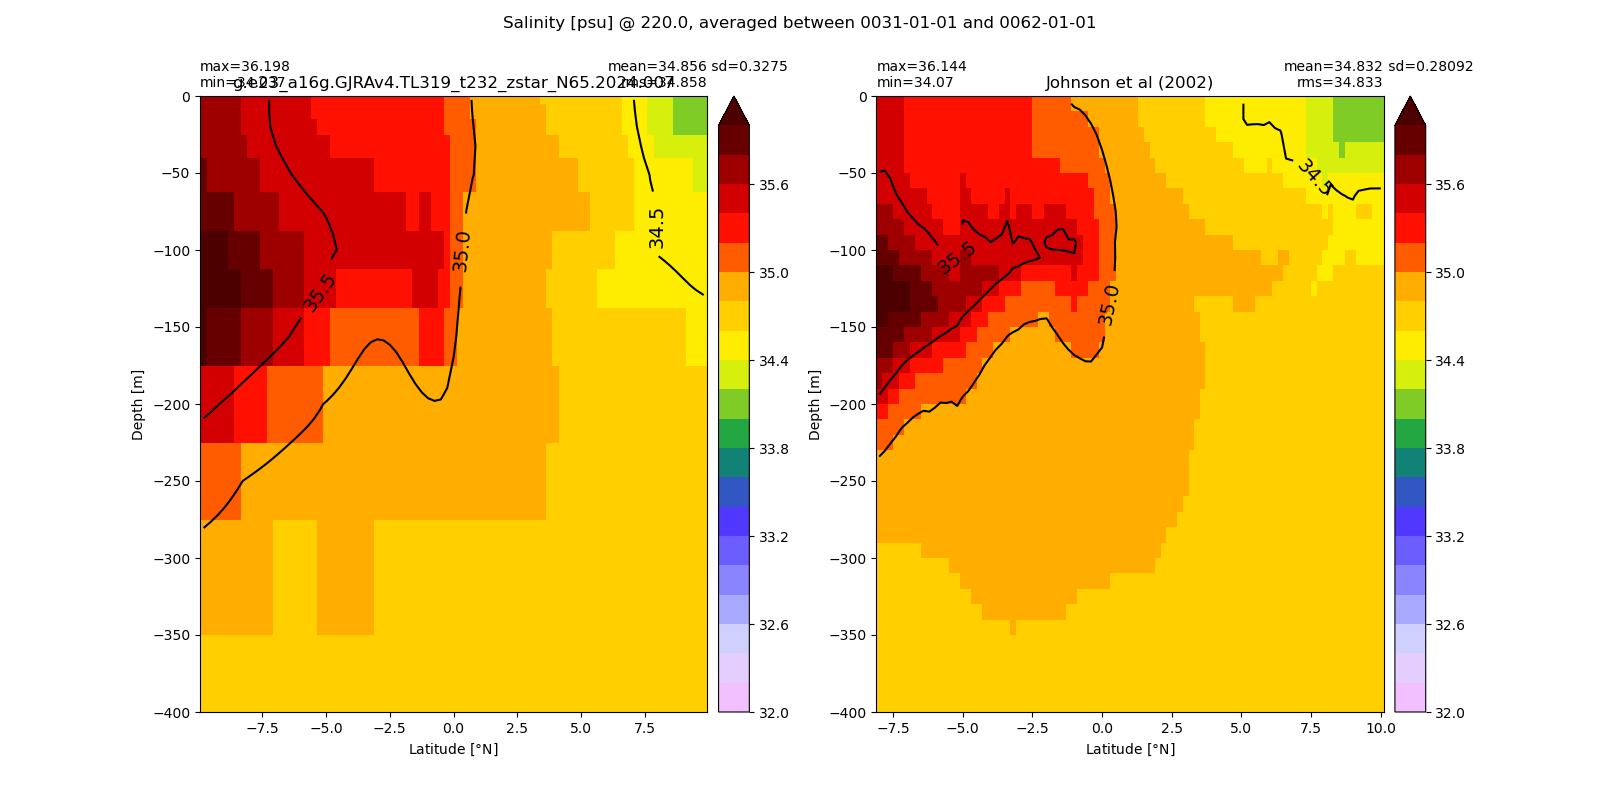
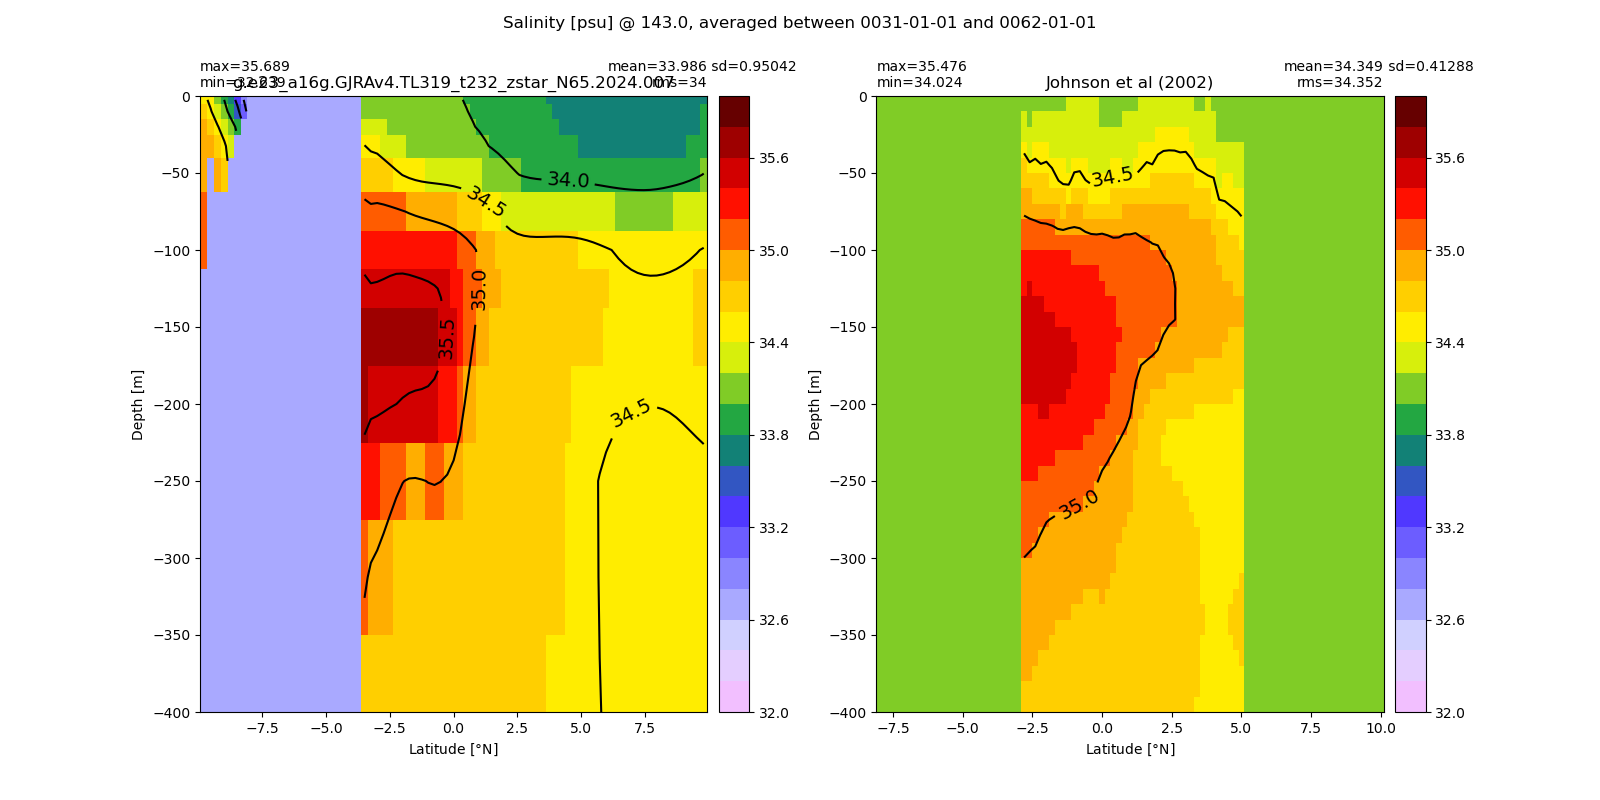
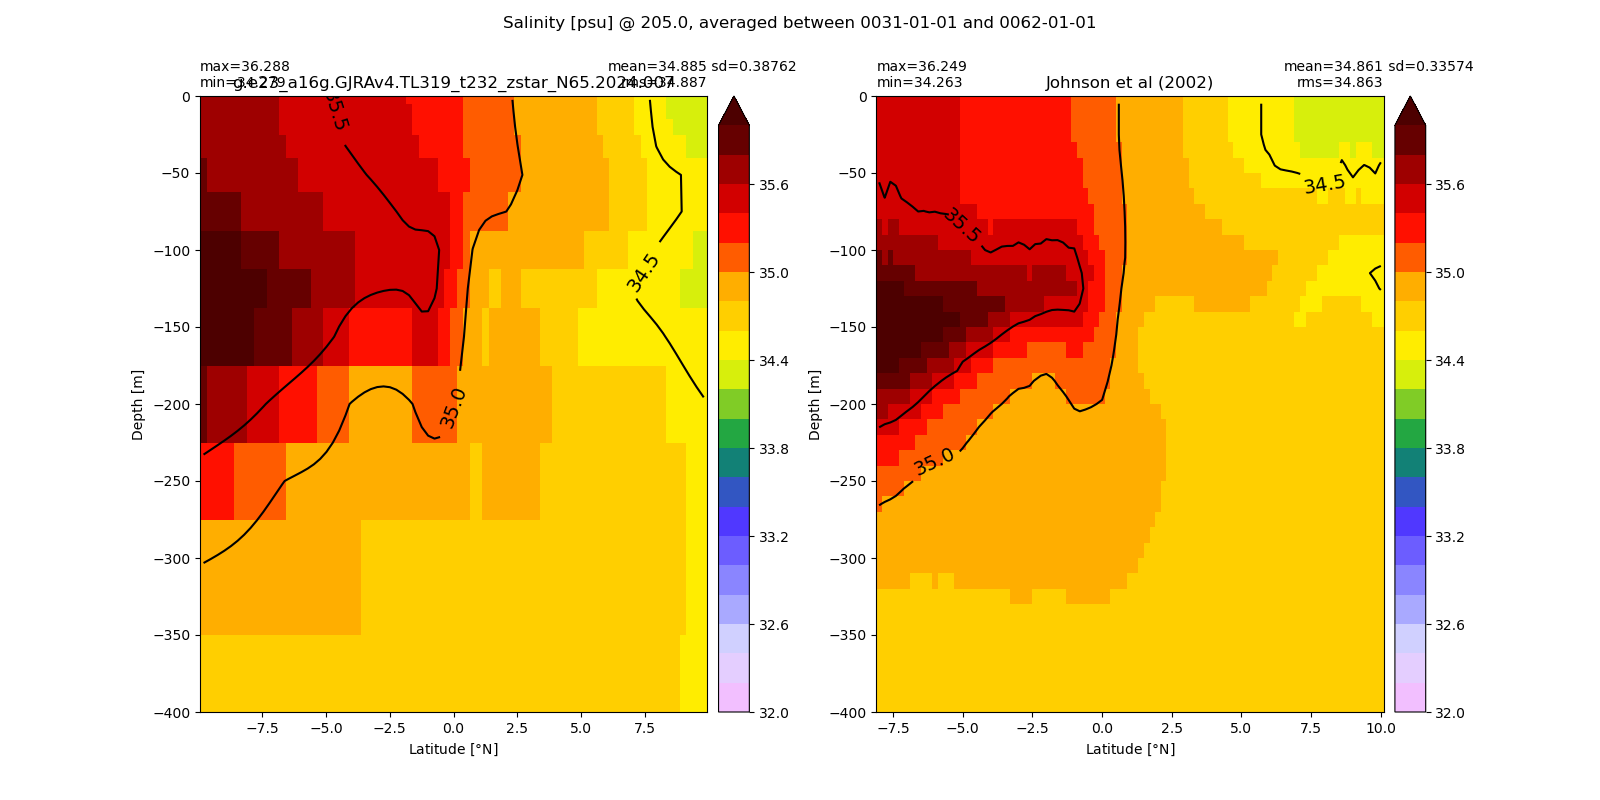
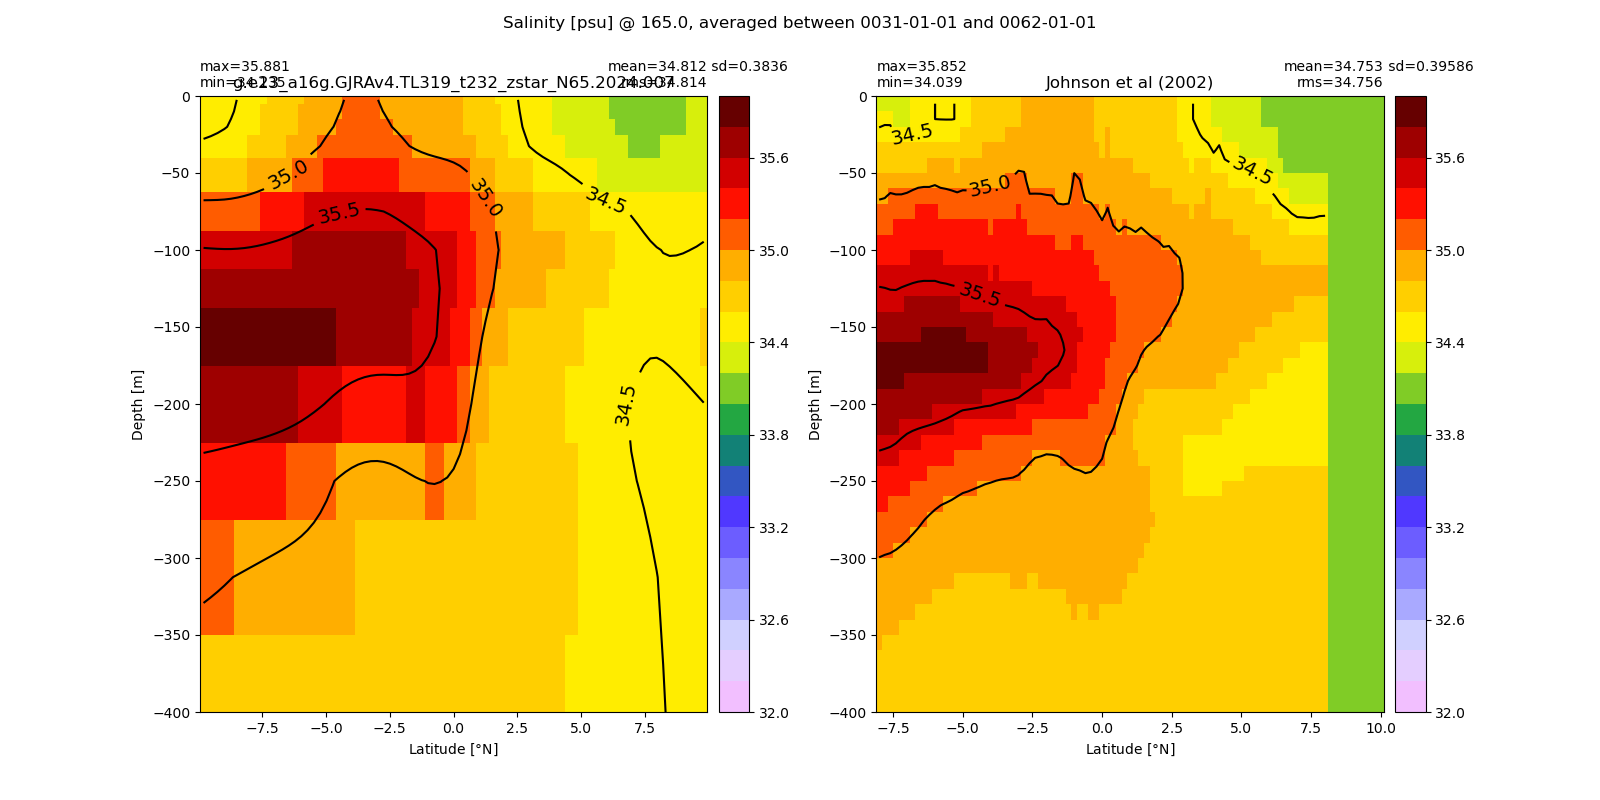
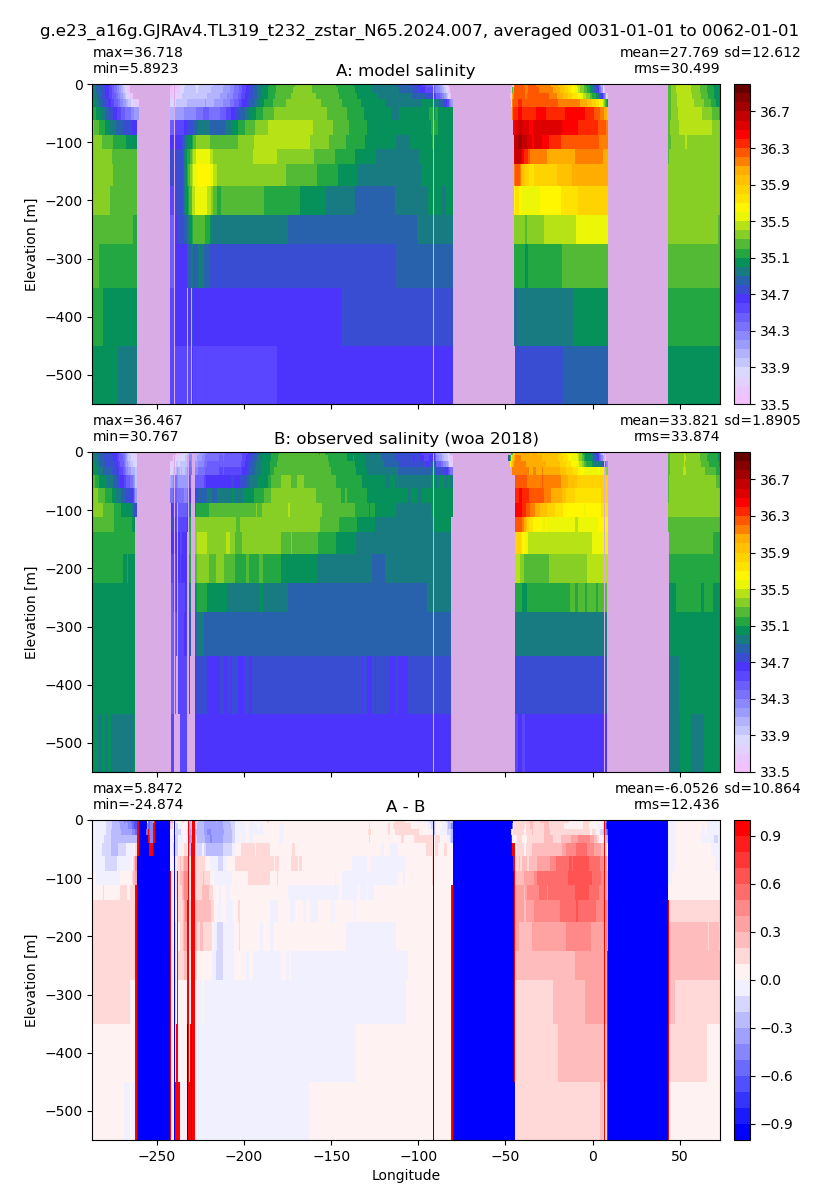
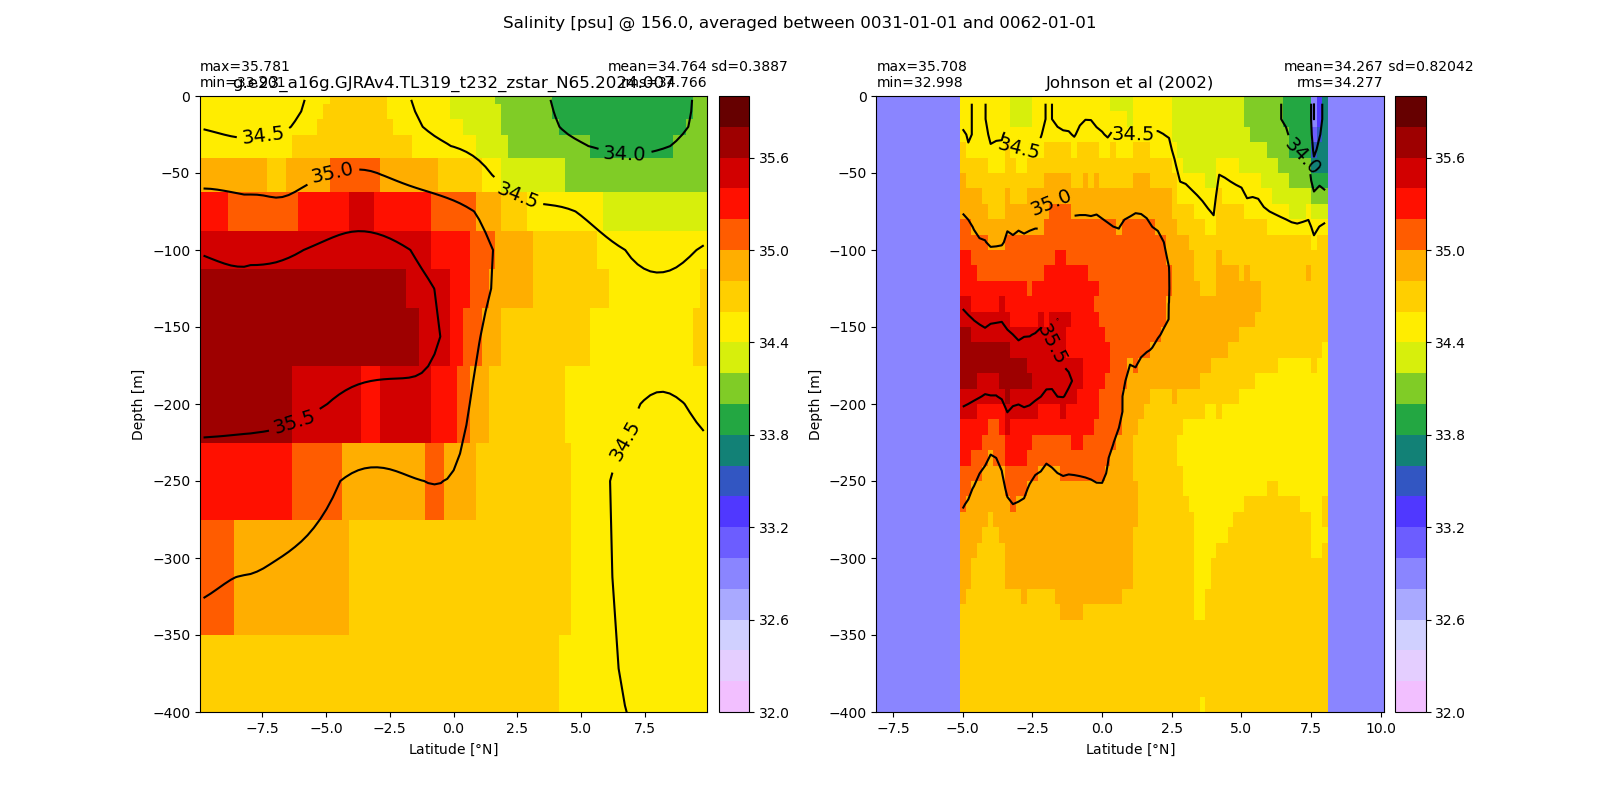
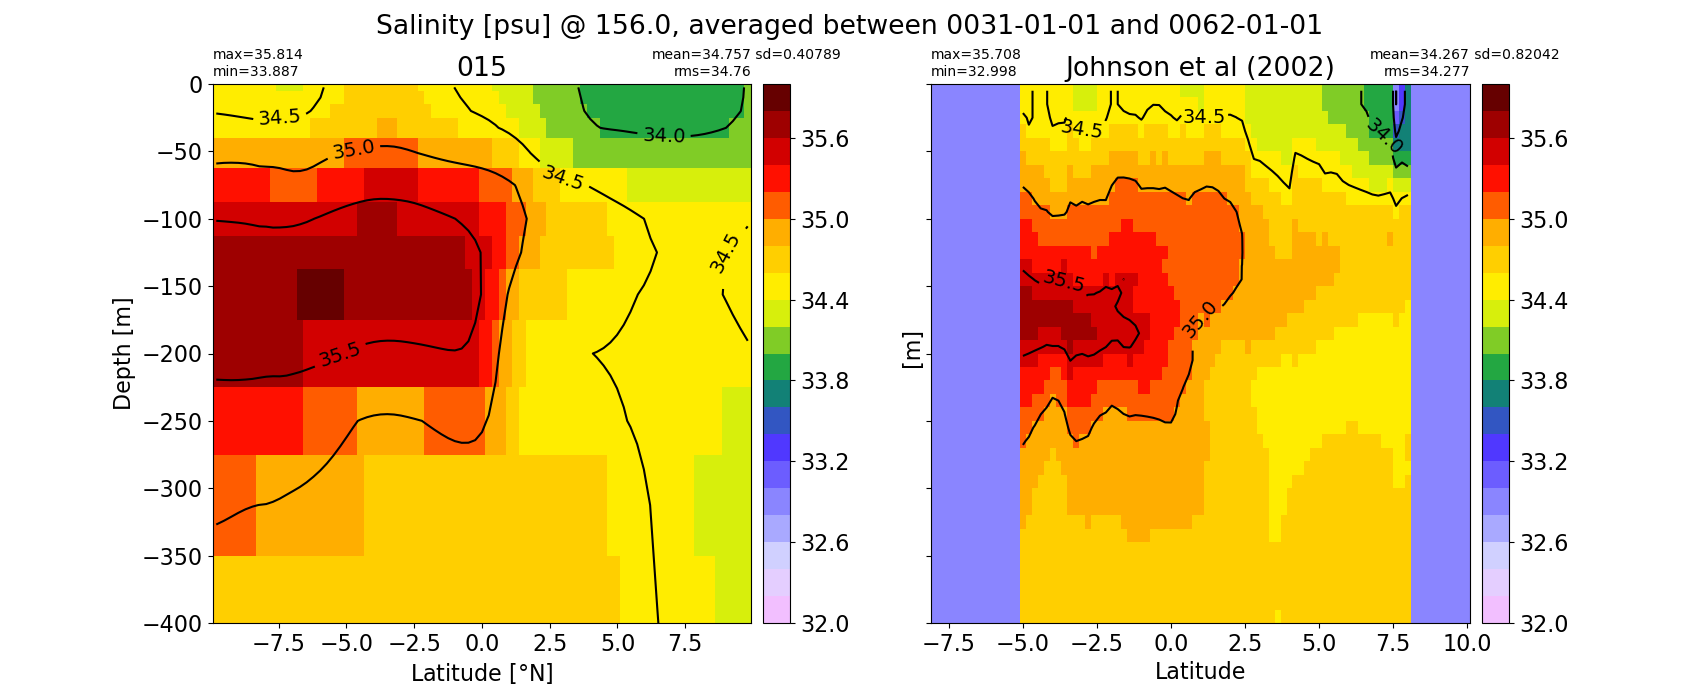
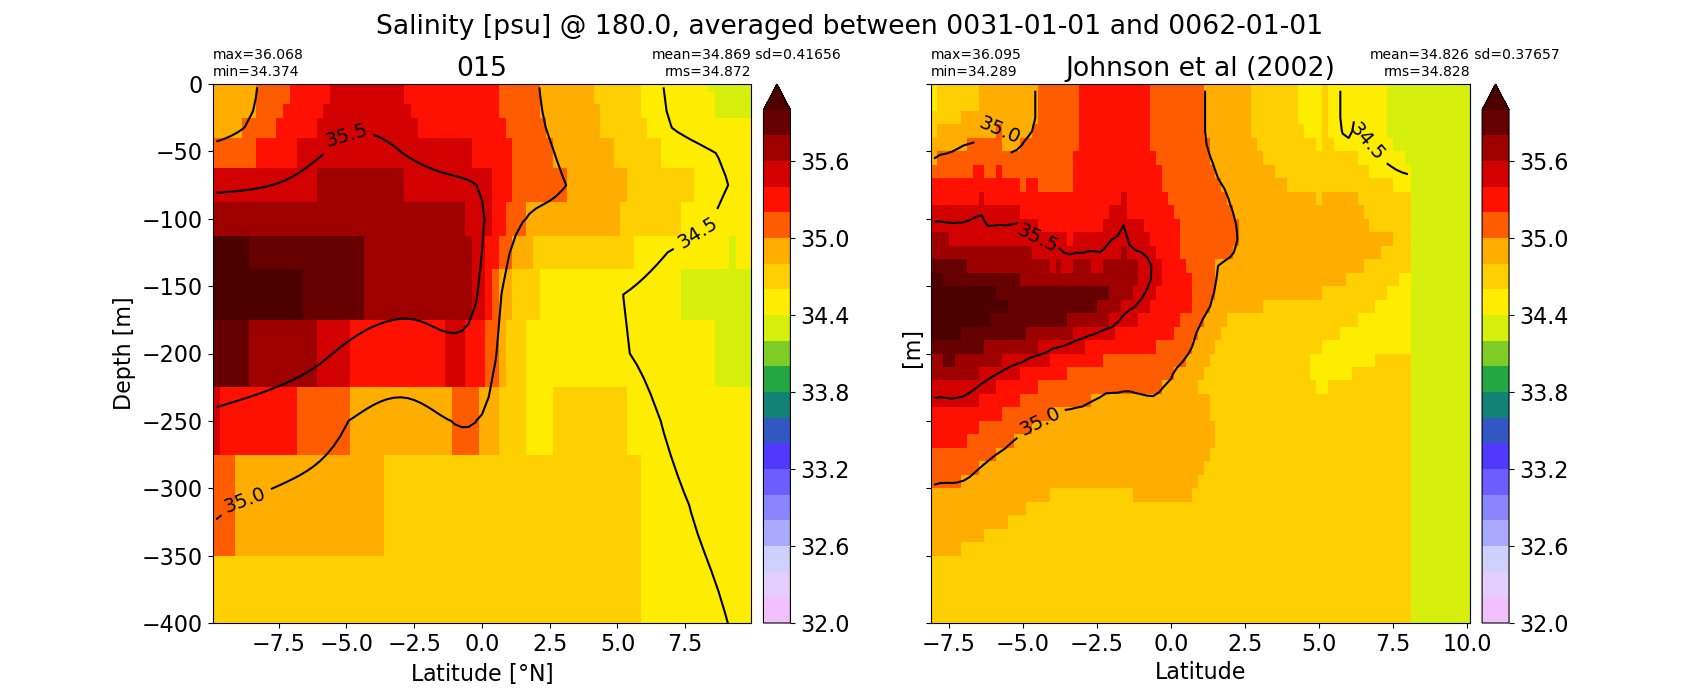
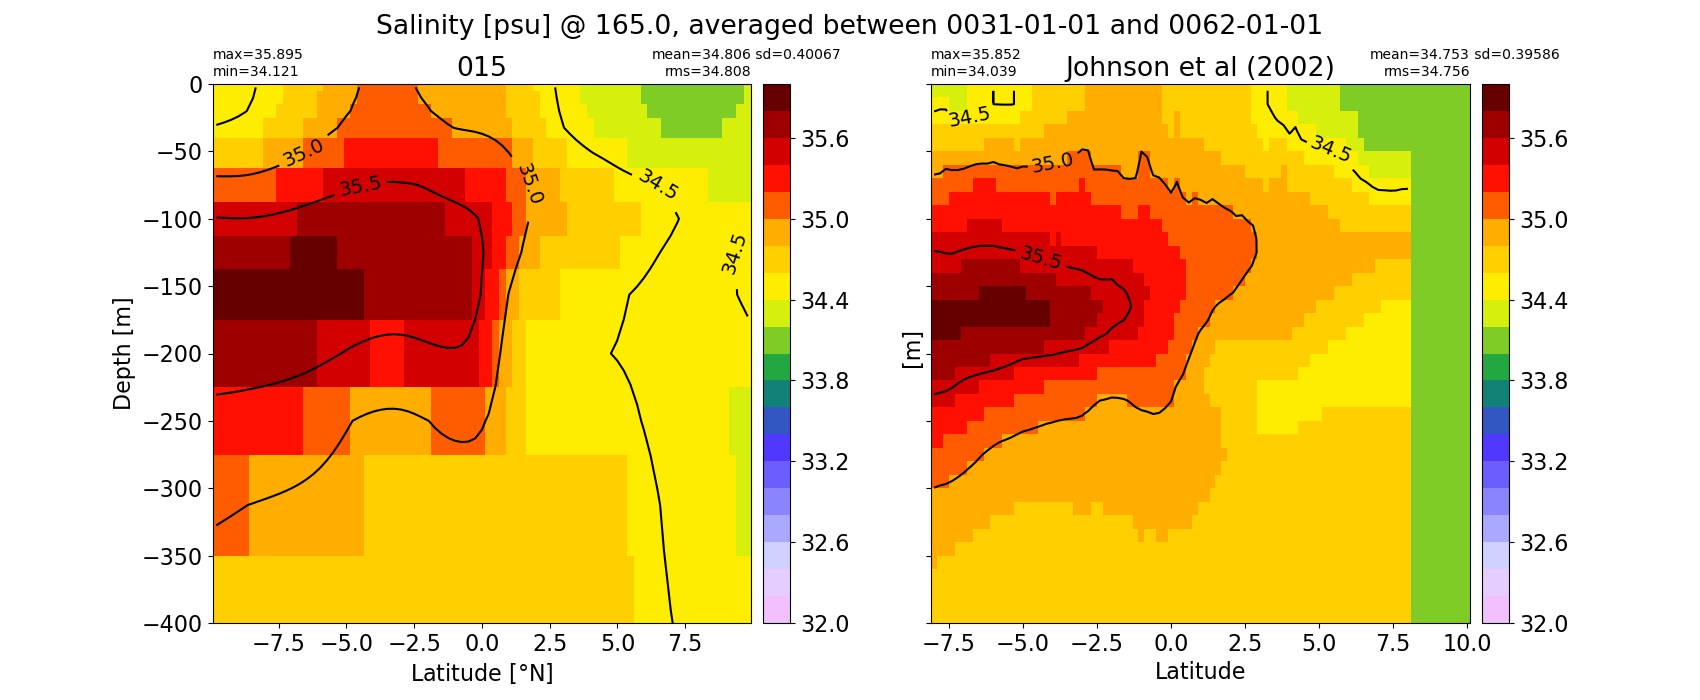
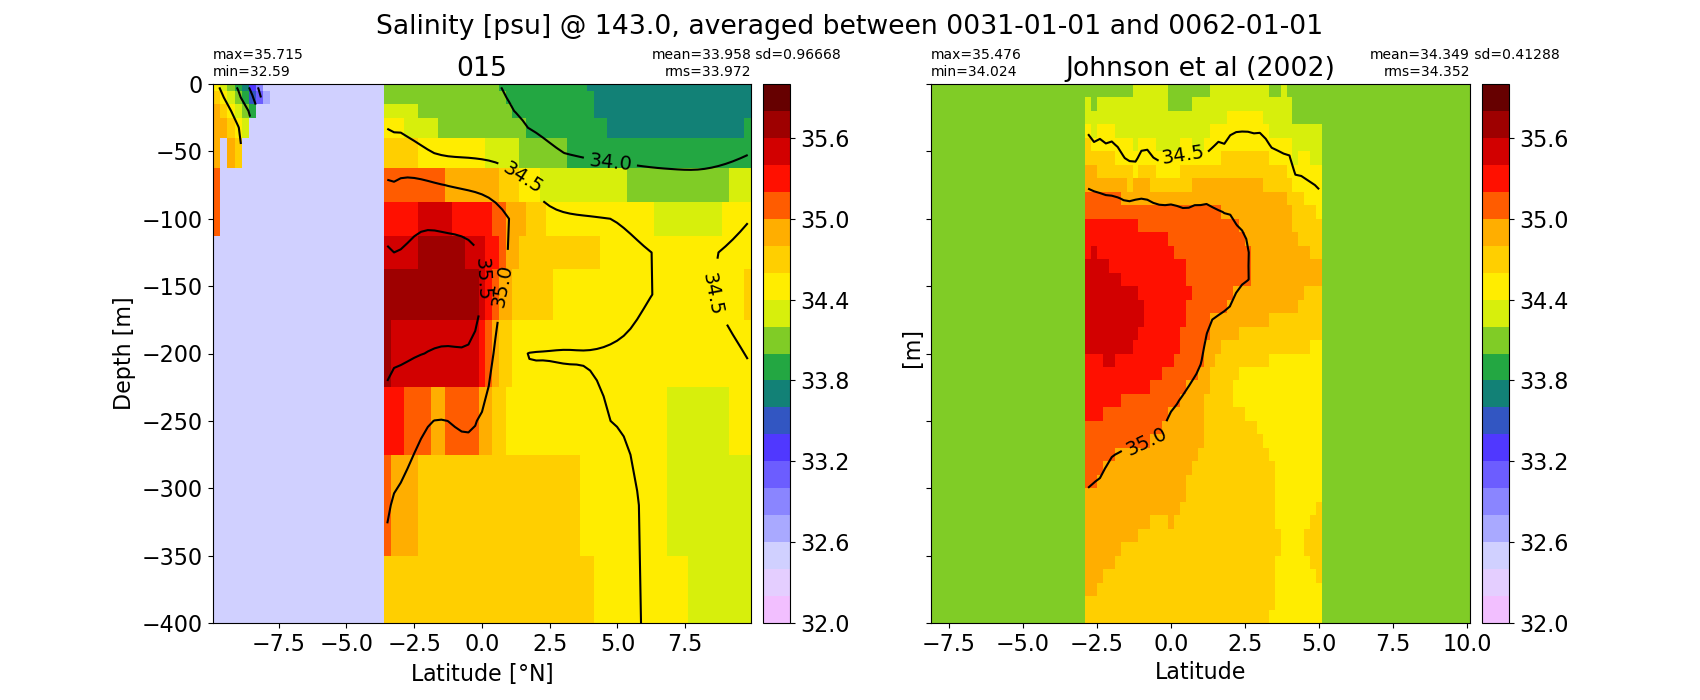
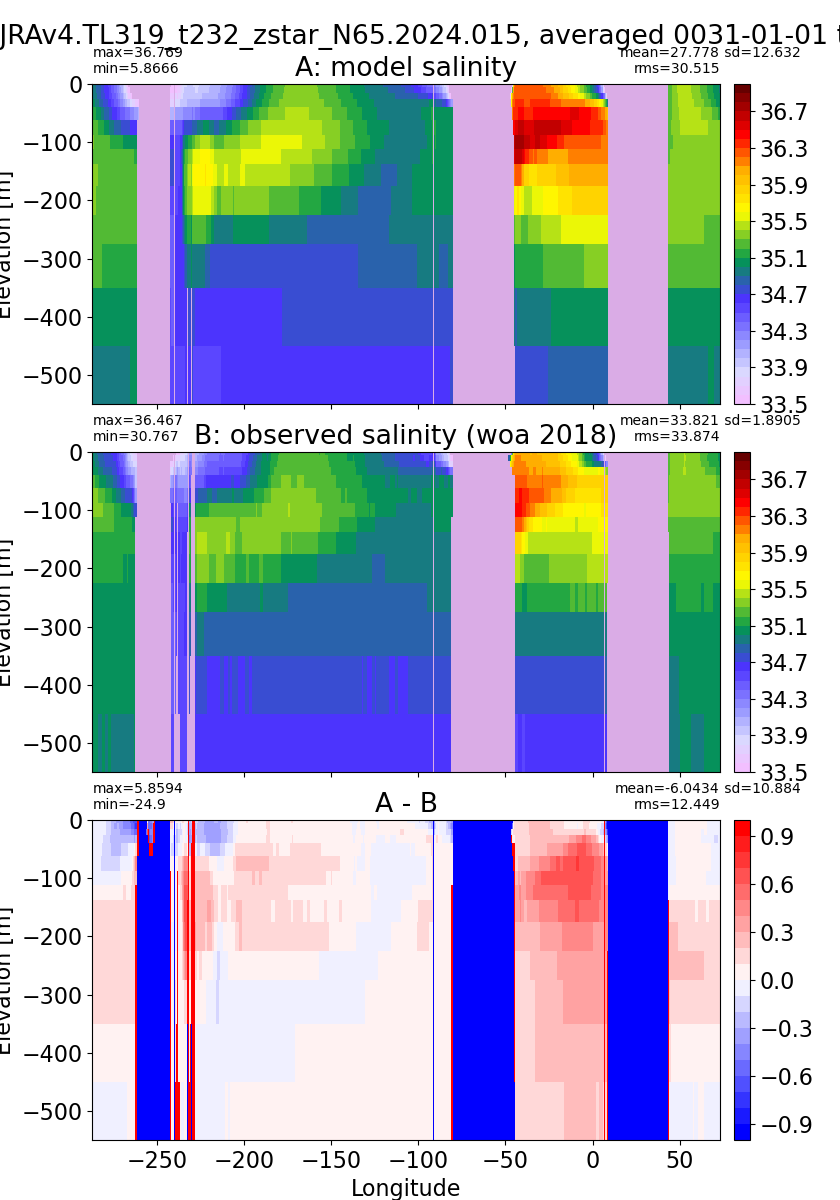
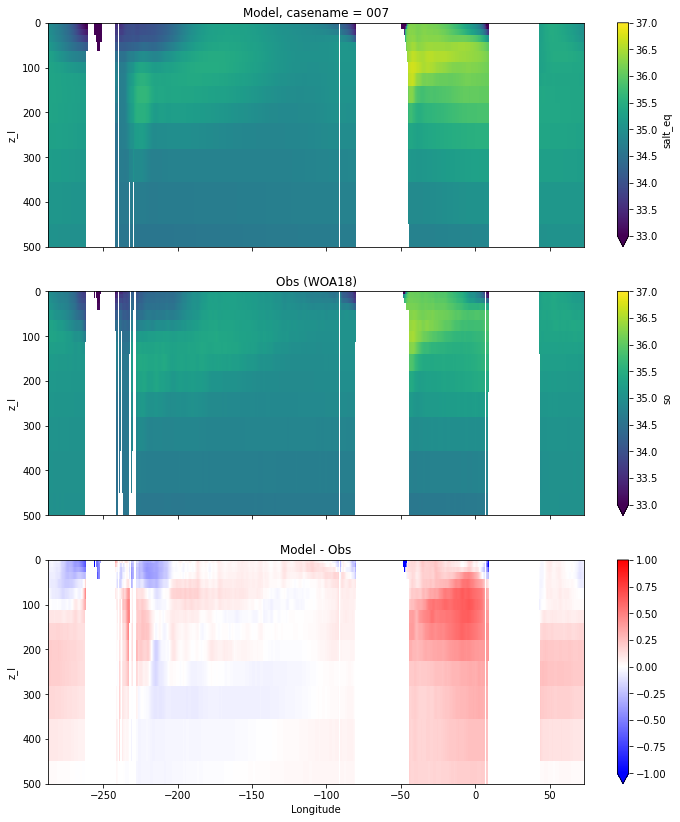
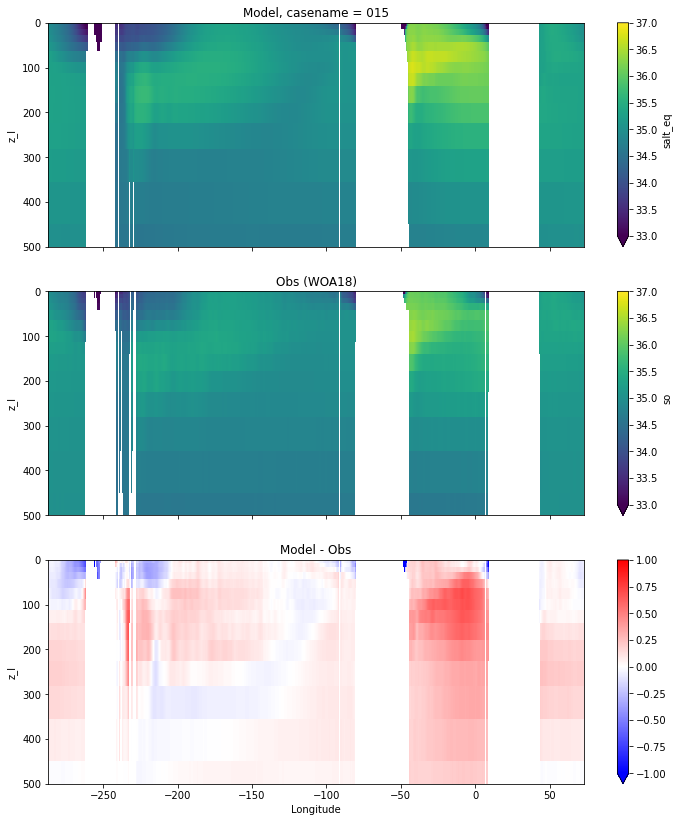
Salinity
for path, case, i in zip(ocn_path, casename, range(len(casename))):
  ds_salt = xr.open_dataset(ocn_path[i]+casename[i]+'_salt_eq.nc').rename({'zl':'z_l'})
  plot_comparison(ds_salt,'salt_eq',salt_obs,33,37,1,label[i])
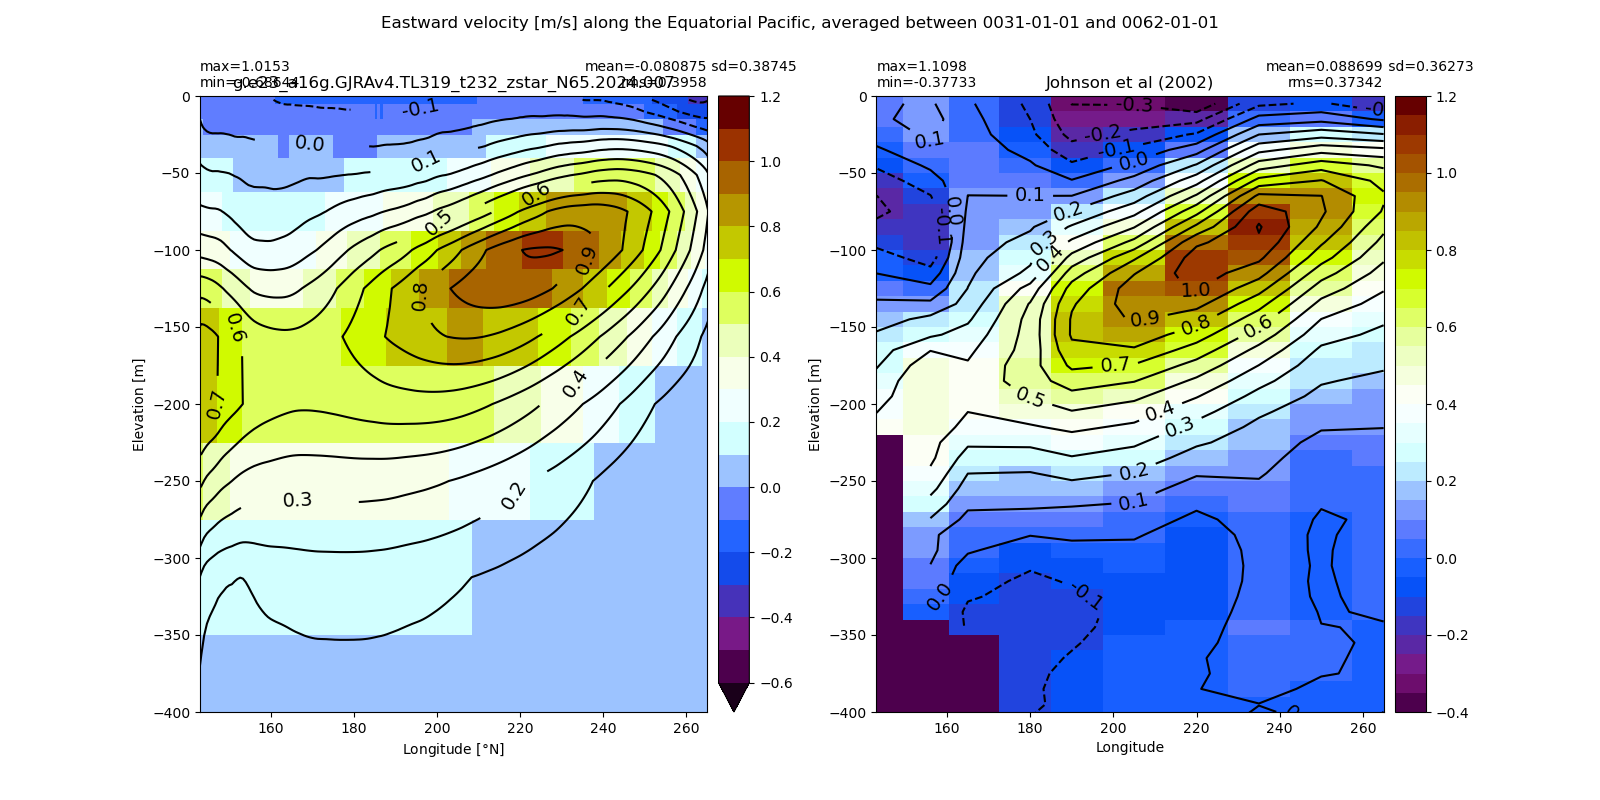
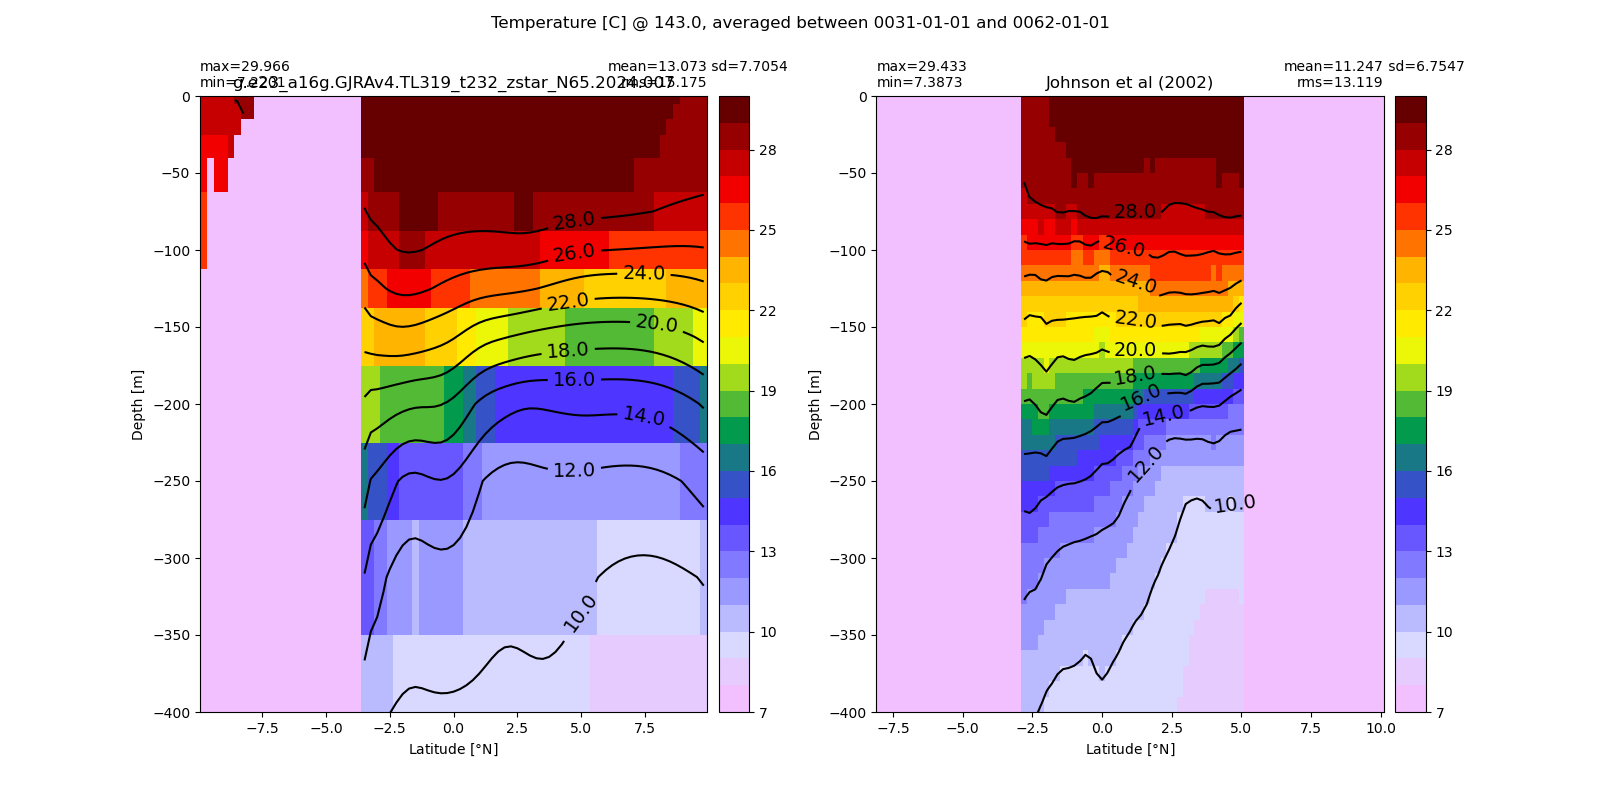
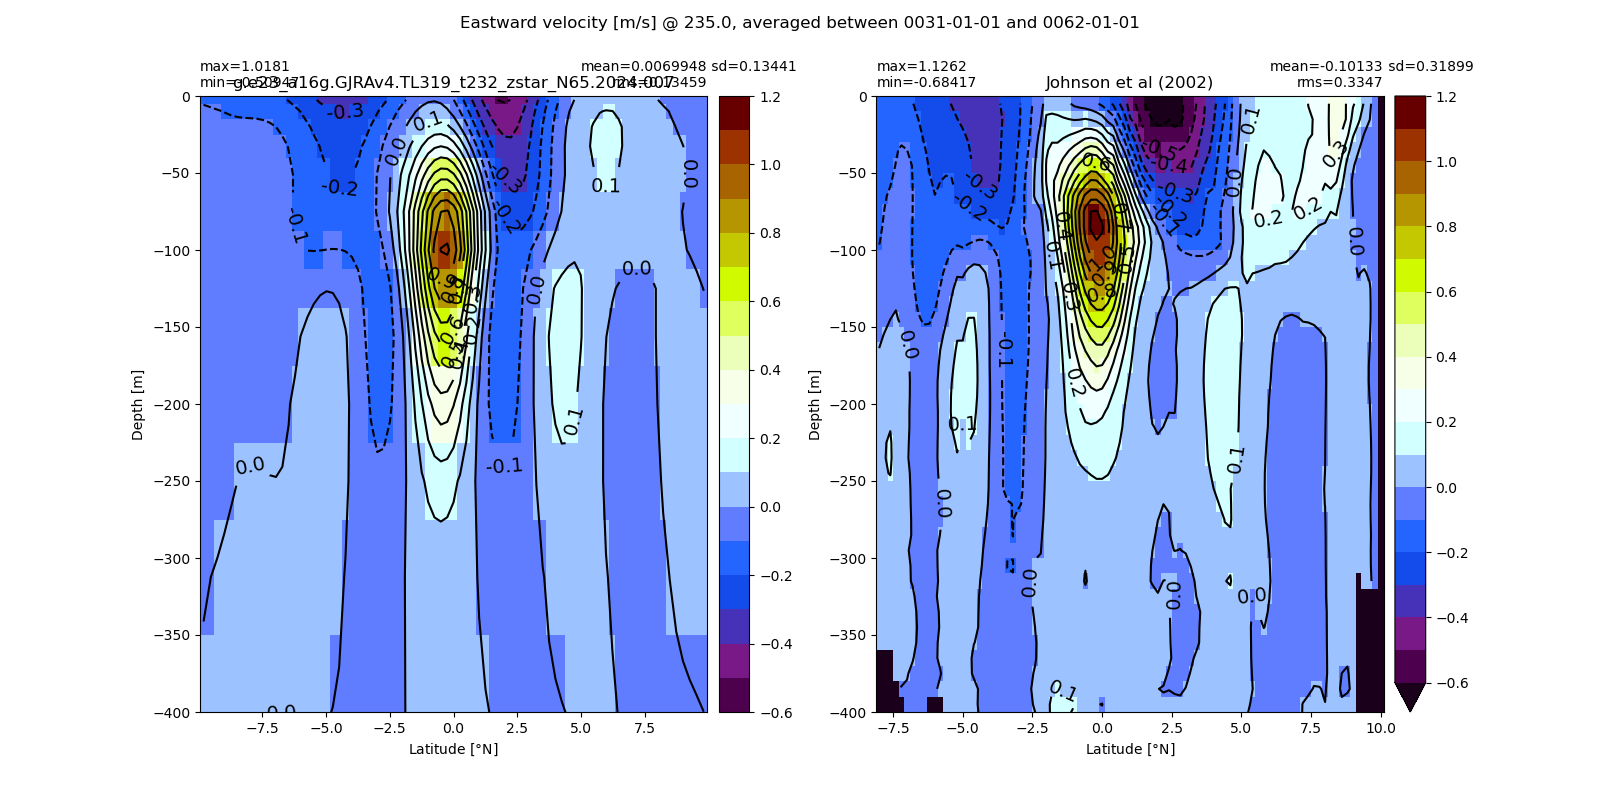
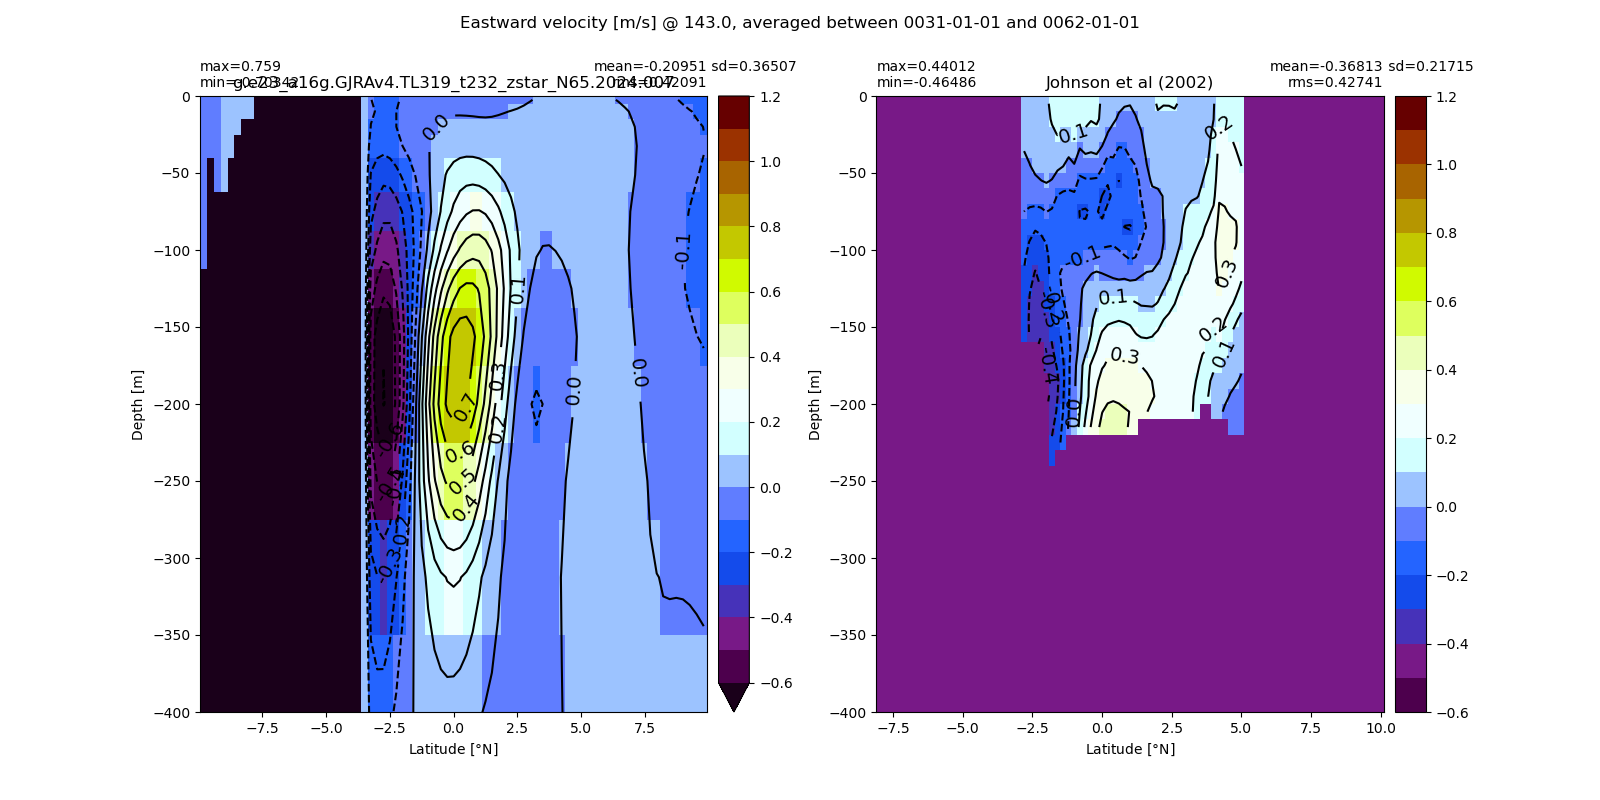
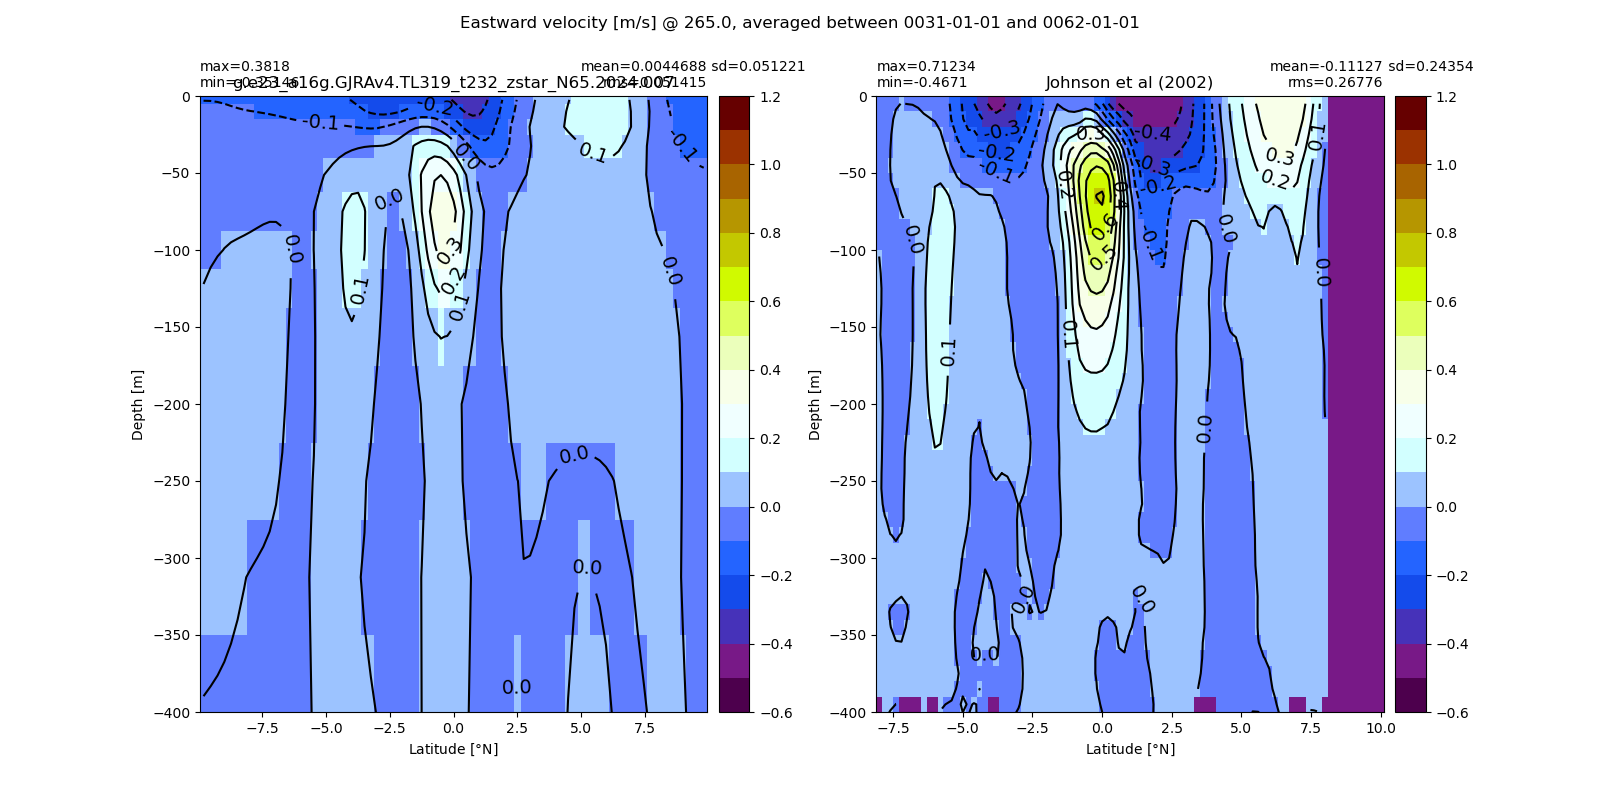
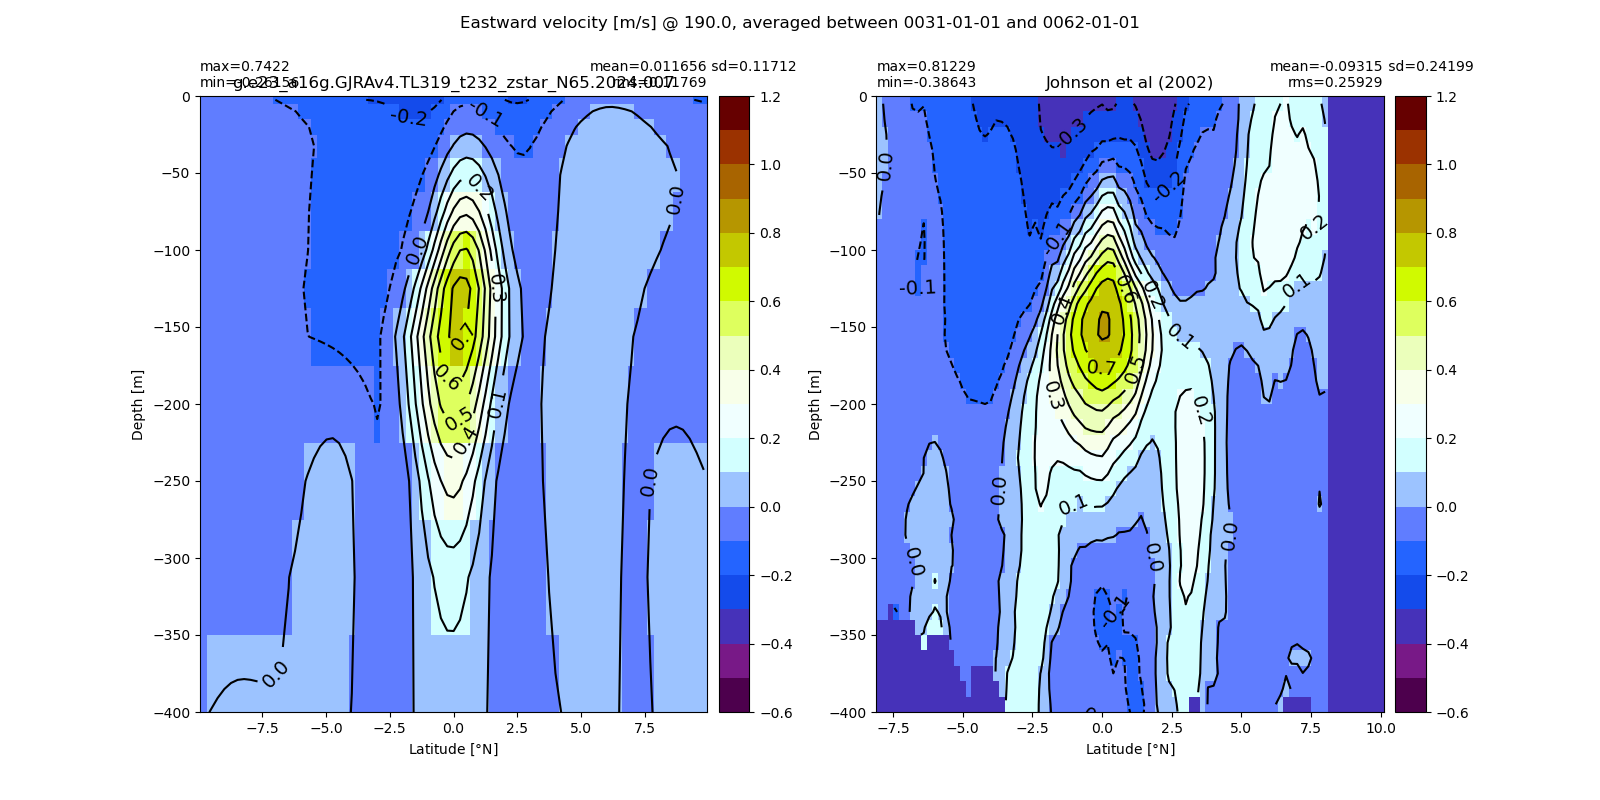
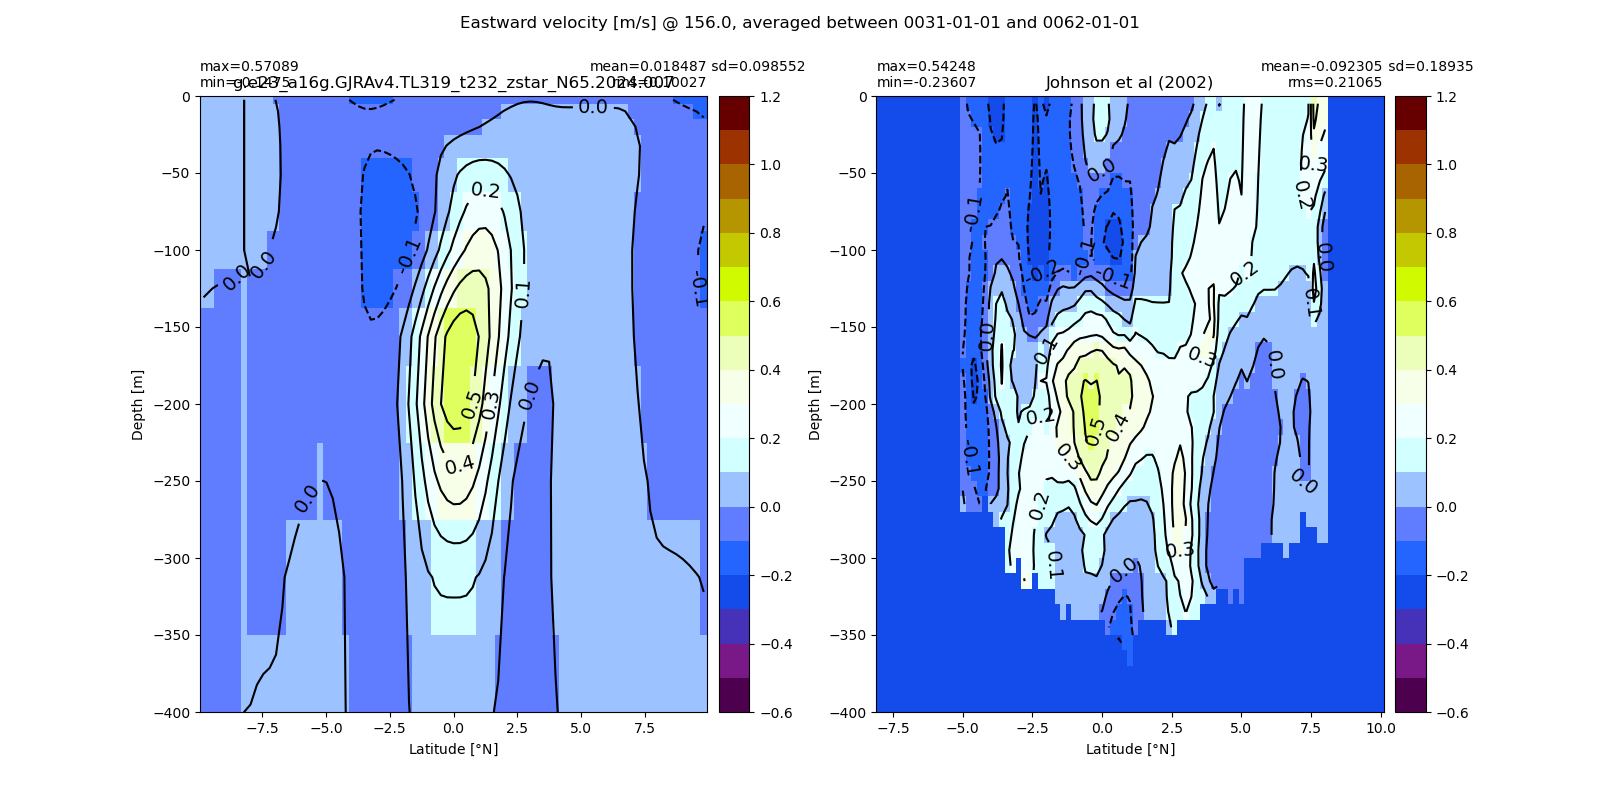
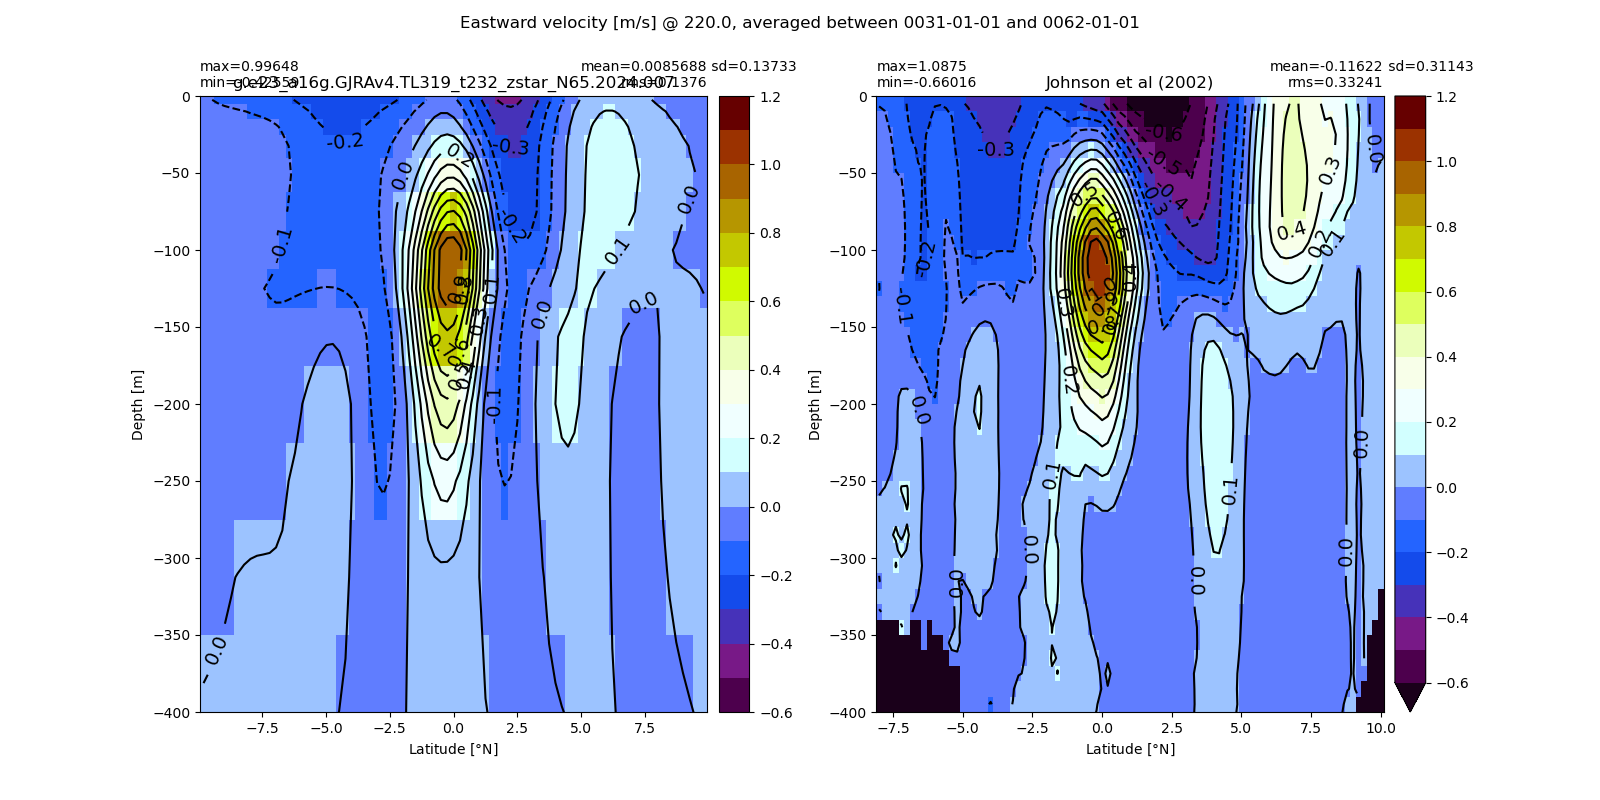
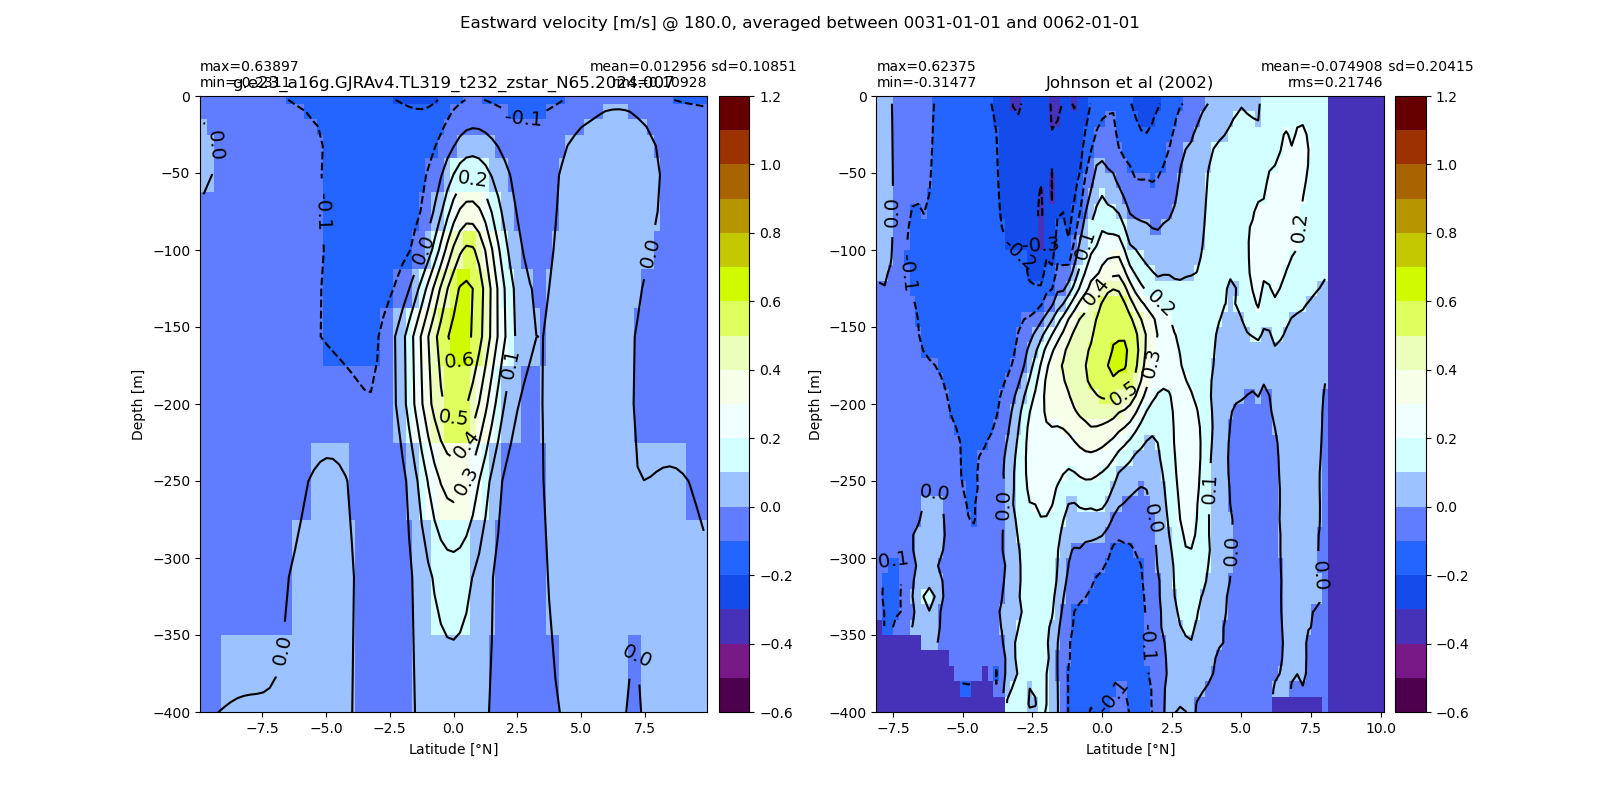
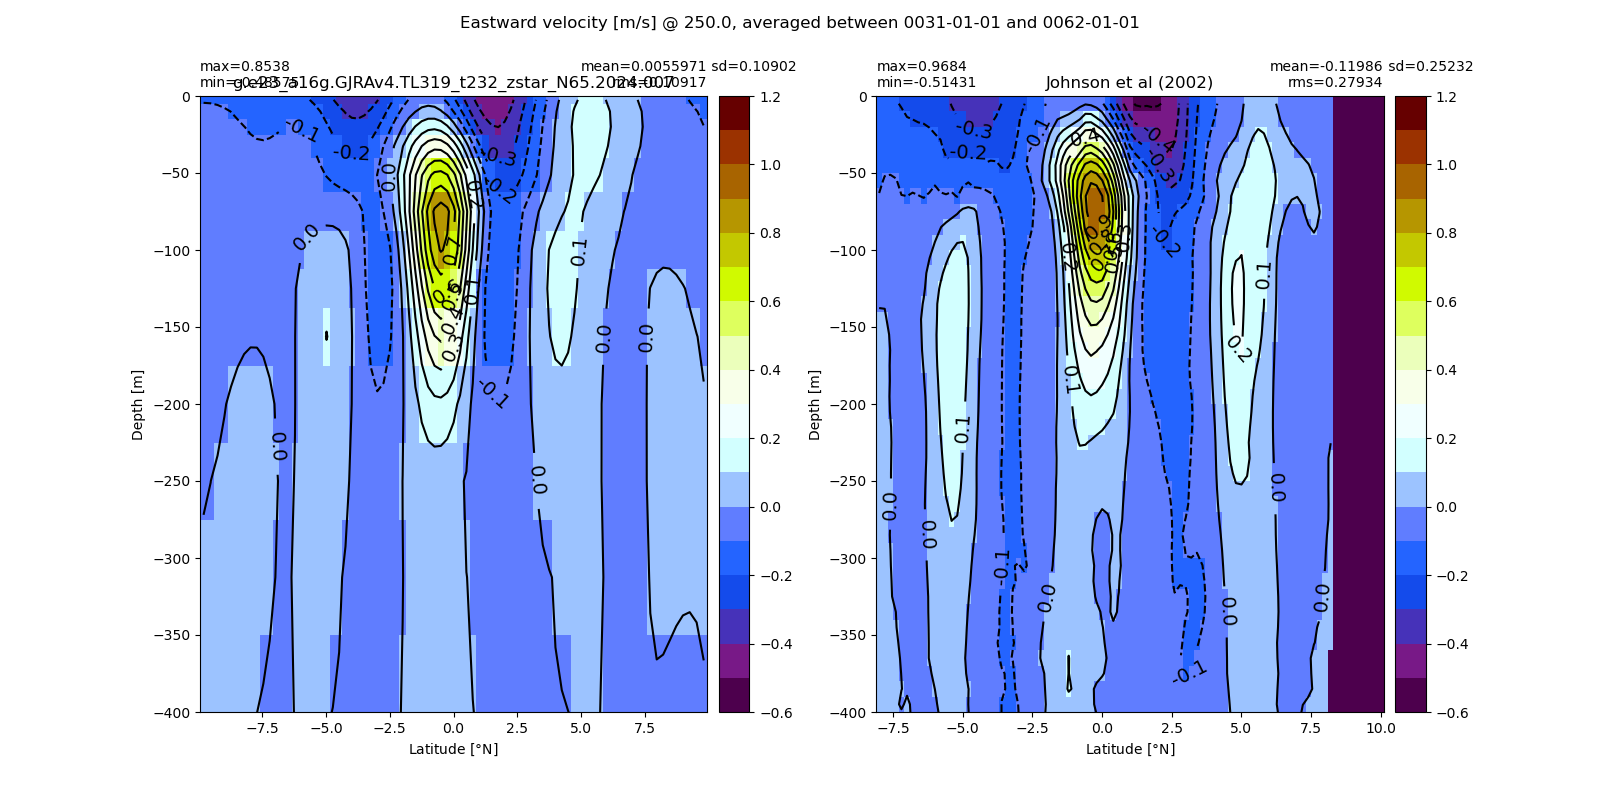
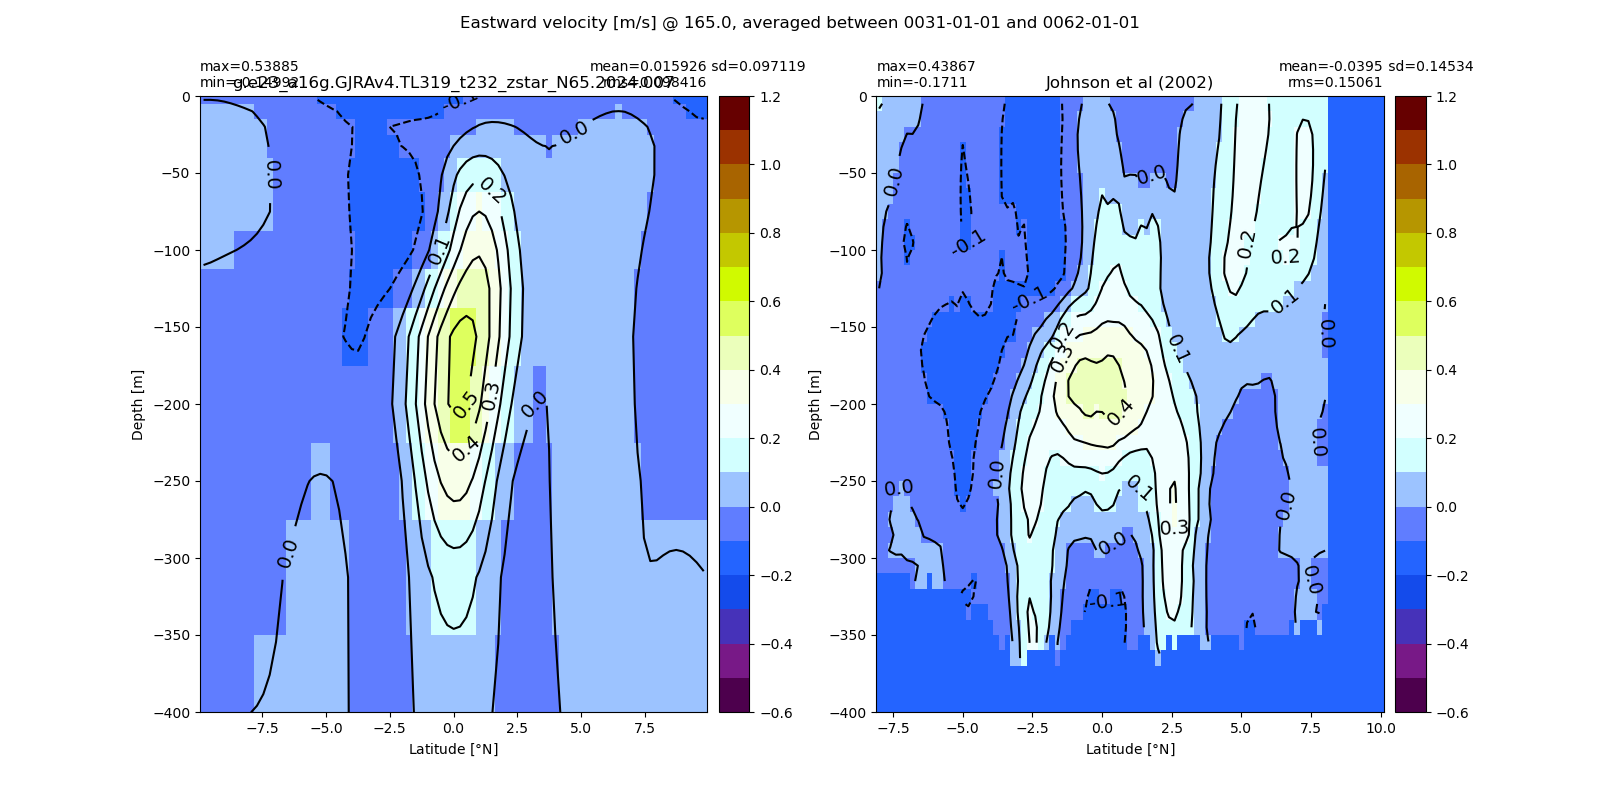
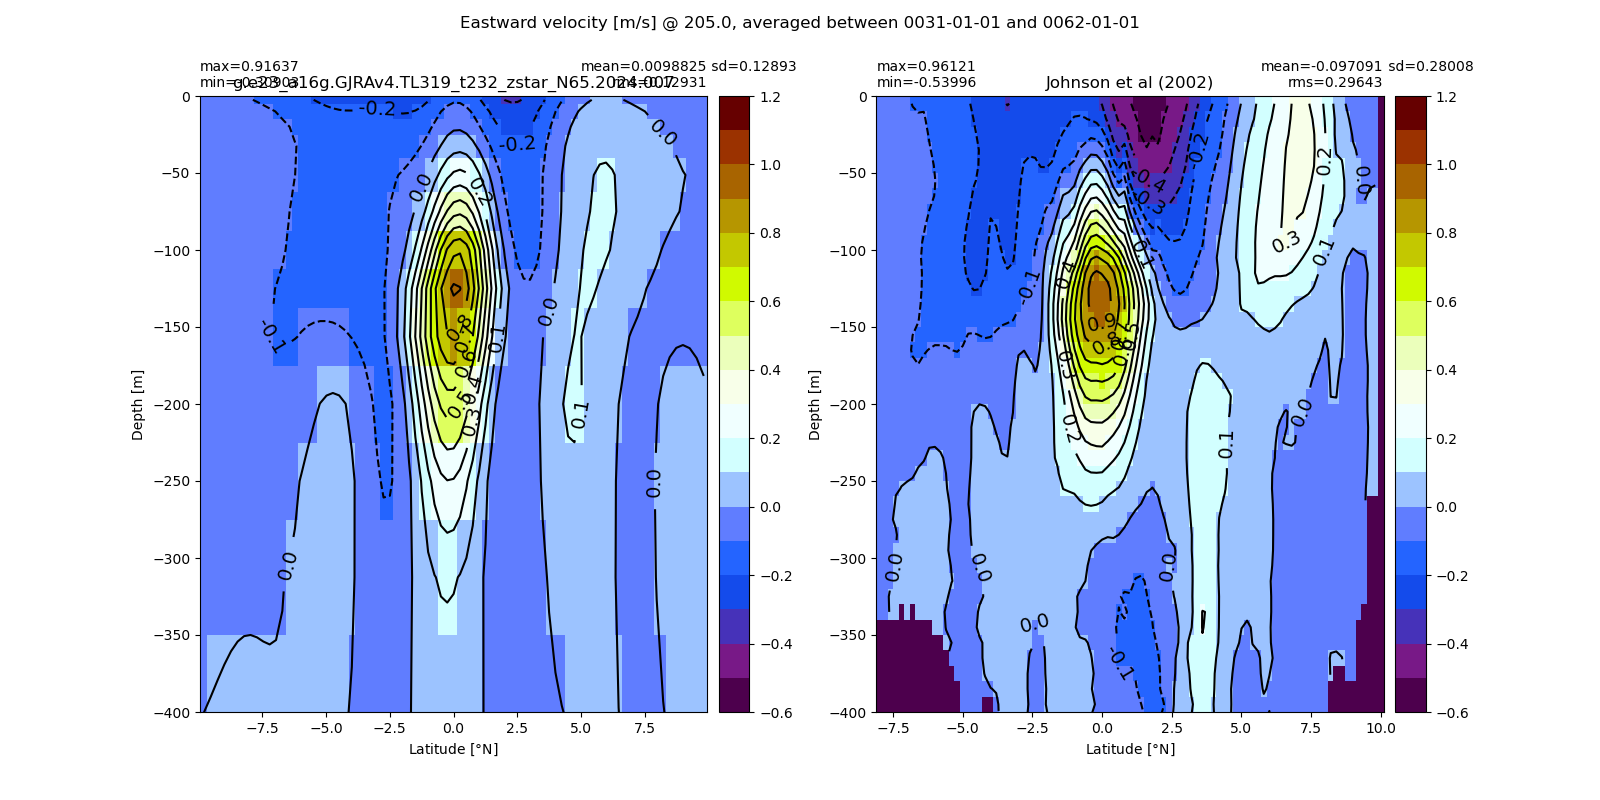
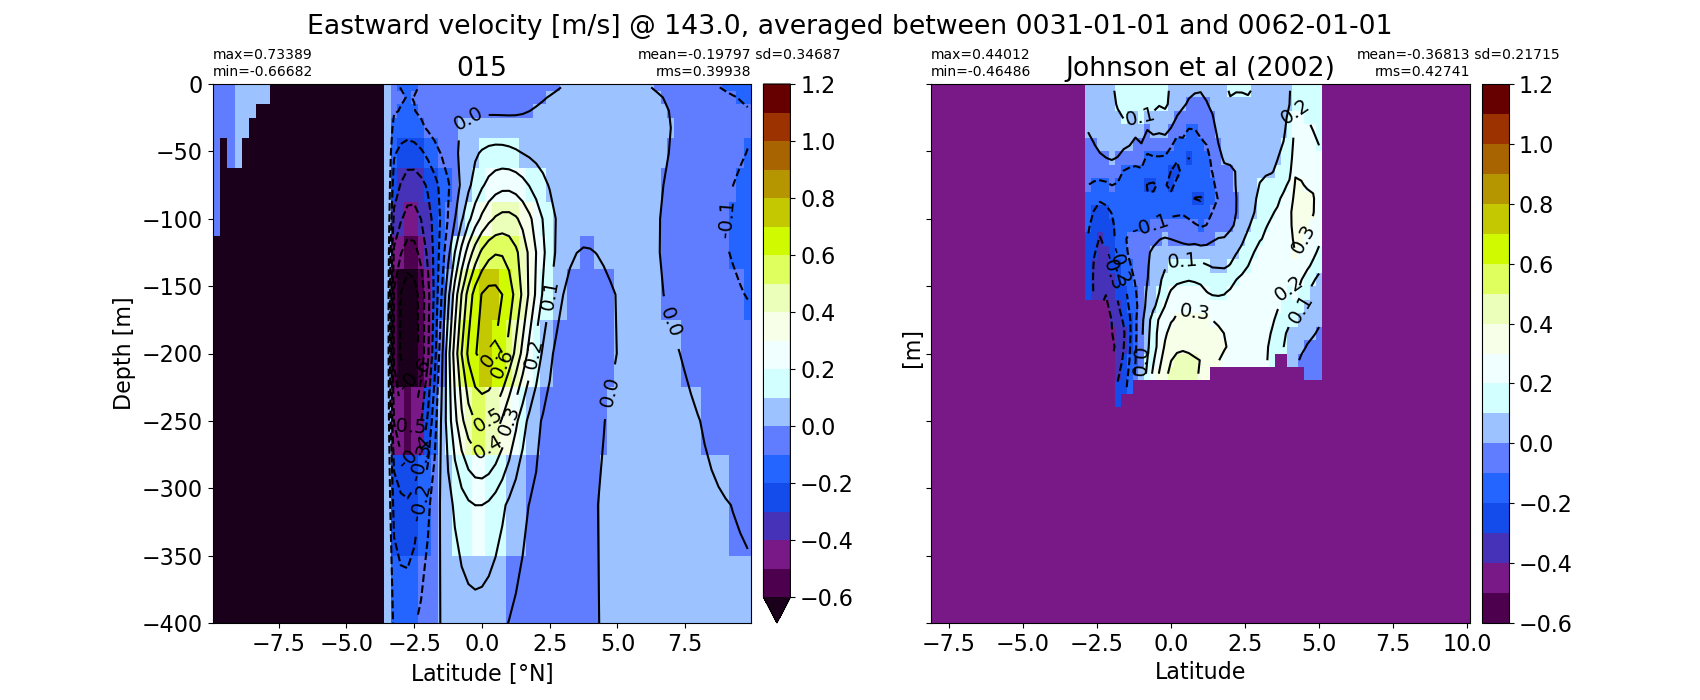
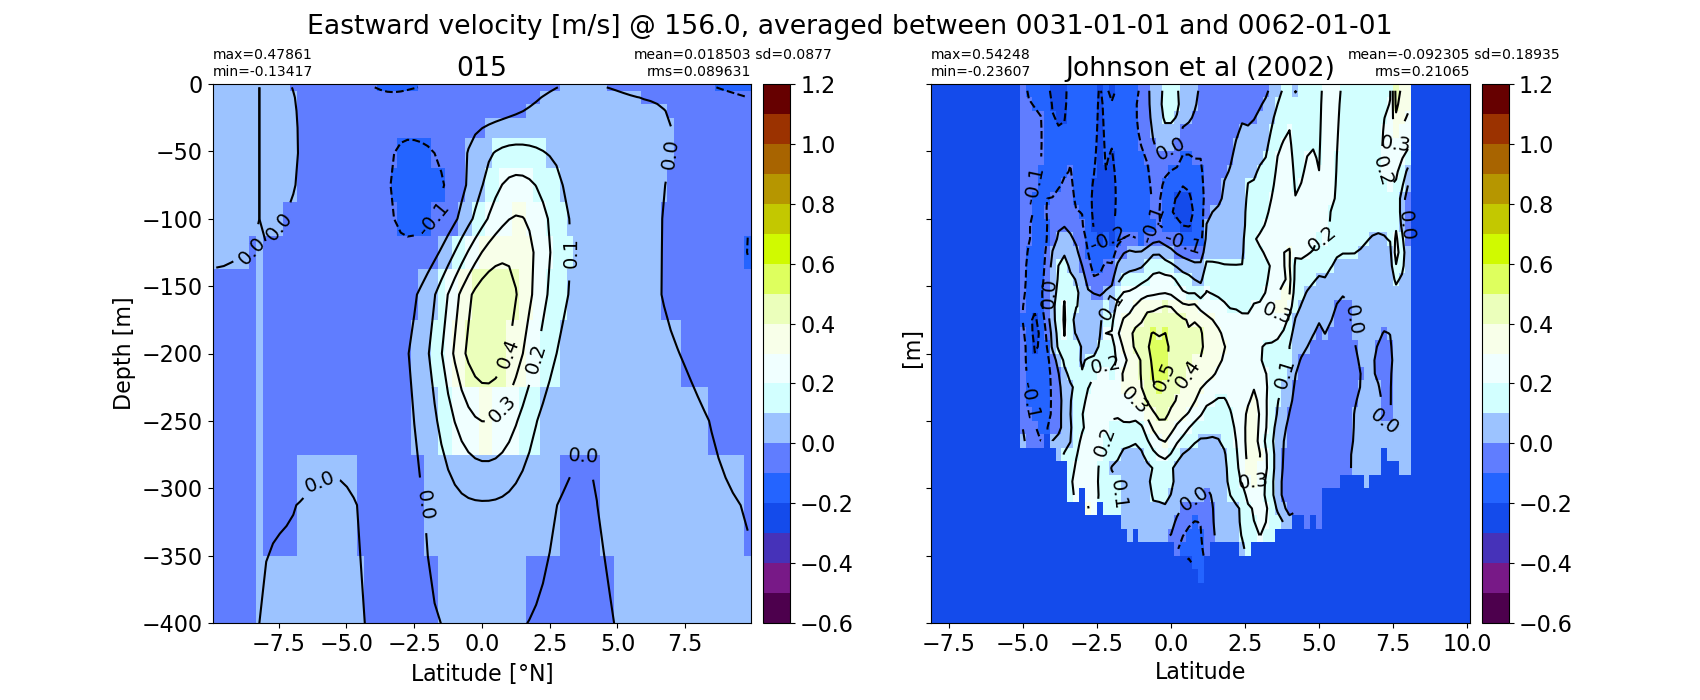
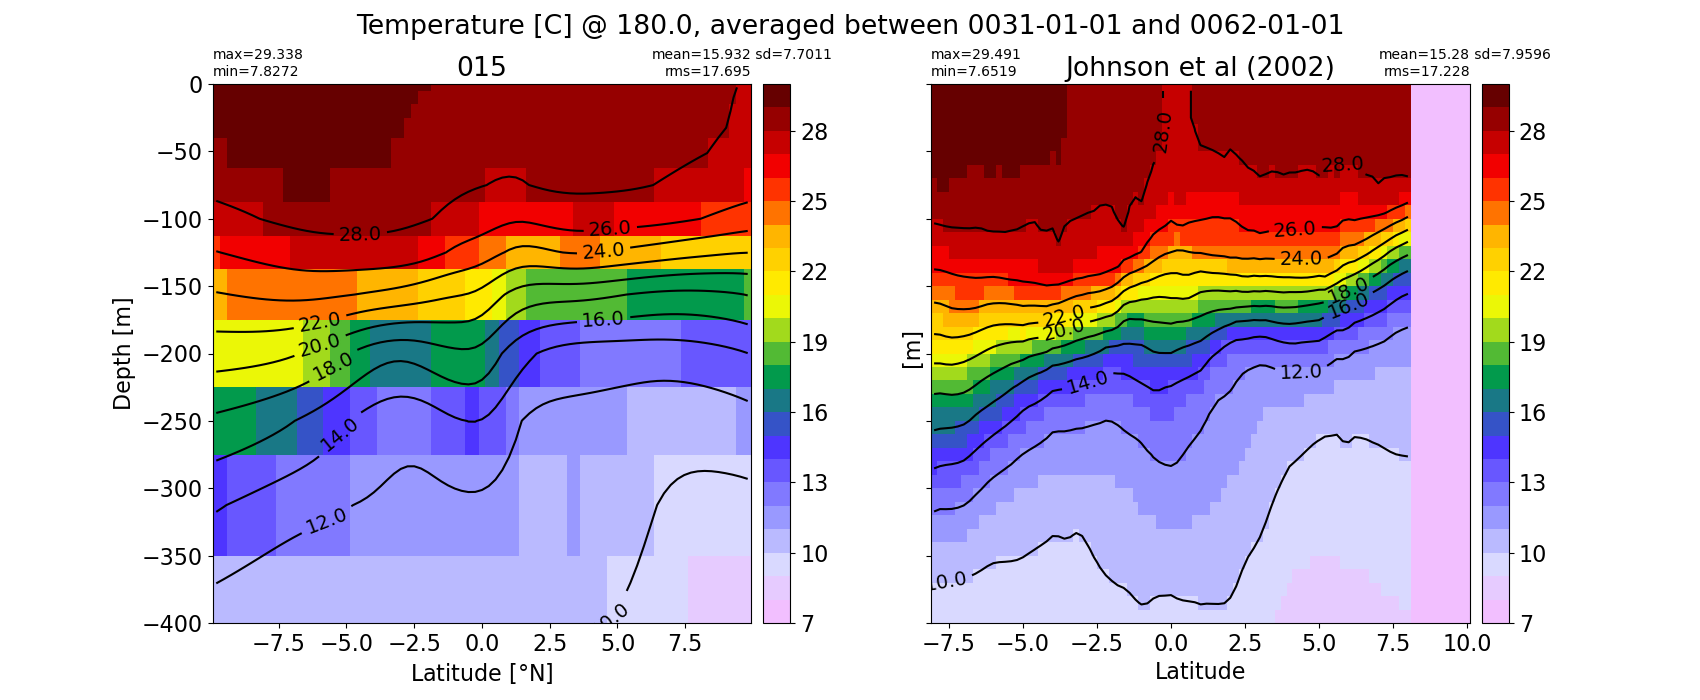
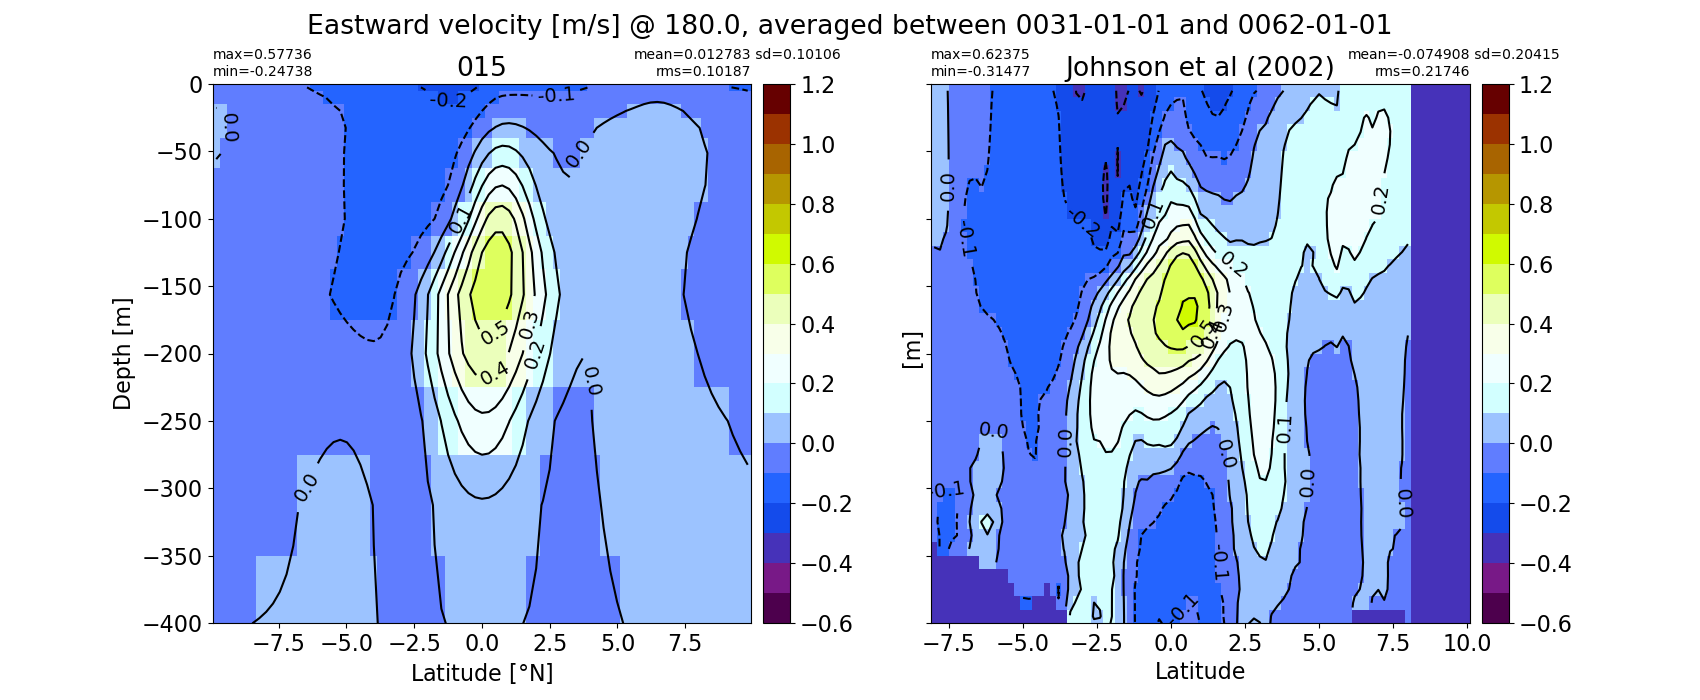
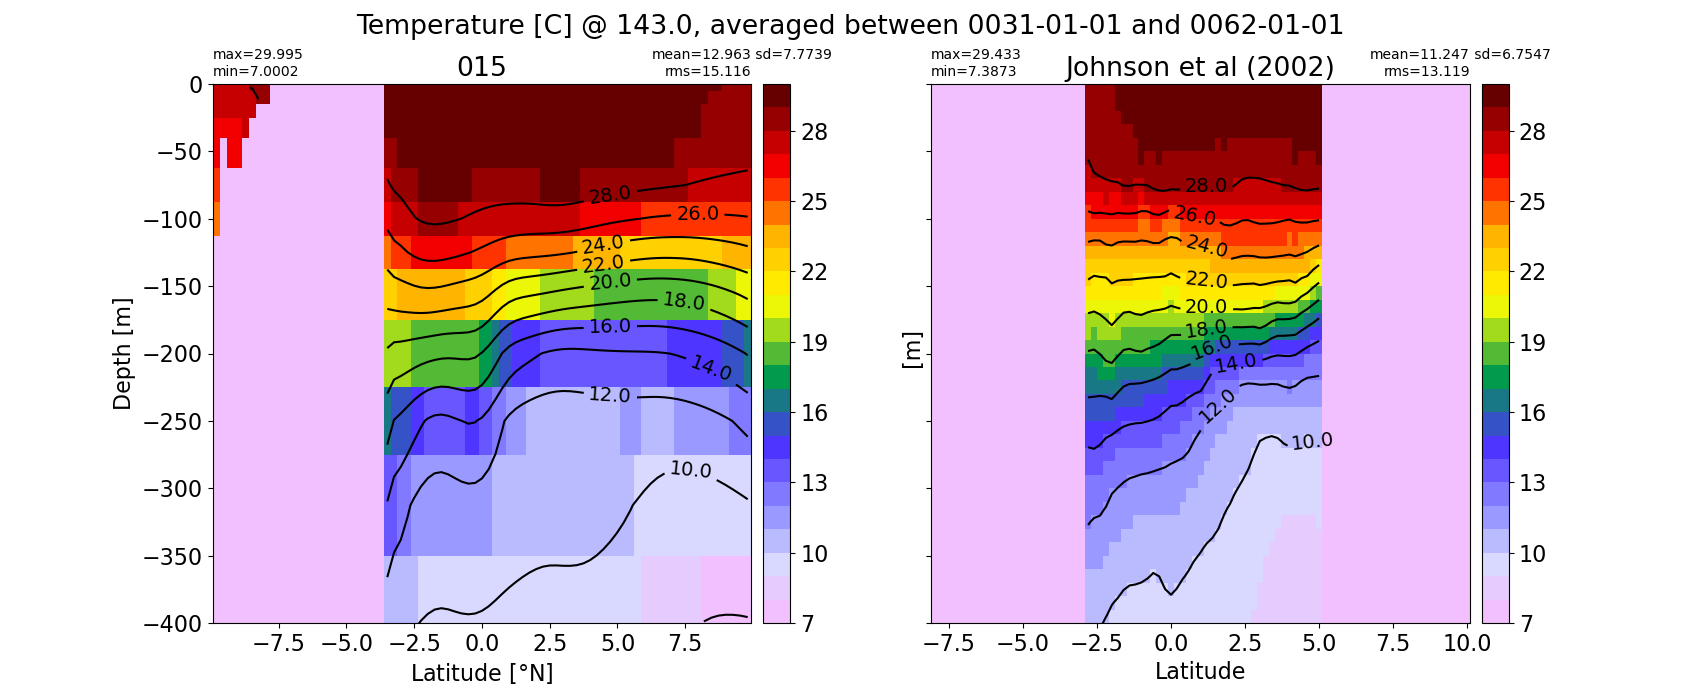
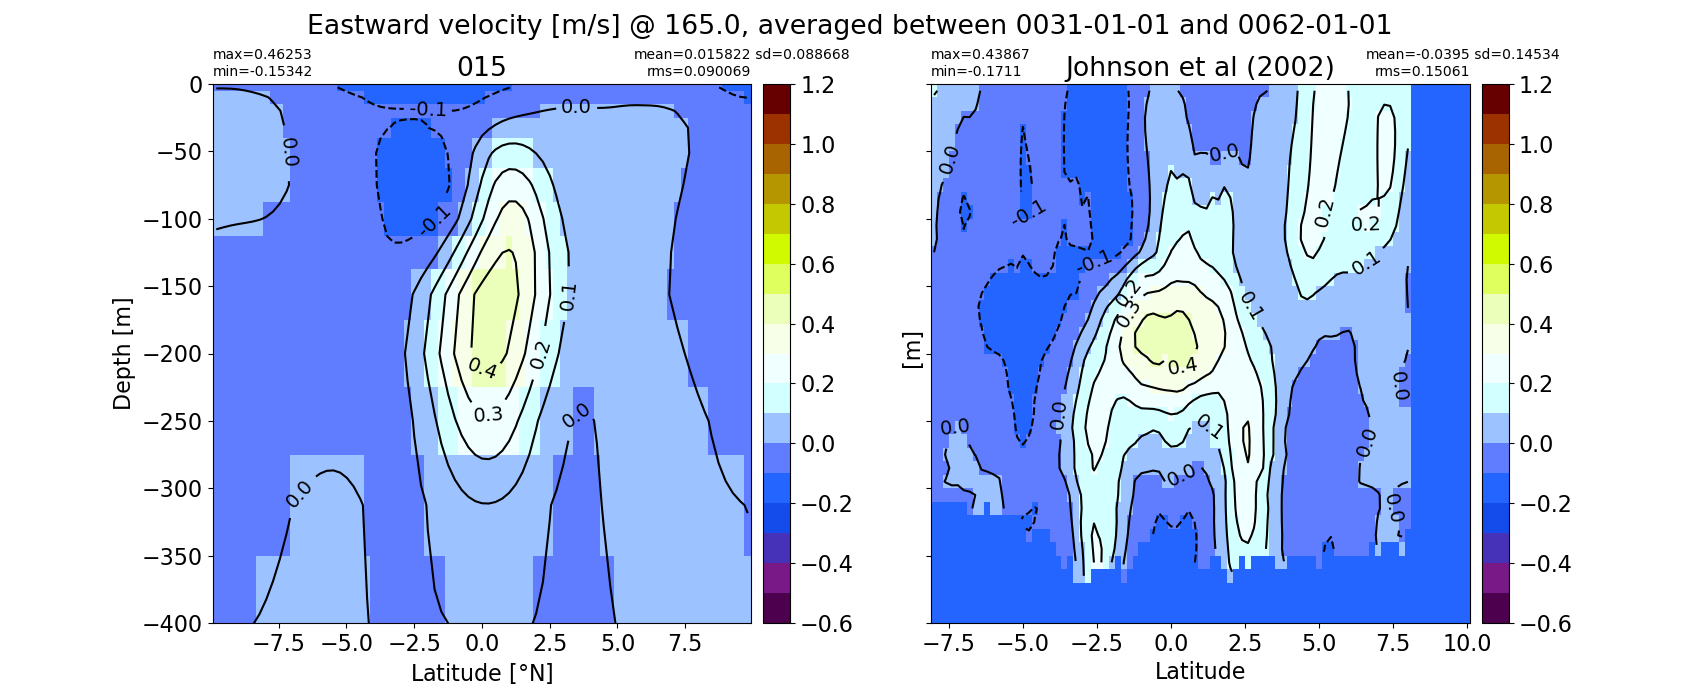
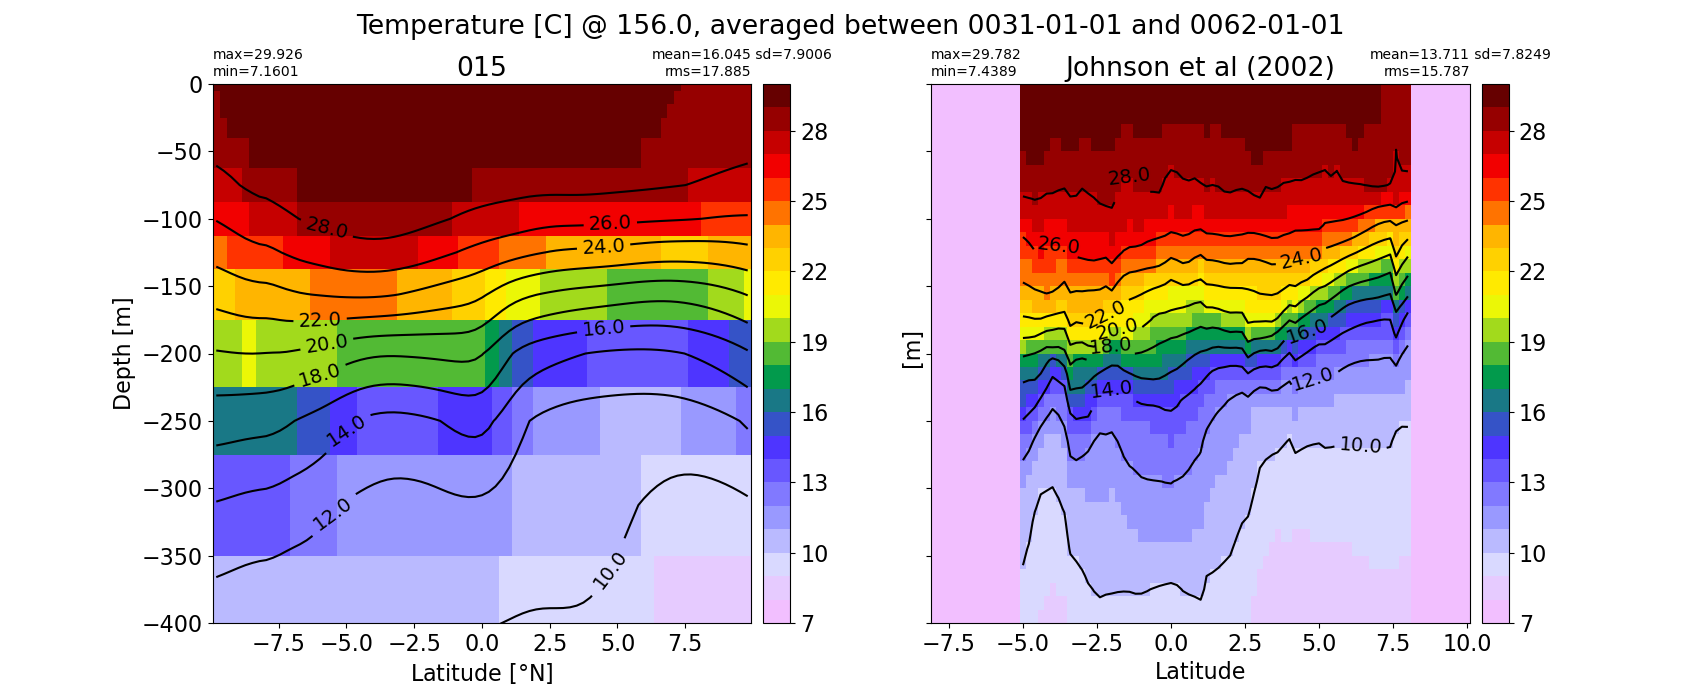
Miscellaneous
import glob
from IPython.display import Image, display

for i in range(len(casename)):
  #print(i)
  # List PNG files in the directory
  png_files = glob.glob(ocn_path[i]+'/../PNG/Equatorial/*.png')

  # Display PNG files in the Jupyter notebook
  for png_file in png_files:
    #print(png_file)
    display(Image(filename=png_file))