2D Surface Fields
Contents
2D Surface Fields
%%capture
# comment above line to see details about the run(s) displayed
from misc import *
from mom6_tools.m6plot import myStats, annotateStats
import cartopy.crs as ccrs
import cartopy.feature
import intake
%matplotlib inline
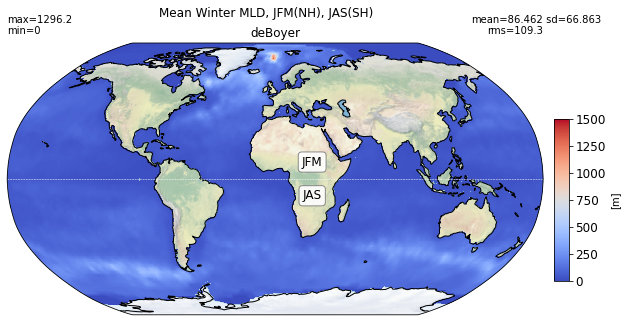
Mixed layer depth
obs = 'mld-deboyer-tx2_3v2'
# load obs-based mld from oce-catalog
catalog = intake.open_catalog(diag_config_yml['oce_cat'])
print('\n Reading climatology from: ', obs)
mld_obs = catalog[obs].to_dask().where(grd_xr[0].wet > 0.)
months = [0,1,2]
obs_JFM = np.ma.masked_invalid(mld_obs.mld.isel(time=months).mean('time').values)
months = [6,7,8]
obs_JAS = np.ma.masked_invalid(mld_obs.mld.isel(time=months).mean('time').values)
obs_winter = obs_JAS.copy(); obs_summer = obs_JAS.copy()
j = np.abs( grd[0].geolat[:,0] - 0. ).argmin()
obs_winter[j::,:] = obs_JFM[j::,:]
obs_summer[0:j,:] = obs_JFM[0:j,:]

bbox_props = dict(boxstyle="round", fc="w", ec="0.5", alpha=0.9)
def add_labels(ax, nh='JFM', sh='JAS'):
    ax.plot([grd[0].geolon[0,0], grd[0].geolon[0,-1]], [0,0], 'w--', lw=0.5, transform=ccrs.PlateCarree())
    ax.text(25, 10, nh, ha="center", va="center", size=12, bbox=bbox_props, transform=ccrs.PlateCarree())
    ax.text(25, -10, sh, ha="center", va="center", size=12, bbox=bbox_props, transform=ccrs.PlateCarree())
Reading climatology from: mld-deboyer-tx2_3v2
def plot_map(da, area, grd, label, vmin=None, vmax=None, suptitle='',
             nh='JFM', sh='JAS', cmap='coolwarm'):
  sMin, sMax, sMean, sStd, sRMS = myStats(np.ma.masked_invalid(da), area)
  fig = plt.figure(figsize=(10, 5))
  ax = fig.add_subplot(1, 1, 1, projection=ccrs.Robinson())
  plt.suptitle(suptitle)
  pc = ax.pcolormesh(grd.geolon_c, grd.geolat_c, da,
                transform=ccrs.PlateCarree(),vmin=vmin, vmax=vmax,
                cmap=cmap)
  #ax.set_title(label + ', '+ da.description)
  ax.set_title(label)
  annotateStats(ax, sMin, sMax, sMean, sStd, sRMS)
  add_labels(ax, nh=nh, sh=sh)
  cax = fig.add_axes([0.9, 0.22, 0.02, 0.45])
  cbar = plt.colorbar(pc, cax=cax, label='[m]')
  cbar.ax.tick_params(labelsize=12)
  ax.set_global()
  ax.stock_img()
  ax.coastlines();
  return
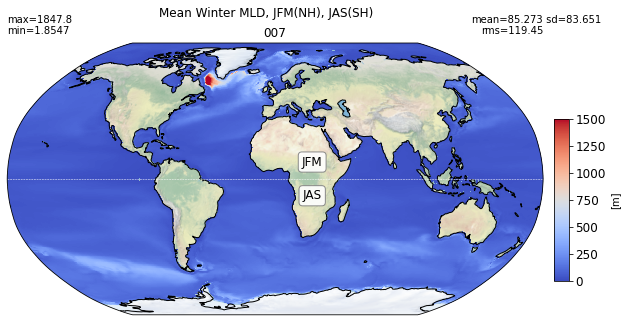
Winter
%matplotlib inline

title = 'Mean Winter MLD, JFM(NH), JAS(SH)'
try:
  area= grd[0].area_t
except:
  area= grd[0].areacello
plot_map(obs_winter, area, grd[0], 'deBoyer',
           vmin=0, vmax=1500, suptitle=title)
title1 = 'Mean Winter MLD, JFM(NH), JAS(SH)'
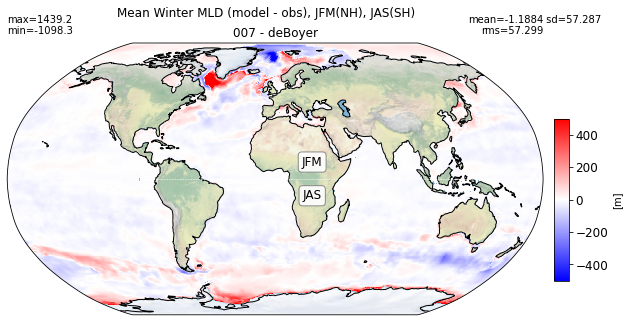
title2 = 'Mean Winter MLD (model - obs), JFM(NH), JAS(SH)'
for path, case, i in zip(ocn_path, casename, range(len(casename))):
da = xr.open_dataset(path+case+'_MLD_winter.nc')
try:
area= grd[i].area_t
except:
area= grd[i].areacello
# model
plot_map(da.MLD_winter.values, area, grd[i], label[i],
vmin=0, vmax=1500, suptitle=title1)
# model - obs
diff = (da.MLD_winter.values - obs_winter)
plot_map(diff, area, grd[i], label[i] + ' - deBoyer',
vmin=-500, vmax=500, suptitle=title2, cmap='bwr')
---------------------------------------------------------------------------
KeyboardInterrupt                         Traceback (most recent call last)
/glade/derecho/scratch/gmarques/tmp/ipykernel_14639/553041980.py in <module>
     14   # model - obs
     15   diff = (da.MLD_winter.values - obs_winter)
---> 16   plot_map(diff, area, grd[i], label[i] + ' - deBoyer',
     17            vmin=-500, vmax=500, suptitle=title2, cmap='bwr')

/glade/derecho/scratch/gmarques/tmp/ipykernel_14639/1162882592.py in plot_map(da, area, grd, label, vmin, vmax, suptitle, nh, sh, cmap)
      3   sMin, sMax, sMean, sStd, sRMS = myStats(np.ma.masked_invalid(da), area)
      4   fig = plt.figure(figsize=(10, 5))
----> 5   ax = fig.add_subplot(1, 1, 1, projection=ccrs.Robinson())
      6   plt.suptitle(suptitle)
      7   pc = ax.pcolormesh(grd.geolon_c, grd.geolat_c, da,

/glade/work/gmarques/miniconda/envs/dev2/lib/python3.9/site-packages/cartopy/crs.py in __init__(self, central_longitude, globe, false_easting, false_northing)
   2351         """
   2352         proj4_params = [('proj', 'robin'), ('lon_0', central_longitude)]
-> 2353         super().__init__(proj4_params, central_longitude,
   2354                          false_easting=false_easting,
   2355                          false_northing=false_northing,

/glade/work/gmarques/miniconda/envs/dev2/lib/python3.9/site-packages/cartopy/crs.py in __init__(self, proj4_params, central_longitude, false_easting, false_northing, globe)
   2096         lon[-1] = minlon
   2097         lat[-1] = -90
-> 2098         points = self.transform_points(self.as_geodetic(), lon, lat)
   2099
   2100         self._boundary = sgeom.LinearRing(points)

/glade/work/gmarques/miniconda/envs/dev2/lib/python3.9/site-packages/cartopy/crs.py in as_geodetic(self)
    306
    307         """
--> 308         return CRS(self.geodetic_crs.srs)
    309
    310     def is_geodetic(self):

/glade/work/gmarques/miniconda/envs/dev2/lib/python3.9/site-packages/pyproj/crs/crs.py in geodetic_crs(self)
   1685
   1686         """
-> 1687         return None if self._crs.geodetic_crs is None else CRS(self._crs.geodetic_crs)
   1688
   1689     @property

pyproj/_crs.pyx in pyproj._crs._CRS.geodetic_crs.__get__()

pyproj/_crs.pyx in pyproj._crs._to_wkt()

/glade/work/gmarques/miniconda/envs/dev2/lib/python3.9/site-packages/pyproj/exceptions.py in clear()
     17         super().__init__(error_message)
     18
---> 19     @staticmethod
     20     def clear() -> None:
     21         """

KeyboardInterrupt:

<Figure size 720x360 with 0 Axes>
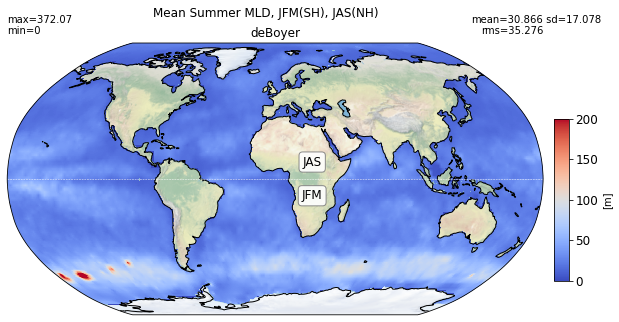
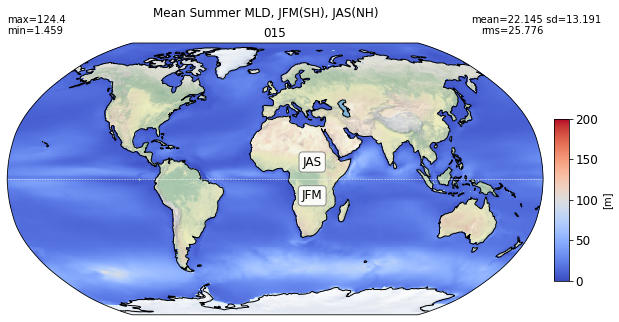
Summer
title = 'Mean Summer MLD, JFM(SH), JAS(NH)'
try:
  area= grd[0].area_t
except:
  area= grd[0].areacello
plot_map(obs_summer, area, grd[0], 'deBoyer', vmin=0, vmax=200,
           suptitle=title, nh='JAS', sh='JFM',)
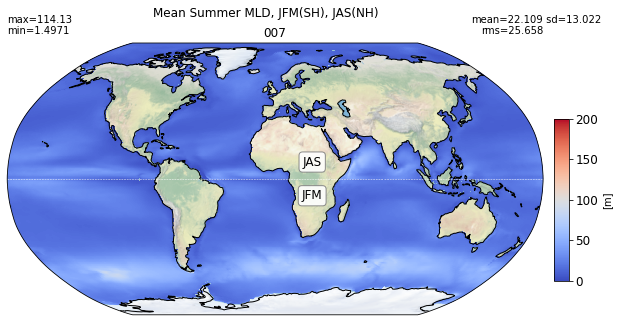
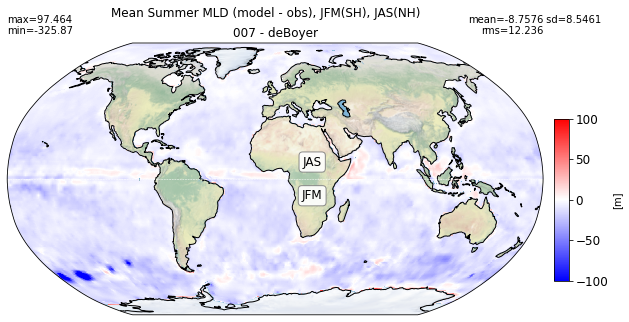
title1 = 'Mean Summer MLD, JFM(SH), JAS(NH)'
title2 = 'Mean Summer MLD (model - obs), JFM(SH), JAS(NH)'

for path, case, i in zip(ocn_path, casename, range(len(casename))):
  da = xr.open_dataset(path+case+'_MLD_summer.nc')
  try:
    area= grd[i].area_t
  except:
    area= grd[i].areacello

  # model
  plot_map(da.MLD_summer.values, area, grd[i], label[i],
           vmin=0, vmax=200, suptitle=title1, nh='JAS', sh='JFM')
  # model - obs
  diff = (da.MLD_summer.values - obs_summer)
  plot_map(diff, area, grd[i], label[i] + ' - deBoyer',
           vmin=-100, vmax=100, suptitle=title2, nh='JAS',
           sh='JFM',cmap='bwr')

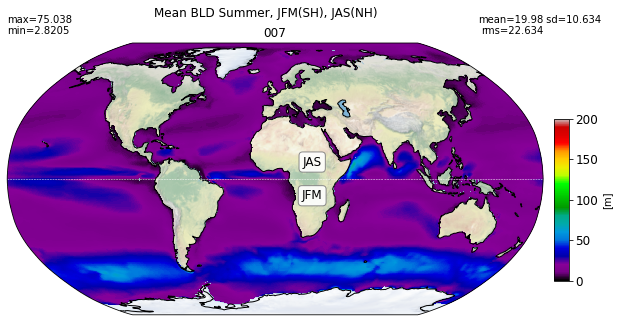
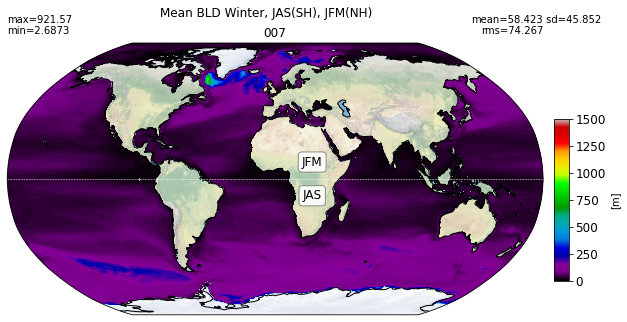
Boundary layer depth
for path, case, i in zip(ocn_path, casename, range(len(casename))):
  ds1 =  xr.open_dataset(path+case+'_BLD_summer.nc')
  ds2 =  xr.open_dataset(path+case+'_BLD_winter.nc')
  summer = np.ma.masked_invalid(ds1.BLD_summer.values)
  winter = np.ma.masked_invalid(ds2.BLD_winter.values)

  try:
    area= grd[i].area_t
  except:
    area= grd[i].areacello

  # summer
  plot_map(summer, area, grd[i], label[i],
           vmin=0, vmax=200, suptitle="Mean BLD Summer, JFM(SH), JAS(NH)",
           nh='JAS', sh='JFM', cmap='nipy_spectral')
  # winter
  plot_map(winter, area, grd[i], label[i],
           vmin=0, vmax=1500, suptitle="Mean BLD Winter, JAS(SH), JFM(NH)",
           cmap='nipy_spectral')