Antarctic Intermediate Water (AAIW)#
%load_ext autoreload
%autoreload 2
%%capture
# comment above line to see details about the run(s) displayed
from misc import *
import nc_time_axis
import warnings
warnings.filterwarnings("ignore")
import intake
import matplotlib
import numpy as np
import xarray as xr
import momlevel as ml
# mom6_tools
from mom6_tools.m6toolbox import cime_xmlquery
from mom6_tools.aaiw_pv import plot_aaiw_pv, plot_aaiw_pv_obs
from IPython.display import Image, display
import glob
Zonal mean plot(s)#
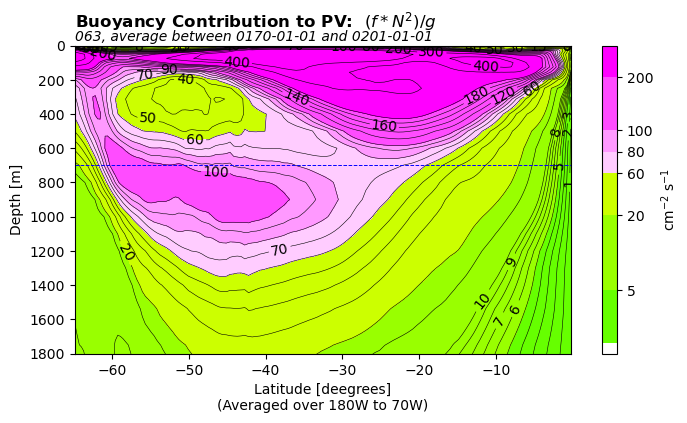
Model#
for i in range(len(casename)):
  # List PNG files in the directory
  png_files = glob.glob(ocn_path[i]+'/../PNG/AAIW_PV/*.png')
  # Display PNG files in the Jupyter notebook
  for png_file in png_files:
    display(Image(filename=png_file))
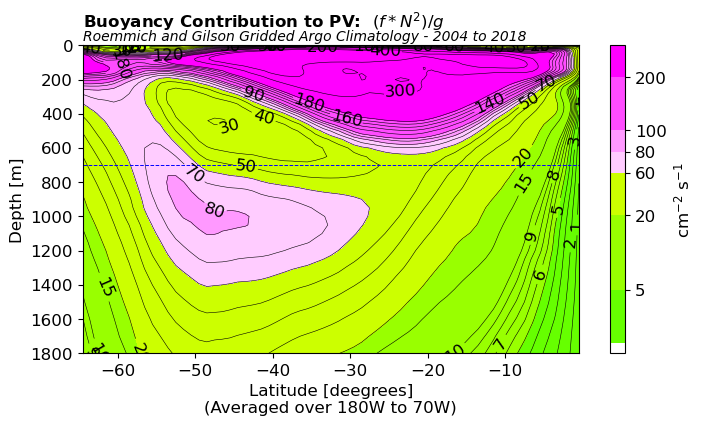
Argo#
%matplotlib inline
catalog = intake.open_catalog(diag_config_yml['oce_cat'])
ds_obs = catalog['rg-argo-2018'].to_dask()
levels, colors = ml.util.get_pv_colormap()
plot_aaiw_pv_obs(ds_obs, levels, colors)
Volume of water with PV > 60 cm-2 s-1: 15.2133647204352 x 1.0e^15