uhGM#
# Parameters
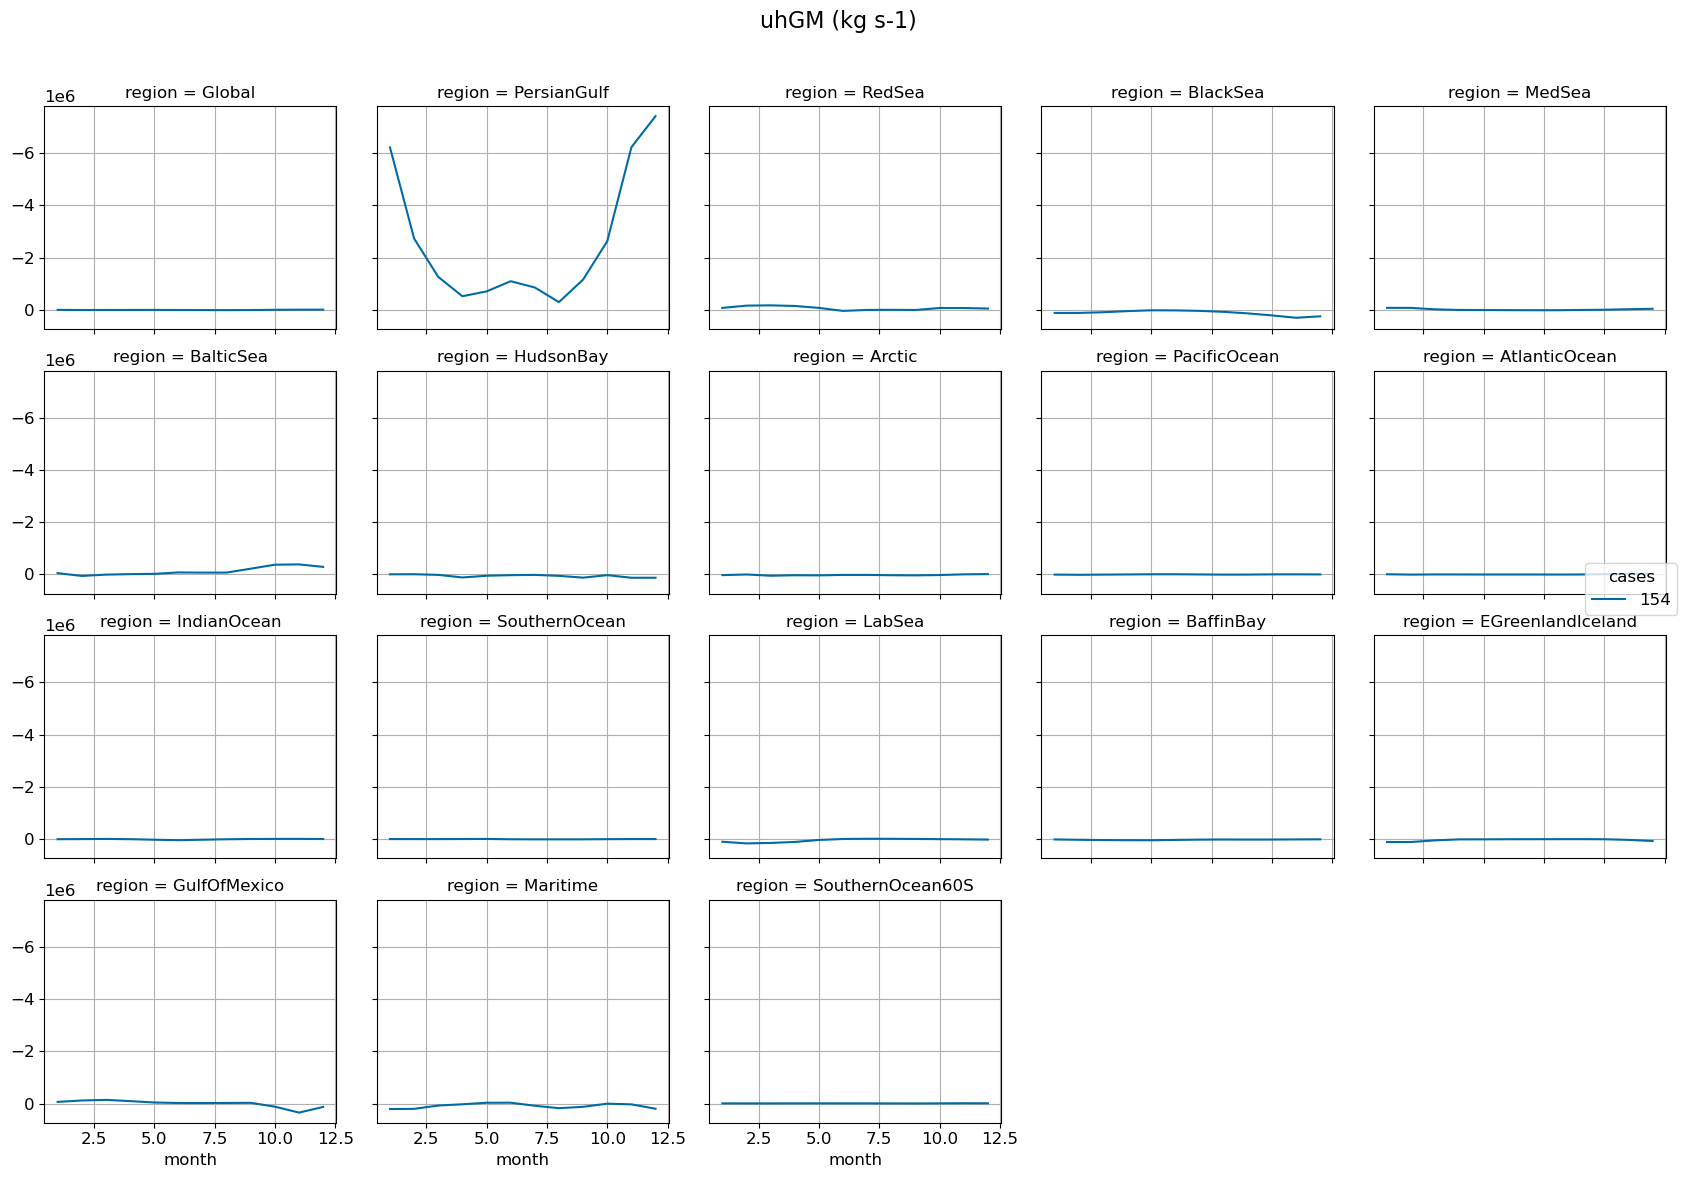
variable = "uhGM"
stream = "z"
long_name = "Time Mean Diffusive Zonal Thickness Flux"
from IPython.display import display, Markdown
# Dynamically generate markdown content
markdown_text = f" This notebook compares area-weighted maps, in some cases, vertical profiles for {variable} in different basins."

# Display the updated markdown content
display(Markdown(markdown_text))
This notebook compares area-weighted maps, in some cases, vertical profiles for uhGM in different basins.
%load_ext autoreload
%autoreload 2
%%capture
# comment above line to see details about the run(s) displayed
import sys, os
sys.path.append(os.path.abspath(".."))
from misc import *
import glob
print("Last update:", date.today())
%matplotlib inline
months = ['January', 'February', 'March', 'April',
          'May', 'June', 'July', 'August', 'September',
          'October', 'November', 'December']
# load data
ds = []
for c, p in zip(casename, climo_path):
  file = glob.glob(p+'{}.{}.{}.??????-??????.nc'.format(c, stream, variable))[0]
  ds.append(xr.open_dataset(file))
def identify_xyz_dims(dims):
    dims = tuple(dims)

    z_options = ['zl', 'z_l', 'zi', 'z_i']
    y_options = ['yh', 'yq']
    x_options = ['xh', 'xq']

    z_dim = next((dim for dim in dims if dim in z_options), None)
    y_dim = next((dim for dim in dims if dim in y_options), None)
    x_dim = next((dim for dim in dims if dim in x_options), None)

    # Set default values for coordinates and area
    x_coord = y_coord = area_var = None

    if y_dim == 'yh' and x_dim == 'xh':
        x_coord = 'geolon'
        y_coord = 'geolat'
        area_var = 'areacello'
    elif y_dim == 'yq' and x_dim == 'xh':
        x_coord = 'geolon_v'
        y_coord = 'geolat_v'
        area_var = 'areacello_cv'
    elif y_dim == 'yh' and x_dim == 'xq':
        x_coord = 'geolon_u'
        y_coord = 'geolat_u'
        area_var = 'areacello_cu'

    return x_dim, y_dim, z_dim, x_coord, y_coord, area_var
dims = identify_xyz_dims(ds[0][variable+'_annual_mean'].dims)
def annual_plot(variable, dims, label):
area = grd_xr[0][dims[5]].fillna(0)
x = dims[0]; y = dims[1]; z = dims[2]
lon = dims[3]; lat = dims[4]
model = []
for i in range(len(label)):
if z is None:
model.append(np.ma.masked_invalid(ds[i][variable+'_annual_mean'].values))
else:
model.append(np.ma.masked_invalid(ds[i][variable+'_annual_mean'].isel({z: 0}).values))
if i == 0:
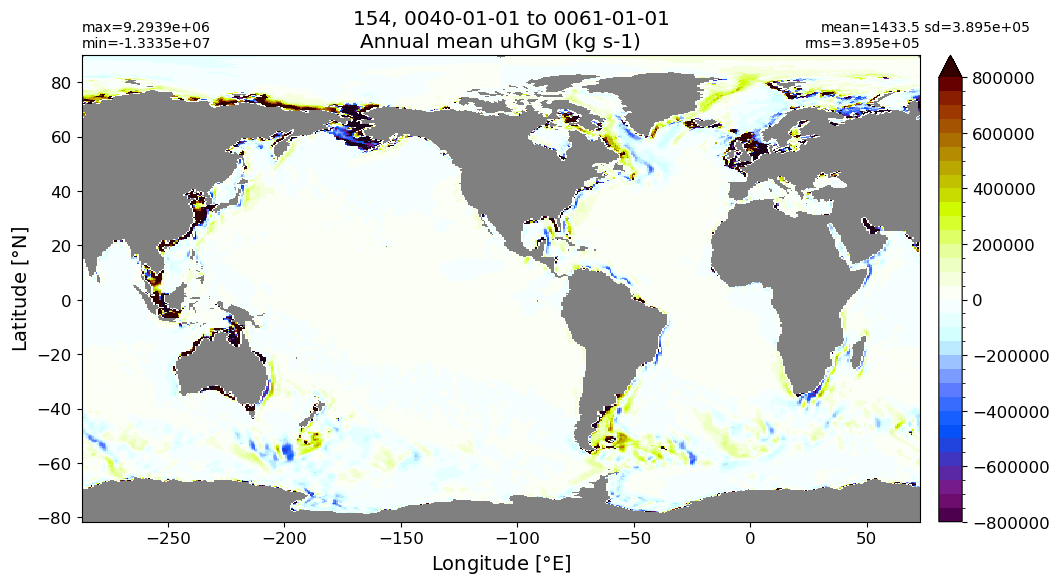
xyplot(model[i],
grd_xr[i].geolon.values, grd_xr[i].geolat.values, area.values,
title = 'Annual mean '+str(variable)+ ' ('+str(ds[0].units)+')',
suptitle= label[i]+', '+ str(start_date) + ' to ' + str(end_date),
extend='max')
else:
xyplot((model[i]-model[0]),
grd_xr[i].geolon.values, grd_xr[i].geolat.values, area.values,
title = 'Annual mean '+str(variable)+ ' ('+str(ds[0].units)+')',
suptitle= label[i]+' - '+label[0]+', '+ str(start_date) + ' to ' + str(end_date),
extend='max')
fig, ax = plt.subplots(figsize=(8,4))
for i in range(len(label)):
if z is None:
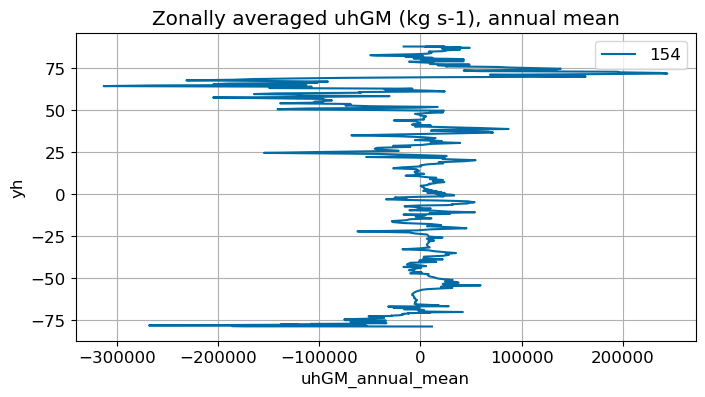
ds[i][variable+'_annual_mean'].weighted(area).mean(x).plot(y=y,
ax=ax, label=label[i])
else:
ds[i][variable+'_annual_mean'].isel({z: 0}).weighted(area).mean(x).plot(y=y,
ax=ax, label=label[i])
ax.set_title('Zonally averaged '+str(variable)+' ('+str(ds[0].units)+'), annual mean')
ax.grid()
ax.legend();
return
Annual mean#
annual_plot(variable, dims, label)
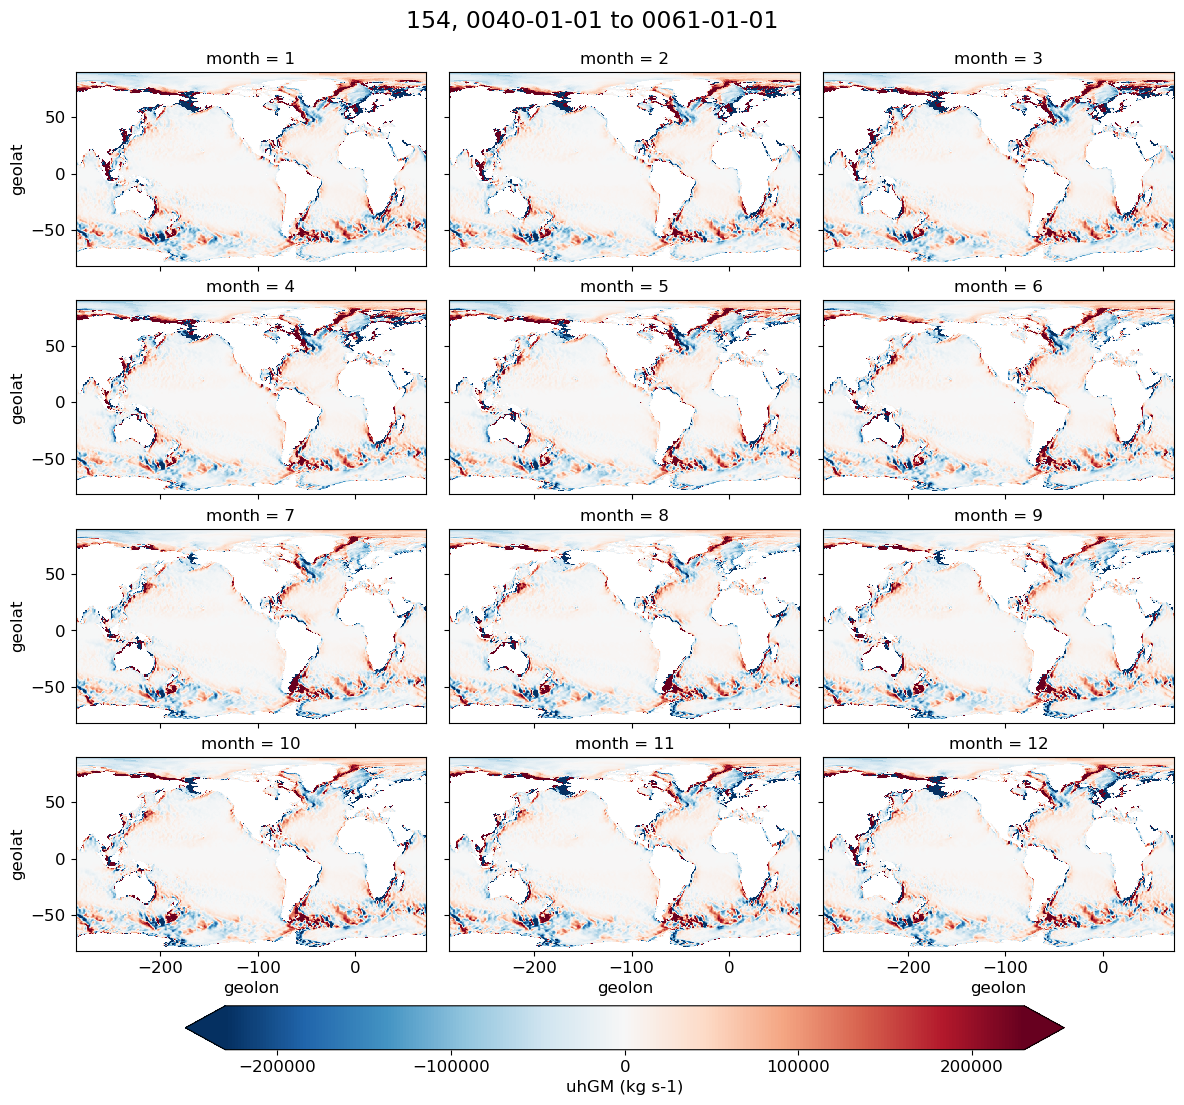
Monthly climatology#
area = grd_xr[0][dims[5]].fillna(0)
x = dims[0]; y = dims[1]; z = dims[2]
lon = dims[3]; lat = dims[4]
model = []
for i in range(len(label)):
    if z is None:
        model.append(ds[i][variable+'_monthly_climatology'])
    else:
        model.append(ds[i][variable+'_monthly_climatology'].isel({z: 0}))

    if i == 0:
        g = model[i].plot(x='geolon', y='geolat', col='month', col_wrap=3,
            figsize=(12,12), robust=True,
            cbar_kwargs={"label": variable + ' ({})'.format(str(ds[0].units)),
                        "orientation": "horizontal", 'shrink': 0.8, 'pad': 0.05})

        plt.suptitle(label[i]+ ', ' +str(start_date) + ' to ' + str(end_date), y=1.02, fontsize=17)

    else:
        g = (model[i]-model[0]).plot(x='geolon', y='geolat', col='month', col_wrap=3,
            figsize=(12,12), robust=True,
            cbar_kwargs={"label": variable + ' ({})'.format(str(ds[0].units)),
                        "orientation": "horizontal", 'shrink': 0.8, 'pad': 0.05})
        plt.suptitle(label[i] + ' - ' + label[0]+ ', ' +str(start_date) + ' to ' + str(end_date),
                     y=1.02, fontsize=17)
def monthly_plot(variable, dims, label, m):
area = grd_xr[0][dims[5]].fillna(0)
x = dims[0]; y = dims[1]; z = dims[2]
lon = dims[3]; lat = dims[4]
fig, ax = plt.subplots(figsize=(8,4))
for i in range(len(label)):
if z is None:
ds[i][variable+'_monthly_climatology'].isel(month=m).weighted(area).mean(x).plot(y=y,
ax=ax, label=label[i])
else:
ds[i][variable+'_monthly_climatology'].isel({z: 0, 'month': m}).weighted(area).mean(x).plot(y=y,
ax=ax, label=label[i])
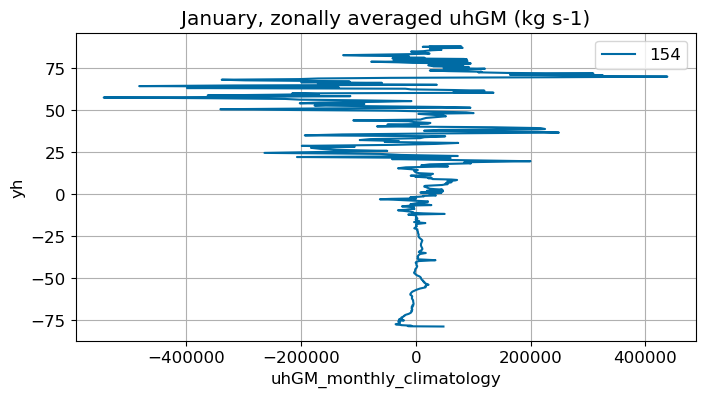
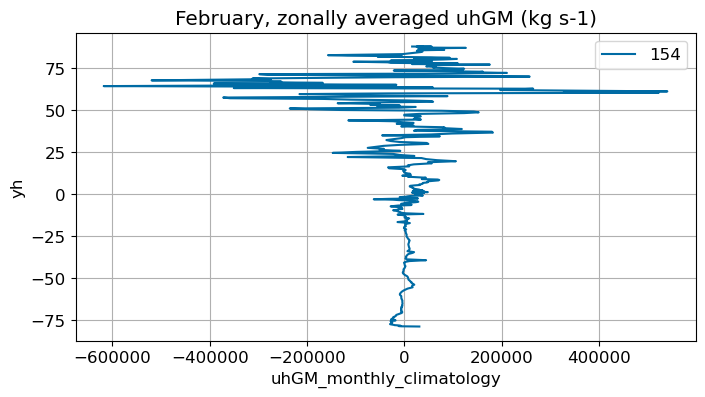
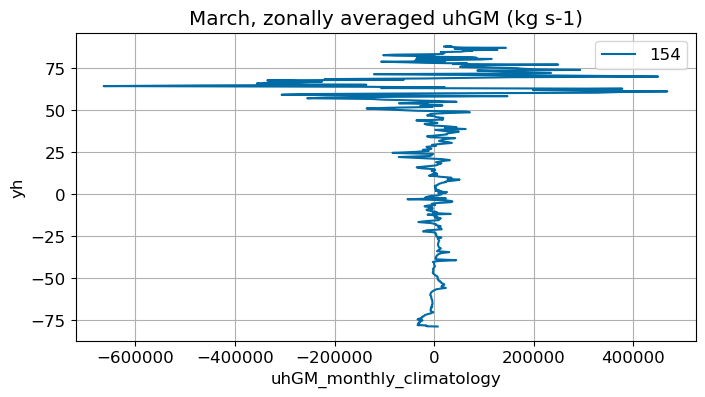
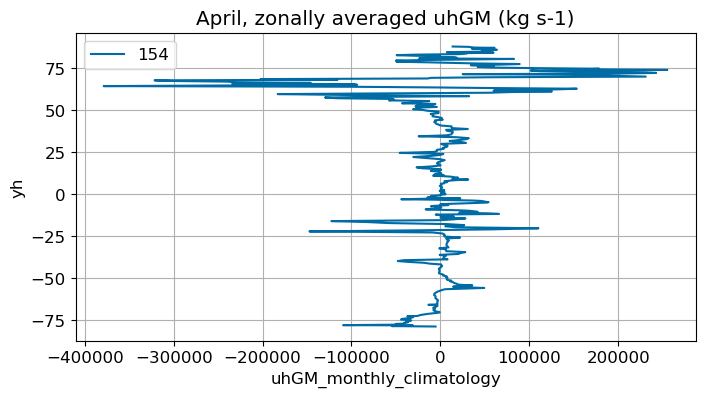
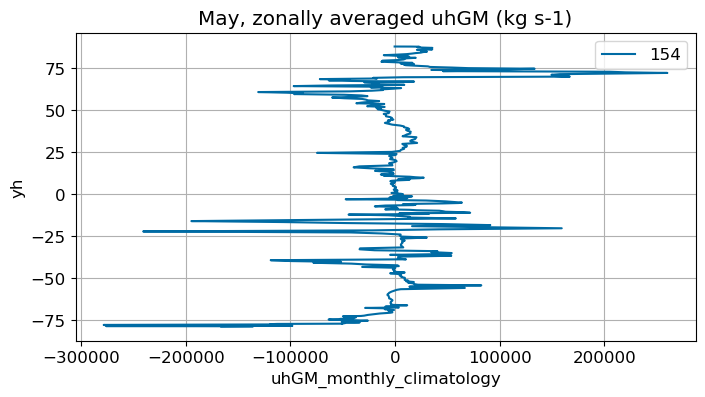
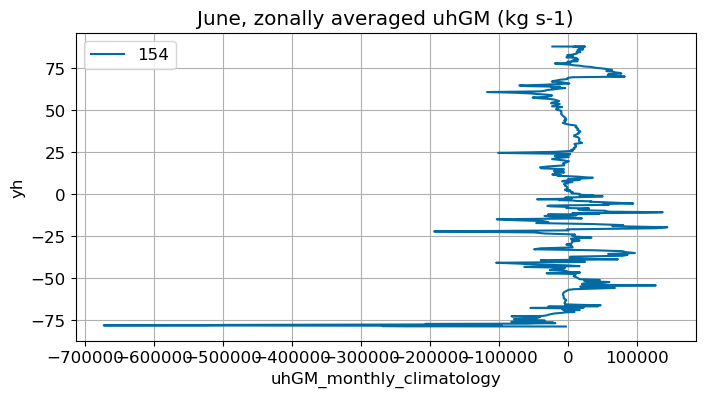
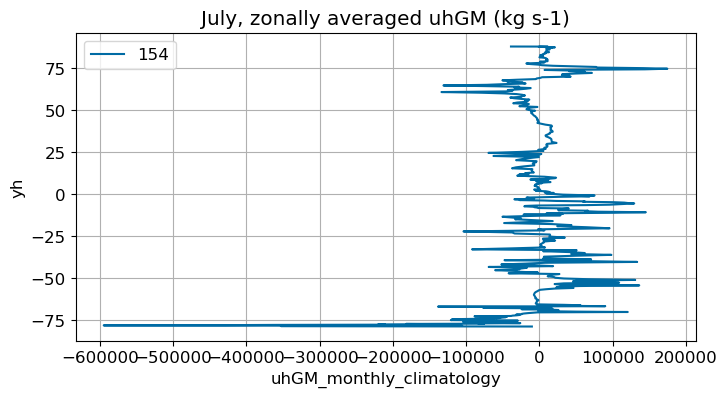
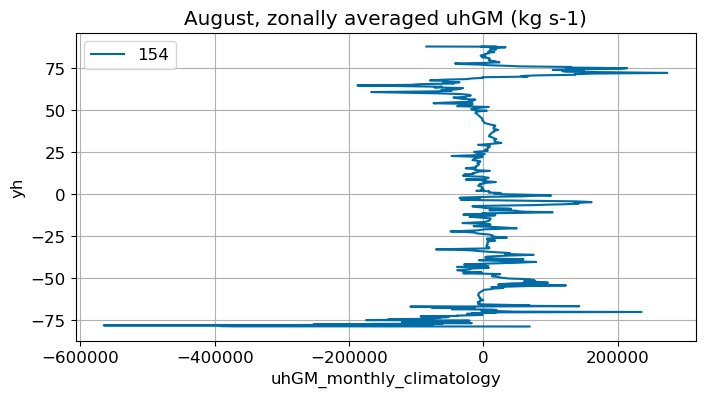
ax.set_title(str(months[m])+', zonally averaged '+str(variable)+' ('+str(ds[0].units)+')')
ax.grid()
ax.legend();
return
January#
m=0
monthly_plot(variable, dims, label, m)
February#
m=1
monthly_plot(variable, dims, label, m)
March#
m=2
monthly_plot(variable, dims, label, m)
April#
m=3
monthly_plot(variable, dims, label, m)
May#
m=4
monthly_plot(variable, dims, label, m)
June#
m=5
monthly_plot(variable, dims, label, m)
July#
m=6
monthly_plot(variable, dims, label, m)
August#
m=7
monthly_plot(variable, dims, label, m)
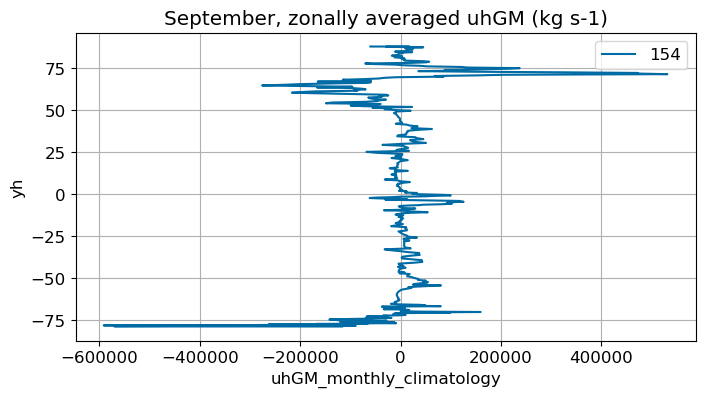
September#
m=8
monthly_plot(variable, dims, label, m)
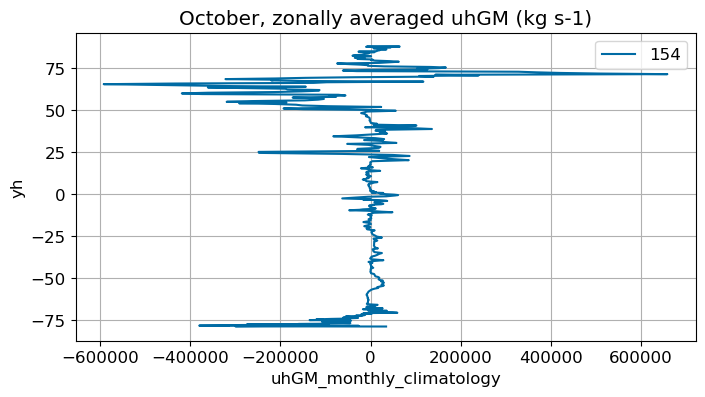
October#
m=9
monthly_plot(variable, dims, label, m)
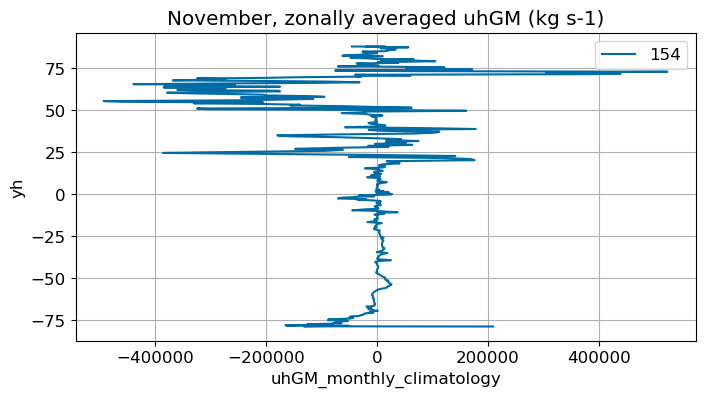
November#
m=10
monthly_plot(variable, dims, label, m)
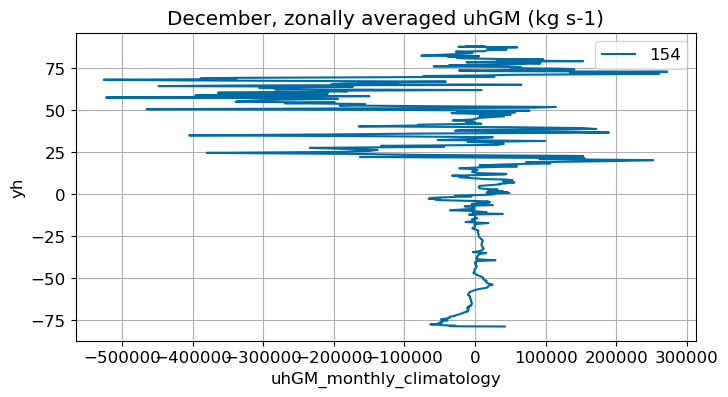
December#
m=11
monthly_plot(variable, dims, label, m)
By basins#
Monthly climo @ surface#
# GMM, update this
basin_code = xr.open_dataset('/glade/work/gmarques/cesm/tx2_3/basin_masks/basin_masks_tx2_3v2_20250318.nc')['basin_masks']
area = grd_xr[0][dims[5]].fillna(0)
x = dims[0]; y = dims[1]; z = dims[2]
model_mean_wgt = []

for i in range(len(label)):
    basin_code_dummy = basin_code.rename({'yh': y, 'xh': x})
    if z is None:
        model = ds[i][variable+'_monthly_climatology']
    else:
        model = ds[i][variable+'_monthly_climatology'].isel({z: 0})

    model_mean_wgt.append((model * basin_code_dummy).weighted(area*basin_code_dummy).mean(dim=[y, x]))

# Concatenate along a new dimension
model_mean_wgt_all = xr.concat(model_mean_wgt, dim='cases')
model_mean_wgt_all = model_mean_wgt_all.assign_coords({'cases': label})

g = model_mean_wgt_all.plot(x="month", hue="cases", yincrease=False, col="region", col_wrap=5)

fig = g.fig  # not g.figure
fig.suptitle(str(variable)+' ('+str(ds[0].units)+')', fontsize=16)
fig.tight_layout()
fig.subplots_adjust(top=0.9)
for ax in g.axes.flat:
    ax.grid(True);
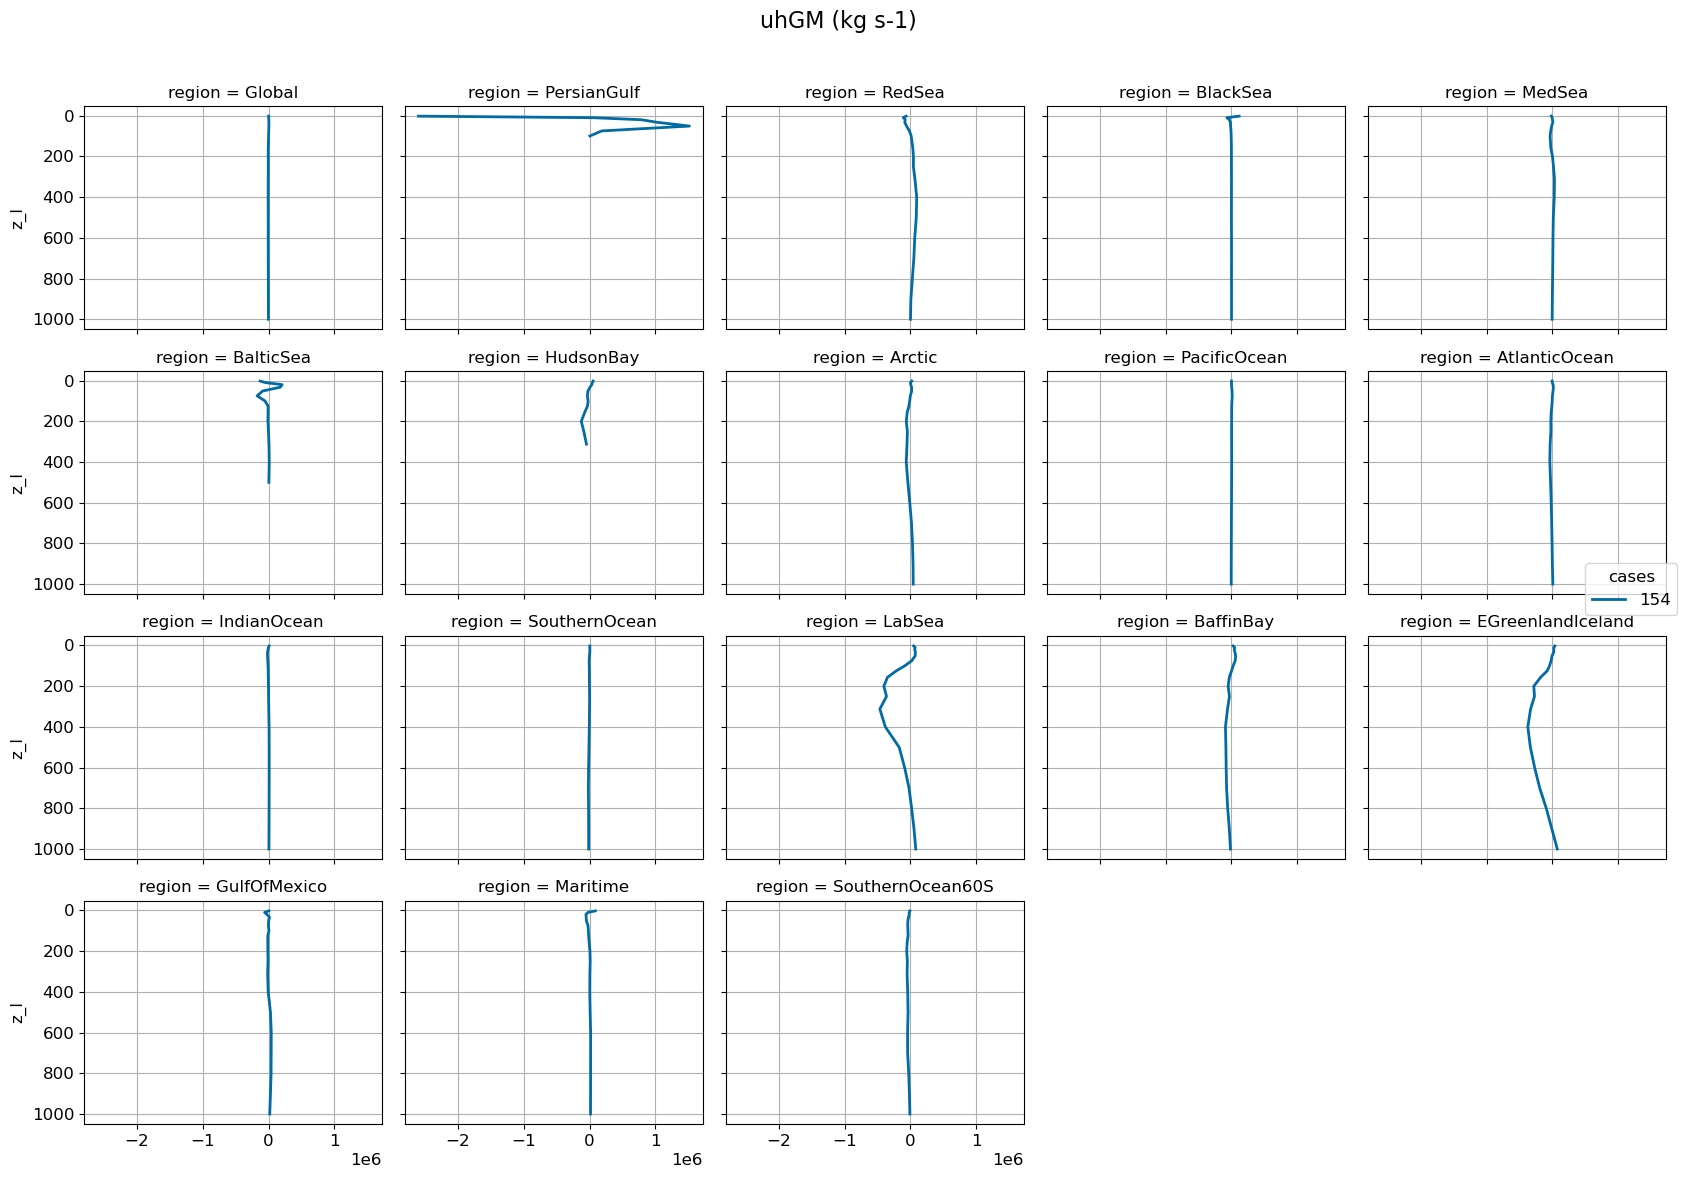
Vertical profiles#
Averaged over annual means
z_max=1000 # change this to 6000 to see full profile

if stream == 'z' and (z == 'z_l' or z == 'z_i'):

    model_mean_wgt = []

    for i in range(len(label)):
        basin_code_dummy = basin_code.rename({'yh': y, 'xh': x})
        model = ds[i][variable+'_annual_mean']

        model_mean_wgt.append((model * basin_code_dummy).weighted(area*basin_code_dummy).mean(dim=[y, x]))

    # Concatenate along a new dimension
    model_mean_wgt_all = xr.concat(model_mean_wgt, dim='cases')
    model_mean_wgt_all = model_mean_wgt_all.assign_coords({'cases': label})

    g = model_mean_wgt_all.sel(**{z: slice(0., z_max)}).plot(y=z, hue="cases", yincrease=False, col="region", col_wrap=5, lw=2)

    fig = g.fig  # not g.figure
    fig.suptitle(str(variable)+' ('+str(ds[0].units)+')', fontsize=16)
    fig.tight_layout()
    fig.subplots_adjust(top=0.9)
    # Apply grid to each subplot
    for ax in g.axes.ravel():
        ax.grid(True)